Sputnik Moment: A reference to the Soviet Union’s 1957 launch of the first Earth-orbiting artificial satellite Sputnik 1 which caught the USA unprepared. The event ignited the Space Race during the Cold War, and led to the USA successfully completing a human landing on the Moon in 1969.
A Sputnik moment is a point where people realise that they are threatened or challenged and have to redouble their efforts to catch up.
Poor Manufacturing Orders Point to Slower Economic Growth
Orders for so-called durable goods—manufactured products designed to last at least three years, such as cars, appliances and commercial aircraft—tumbled 2.1% from the prior month to a seasonally adjusted $248.4 billion in April, the Commerce Department said Friday. The government also said such orders grew less than previously estimated in March, painting a weaker picture of U.S. factory demand than anticipated.
Much of the decline owed to the volatile civilian-aircraft component, which dropped 25% from March following a decision by global aviation authorities to ground Boeing Co.’s 737 MAX airliner after a pair of fatal crashes. The company didn’t log any commercial orders for 737 planes in March or April, the first months without a sale of its best-selling aircraft in seven years. Boeing in April cut production of the MAX by a fifth, likely putting it behind Airbus SE this year as the world’s biggest plane maker. (…)
The durable goods report Friday showed a closely watched measure of business investment—new orders for nondefense capital goods excluding aircraft—slipped 0.9% last month and was revised lower for March. That left the year-over-year gain in the category at 1.3%, the smallest since January 2017. (…)
Research firm Macroeconomic Advisers lowered its estimate of second-quarter growth to a 1.7% pace from 1.9% in the wake of Friday’s report. (…)
The chart suggests that we have hit some kind of cyclical top on non-def capex orders ex-air…

…but is it a coincidence that the trade war with China effectively started July 6, 2018. Capex grew 6.7% in 2017, 8.3% annualized between January and July 2018. Last 9 months: –2.3% annualized, last 6 months: –13.2% annualized. The only other possible cause is the rise in short term interest rates.

Corporate America is highly indebted, therefore very sensitive to rising interest rates, but even more so to heightened uncertainty regarding future business trends. As I evidenced last Friday, corporate confidence has dropped considerably in recent months and this inevitably leads to increased caution on executive floors. Note on the chart below how weak present conditions are and how low expectations have become. The worst case scenario here would be that this caution in capex spending translates into reduced hiring and other costs and, god forbids, reduced stock buybacks to shore up deficient balance sheets.
 Source: Moody’s Analytics (via The Daily Shot)
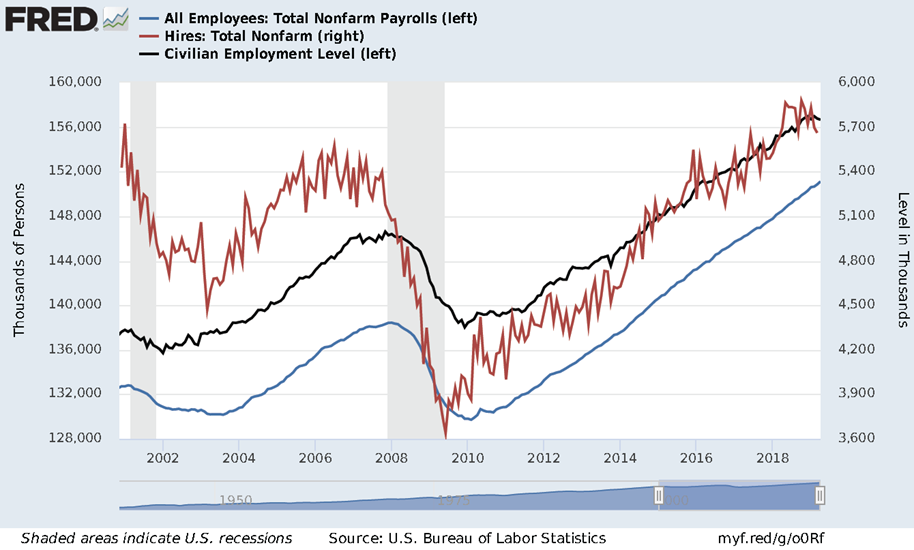
This next chart plots 3 measures of employment. Nonfarm Payrolls remain in a strong uptrend but both Civilian Employment (Household survey) and Hires (JOLT) are showing signs of peaking out. The number of Hires is down 3.7% from its October 2018 peak and Civilian Employment peaked in February. There was a similar growth scare in 2016 after oil prices collapsed but this slowdown seems more widespread:

Danish shipping giant A.P. Moeller-Maersk AS swung to a first-quarter loss and warned that rising trade tensions between the U.S. and China could cut container growth by up to a third this year. (…)
Demand for shipping consumer goods, manufacturing parts and other anchors of global trade is waning at the start of the season when retailers typically stock up for the year-end holidays.
“New tariffs can potentially reduce expected growth in global container volumes by up to 1 percentage point,” from Maersk’s current projection of 3% growth, Maersk Chief Executive Soren Skou said in an investor conference call Friday. Chief Financial Officer Carolina Dybeck-Happe said on the earnings call, “We still see uncertainties related to the market outlook, mainly related to…the weak global economic growth, in addition to risk from a further escalation of trade tensions between the U.S. and China.” (…)
U.S. container imports into the West Coast fell 0.5% in the first quarter from a year ago, according to Bimco, a shipping industry group, and exports from those ports most exposed to trans-Pacific trade fell 18% in the same period.
A $600 Billion Bill: Counting the Global Cost of the U.S.-China Trade War Bloomberg economists Dan Hanson and Tom Orlik have mapped out the main scenarios. Their headline conclusion: If tariffs expand to cover all U.S.-China trade, and markets slump in response, global GDP will take a $600 billion hit in 2021, the year of peak impact
Trump’s ‘Easy’ Trade War Hits Snags as China Plays the Long Game
(…) The hope for a respite from rising tensions now rests on a planned meeting between Trump and Xi on the sidelines of a late-June Group of 20 Summit in Japan. But it’s not clear that meeting will even take place. Cui Tiankai, China’s ambassador to the U.S., told Bloomberg Television on Friday that there had not yet been any official discussions about a meeting, though “the possibility is always open.” (…)
China wants a truce but isn’t putting its guns down yet. Chinese envoy Cui Tiankai said Beijing wants an agreement but is prepared to do “whatever’s necessary” to protect its interests. He called the Huawei ban an “unusual” act of state power and warned of prompt retaliation if things do not move in a more cooperative direction. “Trade is about mutual benefits,” he told Bloomberg TV. “War is about mutual destruction.” (Bloomberg)
Trump’s Throttling of Huawei Could Backfire on U.S. Tech
(…) By cutting off the Chinese tech giant, the U.S. will only slow the expansion of 5G. That’s bad news for some of the most important U.S. companies, particularly component makers, that were banking on it for a major surge in orders starting this year.
Without China’s 5G network, consumers there won’t buy new phones that contain chips from Qualcomm Inc. and Micron Technology Inc. They won’t generate data that need to be crunched by processors made by Intel Corp., Nvidia Corp. and Advanced Micro Devices Inc. And there’ll be no need for faster networking gear powered by chips from Broadcom Inc. and Xilinx Inc. (…)
In a written submission to the Department of Commerce, Microsoft warned that the proposed restrictions risked isolating the U.S. from international research collaborations and “could thwart U.S. interests.”
“Artificial intelligence is a very broad concept,” GE cautioned in its own submission. Defined too broadly export controls could sweep up things like medical imaging where algorithms are being used to scan for diseases and in toys, it said. (…)
Trump’s China Feud Threatens 5G Growth in U.S. The Trump administration’s offensives aimed at frustrating the 5G ambitions of China and mobile-technology giant Huawei might end up impeding America’s wireless ambitions, too.
The blacklisting of Huawei might be China’s Sputnik moment (Fareed Zakaria)
Many of us have been waiting for a new Sputnik moment, the point at which the challenge from China spurs the United States to get its act together. We may now be witnessing such a watershed, but in Beijing. The Trump administration’s decision to blacklist Huawei — the world’s seventh-largest technology company — might well be China’s Sputnik moment, with seismic consequences. (…)
If Washington can cut China off from American technology at will, China will be determined to build its own technological infrastructure, top to bottom. Huawei, anticipating this moment, has been developing its own operating system, which doesn’t rely on U.S. companies, and says it could be in place by year’s end. (Losing ARM would actually be a much more crippling loss for the Chinese company, making it extremely difficult for Huawei to produce its own chips.) Watching China’s technological prowess these days, it is easy to imagine the country rising to this challenge. (…)
The British government has concluded that it can use Huawei’s technology as long as certain safeguards are put in place. We need to understand why London is wrong and Washington is right. (…)
A senior European leader told me [Fareed Zakaria] that President Trump has dismissed European offers to act together on trade.
(…) we should think through what this bipolar world would look like. China’s technology will be cheaper because of its lower labor costs, looser regulations and government assistance. Huawei is already dominant in the developing world. Many of those countries might well keep opting for the cheaper technology. In their view, whatever technology they choose comes with the risk that a government — China’s or America’s — will snoop on them. (…)
Finally, isn’t the real answer to China’s extraordinary gains in technology to make the policy changes and investments that allow the United States to compete with Beijing? It is difficult to imagine that Washington would be able to shut down the economic rise and innovations of a dynamic country of 1.4 billion people that already boasts many of the globe’s top tech companies. Instead, we need our own Sputnik moment, focusing the country to outcompete China. (…)
President Trump’s own Sputnik moment will happen well before the date circled red on his calendar: November 3, 2020. That’s 534 days from now, one-and-a-half year. Since 1945, U.S. recessions lasted 11 months on average. President Xi has no such circles on his calendar.
Recent data point to 1.3% GDP growth in Q2. 
Friday:
U.S. industrial production was up only 0.9% YoY in April (manufacturing IP: 0.0%). This should not be taken lightly, it does not get that weak often:

Total IP is down 3.8% annualized YtD, manufacturing IP –5.0% a.r.. And new manufacturing orders are now weaker than at any time since 2009:

U.S. GDP grew 3.2% in Q1 but the reality is that domestic demand slowed considerably to a +1.2% annualized rate while inventories accumulated because of the trade war.

Total Business Sales sequential growth actually was negative in Q4’18 (-0.4% a.r.) and only +1.0% a.r. in Q1’19. YoY, Business Sales growth rate slowed from +6.9% during the first 9 months of 2018 to +3.8% in Q4’18 and +3.0% in Q1’19. The current slowdown looks broader than the 2015 oil-related collapse with an obvious inventory accumulation during Q1.

In fact, NBF Economics says that inventory accumulation is also seen in Emerging Markets and potentially throughout the world given the collapse in global exports has not been matched with a similar drop in industrial production.
In all, the world Goods economy is in or close to recession and the U.S. is not immune to it.
True, 70% of the U.S. economy is Services. But in case you missed it last week:
The seasonally adjusted IHS Markit Flash U.S. Services PMI™ Business Activity Index posted 50.9 in May, down from 53.0 in April, to indicate a notable slowdown in service sector business activity. The upturn was only marginal overall and the slowest since the current sequence of expansion began in March 2016.
In line with the slower rise in business activity, new orders increased only slightly, as the rate of growth eased for the third successive month amid softer demand conditions and intense competition. Subsequently, the level of outstanding business fell for the first time this year and employment growth dipped to a 25-month low.
Growth scare about to happen:

The U.S. bond market is certainly not behaving like this is a 3% growth environment.

10Y treasury yields have collapsed 100 bps (31%) since November 2nd and the yield curve has inverted again. This inversion is getting more serious.

Meanwhile, the Fed is focused on slowflation, trying to convince itself and the world that it’s only transitory and that its elusive 2% target remains valid.
Here’s Markit again (my emphasis):
Input price inflation eased for the third month running in May, despite continued comments from survey contributors regarding the ongoing impact of tariffs. Instead, weak demand prompted increased price competition among suppliers. The slower increase in costs and greater competitive pressures underpinned a renewed fall in output charges, the first such decline since February 2016.
The drop in the surveys price gauges suggests that inflationary pressures continued to moderate. The composite input price index covering both goods and services has a strong correlation with future CPI and PCE inflation rates, and signals that both annual consumer price and PCE inflation could weaken in coming months as pricing power fades alongside weaker demand.

-
Cable Answers Cord-Cutters With Half-Price Cellphone Service Cable-TV provider Altice USA is preparing to launch a mobile service likely to cost between $20 and $30 a phone, joining Comcast and Charter in trying to stem cord-cutting by undercutting wireless carriers.
-
What If the Trade War Is Really Deflationary? Gary Shilling
(…) A 25% jump in the cost of all $575 billion in goods imported from China, even without markups and follow-on increases from competing U.S. producers, would add about 1% to consumer prices.
In reality, however, import tariffs and the whole trade war are more likely to be deflationary as governments, businesses and consumers here and abroad take offsetting actions and the conflict takes its toll on global economic growth. News reports say U.S. importers are switching to suppliers in more-certain countries such as Vietnam, Thailand, Pakistan and Taiwan. This is costly and disruptive, but has been underway ever since Trump’s 2016 election victory. (…)
If you’re worried about the Fed overreacting to trade war-induced inflation, relax. The deflationary implications of the trade imbroglio are more likely to speed up the Fed’s timetable for an interest rate cut.
EARNINGS WATCH
From Refinitiv/IBES
- Through May 24, 483 companies in the S&P 500 Index have reported earnings for Q1 2019. Of these companies, 75.2% reported earnings above analyst expectations and 18.8% reported earnings below analyst expectations. In a typical quarter (since 1994), 65% of companies beat estimates and 21% miss estimates. Over the past four quarters, 76% of companies beat the estimates and 17% missed estimates.
- In aggregate, companies are reporting earnings that are 6.0% above estimates, which compares to a long-term (since 1994) average surprise factor of 3.2% and the average surprise factor over the prior four quarters of 5.4%.
- The estimated earnings growth rate for the S&P 500 for 19Q1 is 1.5%. If the energy sector is excluded, the growth rate improves to 2.9%.
- Of these companies, 57.1% reported revenues above analyst expectations and 42.9% reported revenues below analyst expectations. In a typical quarter (since 2002), 60% of companies beat estimates and 40% miss estimates. Over the past four quarters, 67% of companies beat the estimates and 33% missed estimates.
- In aggregate, companies are reporting revenues that are 0.8% above estimates, which compares to a long-term (since 2002) average surprise factor of 1.5% and the average surprise factor over the prior four quarters of 1.1%.
- The estimated revenue growth rate for the S&P 500 for 19Q1 is 5.6%. If the energy sector is excluded, the growth rate improves to 6.2%.
- The estimated earnings growth rate for the S&P 500 for 19Q2 is 1.0%. If the energy sector is excluded, the growth rate improves to 1.0%.
Analysts’ revisions have turned down again:


Corporate pre-announcements are slightly worse than at the same time during Q1’19 but with fewer negatives, which one can see as a positive.

Trailing EPS are now $163.84, up about $1.00 (0.6%) from Q4’19, nothing to write home about but better than expected nonetheless, and still rising.
TECHNICALS WATCH
Lowry’s Research has maintained a no-bear stance on U.S. equity markets throughout the volatile last 18 months. It did, however, warned of a possible correction on October 24, 2018 when its Selling Pressure Index crossed above its Buying Power Index. It wavered along with the significant market volatility seen in October-November 2018 and missed the sharp December correction.
Its current analysis seems to have learned from this episode. In effect, Lowry’s Selling Pressure Index is again threatening a cross above its Buying Power Index very similar to that of late October 2018. Lowry’s current warning of a possible correction ahead compares the current reading to a falling barometer: “hurricanes (i.e., bear markets) do not always follow a falling barometer, but there was never a hurricane that was not accompanied by such action.”
Still, Lowry’s sees slim chances of a true bear thanks to still positive breadth.
A no-bear call is not a no-correction guarantee. I am no great fan of such comparisons but the similarities in the current trends of Lowry’s Supply/Demand gauges with their late 2018 trends are also visible on the S&P 500 Index trend:

The equal-weight SPY (RSP in blue) is also weaker than the main index:

Financials are not contributing much to the recent rally to the point where the sector’s 200-d m.a. has turned down again, in spite of relatively good revenues, earnings and margins.

The Fed is not hawkish now as it was last fall but the economy is showing more growth scare data while the trade war shows no signs of ending, quite the opposite in fact. Recession calls from good economists like David Rosenberg and Gary Shilling could well gain credibility in coming weeks. BTW, Steve Blumenthal has posted Rosenberg’s recent presentation at John Mauldin’s SIC conference here.
Earnings have not wavered much yet but expected growth of +1.0% and +1.7% for Q2 and Q3 are not stressless and are still flirting with a possible earnings recession.
 With valuations only slightly below fair value, weak earnings growth, weak economic data, high debt levels, a dangerous geopolitical environment and delicate technicals, equity markets are very vulnerable to shifting sentiments. It so happens that Sentimentrader’s Smart Money/Dumb Money Confidence gauge is also at a dangerous cross point similar to last October.
Maybe President Trump will again tweet some trade war hopeful words to reinvigorate markets but I sense that both Chinese leaders and investors are less gullible than before and will need more concrete evidence that a resolution is possible.
Oh! Add this to your plate:
London markets fall as Italy worries spread
(…) Italian banks were stung by the latest from Brussels following the European election results Sunday, where right-wing anti-Euro party Lega Nord topped the polls with 34.3% of the vote. With a clash looming among Italian deputy Prime Minister Matteo Salvini and the European Council over budgetary restraint, the spread among Italian and benchmark German 10-year government bonds shot to 2.88. (…)


 Japanese business people are totally depressed:


 Source: Charles Schwab, Cornerstone Macro, as of April 30, 2019. *Includes foods, transportation, appliances, electronics, household equipment & furnishings, apparel & accessories, recreational goods, misc.