Well, it sure looks like the Chinese have finally decided to play right on Trump’s court:
- they are now using a blog to send messages;
- they show independence, also announcing being “in no rush for a deal”;
- they also accuse the U.S. of “not keeping their word”;
- they aggressively manipulate public opinion through the media;
- and they squarely sent the ball in the U.S. court, requiring “gestures of sincerity” and ‘no more little tricks” before any other talks.
The Art of the Deal is being put to test: will Trump go ahead with the all-out tariffs, risk a long and nasty fight, potentially leading the U.S. in a recession before the elections and a possible equity market correction?
China estimates a 25% blanket tariff would cut its 6.5% GDP growth rate by no more than 1.0% to about 5.5-5.8%. Oxford Economics estimates the U.S. GDP would get shaved by 0.5% to just around 2.0%. An all-out trade war would cut China’s GDP by 2.5% to around 4.0% but put the rest of the world, including the U.S., in recession.
Xi faces no elections as far as he can see. The U.S. 2020 elections are Trump’s to lose from what we can currently see. But keep in mind that, so far, there has been no USMCA deal, no Japan deal, no Europe deal and no China deal. Nothing concrete with North Korea, a bizarre love-hate relationship with Putin and a dangerously escalating hate-hate relationship with Iran. Not mentioning significantly deteriorated relations with long-time allies like Canada, the U.K., Germany and France.
And the effects of the tax reform are rapidly fading away…
This ain’t no “very beautiful letter” from Trump’s “good friend” Xi:
China Downplays Chances for Trade Talks While U.S. Plays ‘Little Tricks’
China’s state media signaled a lack of interest in resuming trade talks with the U.S. under the current threat to escalate tariffs, while the government said stimulus will be stepped up to buttress the domestic economy.
Without new moves that show the U.S. is sincere, it is meaningless for its officials to come to China and have trade talks, according to a commentary by the blog Taoran Notes, which was carried by state-run Xinhua News Agency and the People’s Daily, the Communist Party’s mouthpiece. The Ministry of Commerce spokesman said Thursday he had no information about any U.S. officials coming to Beijing for further talks.
“If the U.S. doesn’t make concessions in key issues, there is little point for China to resume talks,” said Zhou Xiaoming, a former commerce ministry official and diplomat. “China’s stance has become more hard-line and it’s in no rush for a deal” because the U.S. approach is extremely repellent and China has no illusions about U.S. sincerity, he said.
According to Zhou, the commerce ministry spokesman on Thursday effectively ruled out talks in the near term. In comments to the media, ministry spokesman Gao Feng said that China’s three major concerns need to be addressed before any deal can be reached, adding that the unilateral escalation of tensions in Washington recently had “seriously hurt” talks.
On Friday, China’s government said that it will work to counteract the effects of more U.S. tariffs and keep the economy in a “reasonable range.” The National Development and Reform Commission is studying the impact of U.S. tariffs and will roll out “responsive measures when necessary,” spokeswoman Meng Wei said at briefing in Beijing. (…)
The U.S. has been talking about wanting to continue the negotiations, but in the meantime it has been playing “little tricks to disrupt the atmosphere,” according to the Taoran commentary on Thursday night, citing Trump’s steps this week to curb Chinese telecom giant Huawei Technologies Co.
“We can’t see the U.S. has any substantial sincerity in pushing forward the talks. Rather, it is expanding extreme pressure,” the blog wrote. “If the U.S. ignores the will of the Chinese people, then it probably won’t get an effective response from the Chinese side,” it added. (…)
The blog reiterated China’s three main concerns for a deal are tariff removal, achievable purchase plans and a balanced agreement text, as first revealed by Vice Premier Liu He. They mark the official stance as much as the will of the Chinese public, it wrote.
“If anyone thinks the Chinese side is just bluffing, that will be the most significant misjudgment” since the Korean War, it said. (…)
From Reuters:
(…) One company that says it has been making preparations is Huawei’s Hisilicon unit, which purchases U.S. semiconductors for its parent.
Its president told staff in a letter on Friday that the company had been secretly developing back-up products for years in case Huawei was one day unable to obtain the advanced chips and technology it buys from the United States.
“Today, the wheel of destiny has turned and we have arrived at this extreme and dark moment, as a super-nation ruthlessly disrupts the world’s technology and industry system,” the company president said in the letter.
The letter was widely shared on Chinese social media, gaining 180 million impressions in the few hours after it was published on the Weibo microblogging site. (…)
U.S. Housing Starts Post a Solid Increase
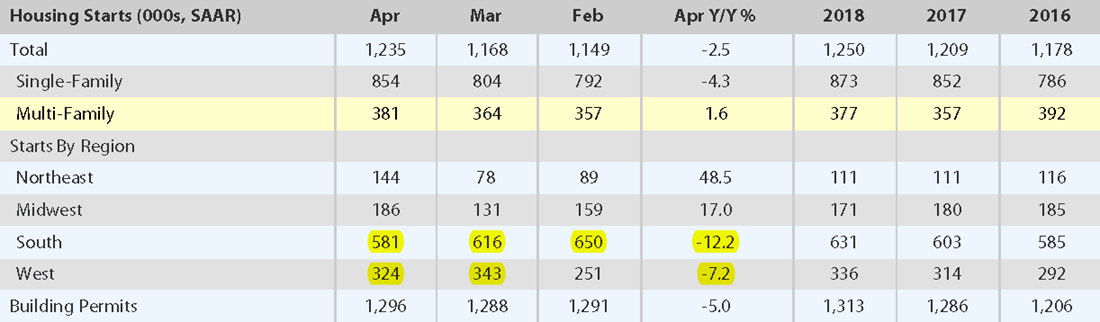
Housing starts rose 5.7% during April to 1.235 million units (SAAR) following a March improvement to 1.168 million units, revised from a slight m/m decline. Despite the latest increase, housing starts were 2.5% lower than one year earlier.
Starts of single-family homes strengthened 6.2% (-4.3% y/y) to 854,000 last month from 804,000 in March, revised from 785,000. Multi-family housing starts rose 4.7% (1.6% y/y) to 381,000 units, the highest level since November. (…)
Building permits improved 0.6% last month (-5.0% y/y) to 1.296 million following three straight monthly declines. Permits to build a single-family home fell 4.2% (-9.4% y/y) to 782,000, the lowest level since November 2016. Multi-family building permits recovered 8.9% (2.6% y/y) to 514,000, the highest level since March of last year.


Last month’s strength was from the Northeast and the Midwest. Housing’s two stalwarts, the South and the West, were weak.
Bank of Canada Sees Financial Risks Rising on Weaker Growth
The Bank of Canada said risks to the financial system have increased “slightly” over the past year amid growth worries and expanded risk-taking in global markets, while reiterating its confidence in the country’s ability to handle any shock.
In its annual Financial System Review, Canada’s central bank cited slowing growth, trade uncertainty, falling oil prices and riskier borrowing in the corporate sector as reasons why risks to financial stability have picked up. At the same time, key vulnerabilities in the system that would amplify shocks — primarily high household indebtedness and pricey housing markets — have eased, it said. (…)
“New measures have curbed borrowing, reduced speculative behavior in housing markets and made the financial system more resilient,” the governor said. (…)
The Bank of Canada, however, did identify one new emerging vulnerability: rising corporate debt levels, particularly among businesses with lower creditworthiness. This has made the sector more susceptible to shifts in investor sentiment and a repricing of risk.
While the development is global, the central bank said corporate debt in Canada has also risen to well above historical levels, driven by commodity sectors with a growing reliance on U.S. high-yield bonds and leveraged loans.
Still, stress tests conducted by the Bank of Canada indicate that even if major risks materialize to the system, large Canadian banks would be well positioned to manage them.
Deere blames escalating trade war for worsening outlook Deere & Co on Friday missed quarterly profit estimates for the fifth-straight quarter and cut its full-year outlook, as an escalating U.S.-China trade war threatens to further hit farm incomes and demand for Deere’s equipment.
Nvidia backs away from confirming full-year guidance US chipmaker says it lacks visibility into future orders as revenues firm slightly
Trump’s ‘Maximum Pressure’ on Enemies Hits Its Limit
(…) The challenge the U.S. faces, and the loneliness of its campaign, were on display during Secretary of State Michael Pompeo’s hastily scheduled stop in Brussels this week, when he met with the foreign ministers of the U.K., France and Germany to underscore the urgency of the threat posed by Iran. But European leaders openly expressed their exasperation with the U.S. approach to Iran.
“I have to say that this is a distressful example of U.S. unilateralism — it is short-term and inconsiderate of interests” of some of its closest allies, Germany’s Deputy Foreign Minister, Niels Annen, said afterward during a speech in Berlin. “The current situation in the region, ladies and gentlemen, is extremely dangerous.”
Annen’s remarks reflected how U.S. goals have been tripped up by its consistent use of strong-arm tactics with nations whose support it later needs to box in its adversaries. Allies such as Canada, France, the U.K., Mexico and Germany have all come in for withering public criticism for not bending to U.S. requests on key issues — only to be courted on others. (…)


 Trump’s Huawei Threat Is the Nuclear Option to Halt China’s Rise
 The problem here is that Huawei has the critical world patents for 5G, particularly on polar coding, as the
