The enemy of knowledge is not ignorance, it’s the illusion of knowledge (Stephen Hawking)

It ain’t what you don’t know that gets you into trouble. It’s what you know for sure that just ain’t so (Mark Twain)

Invest with smart knowledge and objective odds

THE DAILY EDGE: 14 FEBRUARY 2019

U.S. CPI Holds Steady as Energy Prices Decline; Core Prices Increase Steadily

The Consumer Price Index remained unchanged during January for the third consecutive month. (…) The 1.6% y/y increase was the weakest since September 2016. The CPI excluding food & energy increased an expected 0.2% (2.2% y/y) for the eighth month in the last nine. (…)

The rise in the “core” CPI reflected a fourth consecutive 0.2% increase in services prices. The 2.8% y/y rise moderated, however, from its 3.1% peak this past June. Medical care service price inflation eased to 0.3% from two months at 0.4%, and the y/y rise moderated to 2.4%. The cost of shelter increased a steady 0.3% (3.2% y/y) as the owners’ equivalent rent of primary residences rose 0.3%, and by a lessened 3.2% y/y. Primary shelter rents increased an improved 0.3% (3.4% y/y). (…)

Goods prices excluding food & energy rose 0.4% following December’s stability. The 0.3% y/y gain was the strongest since 2009 and compared to price deflation from 2013 until September 2018. The latest rise was dominated by a 1.4% strengthening (6.4% y/y) in household appliance prices which followed a 0.2% decline. Apparel prices also exhibited strength with a 1.1% rise (0.1% y/y) after holding steady in December. Household furnishings costs gained 0.4% (1.2% y/y) following two months of little change. (…) New vehicle prices rose 0.2% and were unchanged y/y. Medical care goods prices inched 0.1% higher (-0.3% y/y) following a 0.4% decline.

Food prices rose 0.2% (1.6% y/y) last month as meat prices strengthened 0.9% (0.1% y/y). (…)

 large image large image

Looking at the last 6, core CPI is up at a 2.2% annualized rate but the last 3 months a.r. is 2.6%. In fact, it looks like everything is rising at 0.2% or 0.3% MoM. Beware FOMC!

image

  • The Atlanta Fed’s sticky-price consumer price index (CPI)—a weighted basket of items that change price relatively slowly—rose 2.6 percent (on an annualized basis) in January, following a 2.6 percent increase in December. On a year-over-year basis, the series is up 2.4 percent.

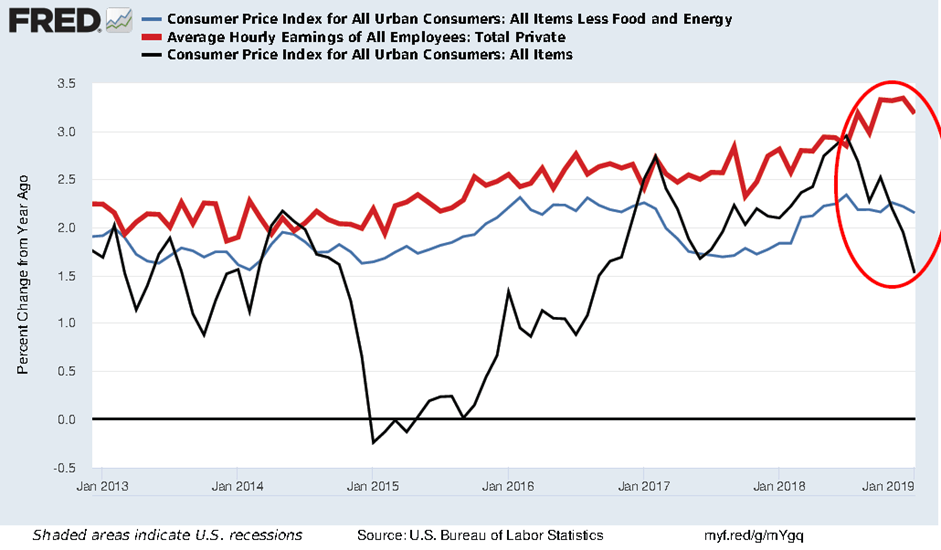
Wages are accelerating against decelerating inflation. Good for consumer spending.
image

Here’s the real earnings of private employees using core CPI. At 1.0% YoY, nothing to spur a spending boom but better than the 2007-08 trend. Against total CPI, however, real wages are up 1.7% YoY. This should help sustain real spending over the shorter term.

image

Sustained consumer spending is particularly important given that the U.S. really cannot afford a recession given these next two items:

U.S. Tax Revenues Fall, Deficit Widens in Wake of New Tax Law Federal tax revenue declined 0.4% in 2018, the first full calendar year under the new tax law, despite robust economic growth and the lowest unemployment rate in nearly five decades.

The Treasury Department said Wednesday federal revenue totaled $3.33 trillion last year, while federal spending totaled $4.2 trillion, a 4.4% increase from the previous year.

That pushed the U.S. budget gap up to $873 billion for the 12 months that ended in December, compared with $680.8 billion during the same period a year earlier—a 28.2% increase. Last year was the highest deficit for a calendar year since 2012. (…)

In 2018, however, rising interest rates and a bigger debt load pushed up the government’s interest costs, and a bipartisan budget deal led to a sharp increase in military spending. At the same time, the lower tax rates kicked in, constraining receipts for much of the year. (…)

The U.S. is on track to record a $900 billion deficit this year, CBO said, and annual deficits are expected to top $1 trillion starting in 2022.

Tax receipts are flat so far this fiscal year, due in part to a decline in corporate income tax collection, while federal outlays have increased 10%, Treasury said. The government ran a $319 billion deficit in the first three months of the fiscal year, which began Oct. 1, compared to a $225 billion deficit in the same period a year earlier.

Declining corporate tax receipts have been partially offset by a surge in tariff revenue, after the White House began imposing levies last year on imported goods, such as steel, solar panels, cars, washing machines and lumber. Treasury said Wednesday that customs duties nearly doubled in the first three months of the fiscal year, totaling $17.8 billion, compared with $9.4 billion in the same period a year earlier.

As a share of gross domestic product, the deficit totaled 4.2% in December, Treasury said.

By comparison, the last time the jobless rate was below 4%, in 2000, the U.S. ran a budget surplus of 2.3% of GDP for the year. (…)

U.S. National Debt Soars to a Record $22 Trillion

U.S.'s national debt tops record $22 trillion

Speaking of debt, this during a booming job market (via The Daily Shot):

Auto-Loan Delinquencies Are the Highest Since 2012

The number of loans at least 90 days late exceeded 7 million at the end of last year, the highest total in the two decades the Federal Reserve Bank of New York has kept track. Expressed as a percentage of total debt, the delinquency rate is the highest since 2012, as overall borrowing has also increased. (…)

  • Can sub-prime auto loans bring down financial system?

U.S auto loans have surged by half a trillion dollars in the last six years to reach a record US$1.27 trillion at the end of 2018. Part of this increase came courtesy of “sub-prime” loans, i.e. those made to borrowers with low credit ratings, and hence nobody should be surprised that delinquency rates are now rising ─ at the end of last year, 2.4% of new auto loans were 90 or more days delinquent, the highest share since 2010. Should investors be concerned?

It’s worth noting that the sub-prime share of auto loans has stabilized, which suggests the delinquency rate may not be far from peaking. More importantly, sub-prime auto debt,
at US$285 billion, represents just 2% of household debt outstanding. This is small in comparison to the onset of the last financial crisis when sub-prime mortgages topped US$1 trillion and represented about 10% of household debt. Also encouraging is the fact that bank exposure to the auto sub-prime problem looks manageable. As today’s Hot Charts show, banks hold US$474 billion of outstanding auto loans of which just 23% (or US$109 billion) is sub-prime. In other words, rising auto delinquencies on their own are unlikely to lead to a credit crunch and recession à la 2008/2009. (NBF)

China’s 9% Surge in Exports Surprises Economists January’s rise reverses a 4.4% decline in December and beat the expectations of many economists, who had forecast another decrease. The better-than-expected performance, economists said, likely came in part from exporters hurrying out orders ahead of February’s Lunar New Year holiday and before the cease-fire in the U.S.-China trade war expires on March 1.

Imports, however, dropped for a second consecutive month, though the 1.5% decline last month compared with January a year ago is less steep than December’s 7.6% drop and smaller than many economists projected.

January’s better-than-expected performance, economists said, likely came in part from exporters hurrying out orders ahead of February’s Lunar New Year holiday and before the cease-fire in the U.S.-China trade war expires on March 1. (…)

“The U.S. won’t probably be comfortable with today’s bilateral data,” Mr. Ding said. In particular, he pointed to a 41.2% on-year drop in Chinese imports from U.S.

China’s exports to the U.S. fell 2.4% from a year earlier in January, compared with a 3.5% decline in December, the customs data showed. (…)

 image image
Japanese Economy Scores Rebound Japan’s GDP grows an annualized 1.4% in the October-December period

The world’s third-largest economy after the U.S. and China expanded at an annualized pace of 1.4% in the October-December period following a 2.6% contraction in the previous quarter, roughly in line with economists’ forecasts. (…)

Private consumption, which accounts for nearly 60% of gross domestic product, increased 0.6% on quarter in the fourth quarter, while capital expenditures rose 2.4% as companies shook off the effects of natural disasters. The economy shrank in the previous quarter partly due to a typhoon that closed a major airport and an earthquake that left the northern island of Hokkaido without electricity for two days. (…)

Exports, an engine of the Japanese economy, subtracted 0.3 percentage point from growth in the October-December quarter, showing the impact of the U.S.-China trade conflict and the overall slowdown in the Chinese economy. (…)

Trump Considers 60-Day Extension for China Tariff Deadline

“I think it’s going along very well,” Trump told reporters in the Oval Office on Wednesday. “They’re showing us tremendous respect.” (…)

Strikes at Low-Wage Plants Signal Revival of Labor Demands in Mexico A wave of strikes at low-wage plants in a border city threatens to spark more labor strife as Mexico looks to overhaul laws following a new trade deal with the U.S. and Canada.
EARNINGS WATCH

We now have 357 reports in. The beat rate is steady at 71% and the surprise factor is also steady at +3.6%. Blended earnings are seen up 16.6% (13.7% ex-Energy). Q1’19: –0.3% (+0.3% ex-E).

Trailing EPS are $162.83. With core CPI at +2.2%, the Rule of 20 P/E is now 19.1, only 5% below fair value of 2900 which was the previous peak reached last fall.

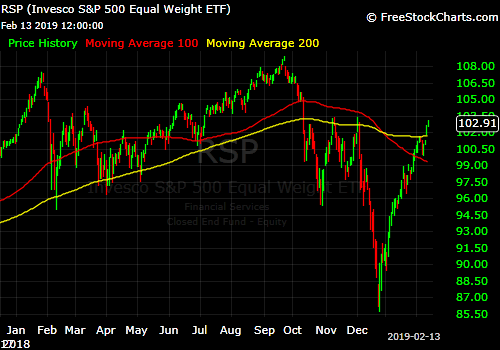
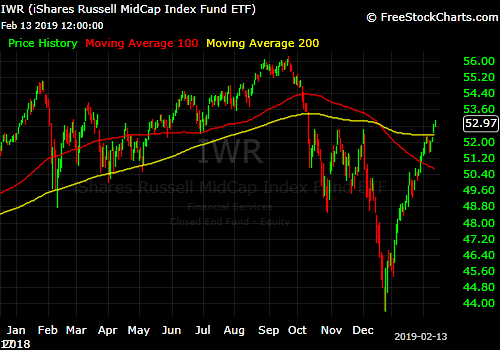
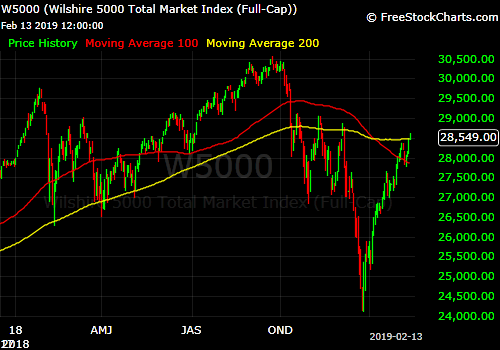
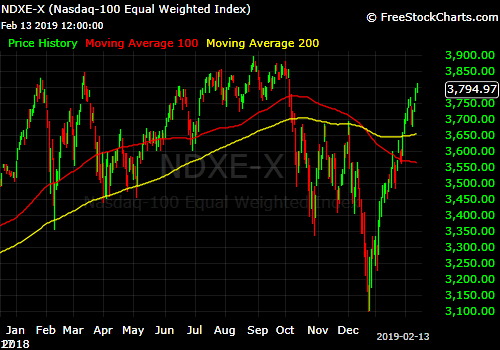
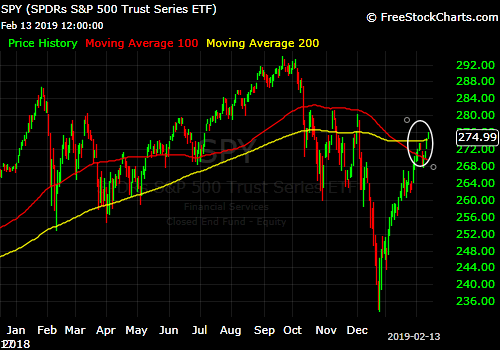
MOVING AVERAGES MOVING
  • The S&P 500 has gone through its now rising 200dma.
spy

  • Broadly.

rsp

iwr

w5000

  • But not full broadly.

iwm

  • Nasdaq the same.

ndxx

  • Also broadly.

ndxe

THE DAILY EDGE: 13 FEBRUARY 2019: Earnings Recession?

Job Openings Push Further into Record Territory at End of 2018 Number of available jobs exceeds unemployed Americans by 1 million at end of 2018, according to the Labor Department

(…) Before March 2018, job openings had never exceeded unemployed workers in 18 years of monthly records. (…)

However one looks at U.S. employment, one can only say it is remarkably strong. Demand for workers has exploded in 2018. Job openings are up 29.4% YoY in December. Private-sector openings increased were up by nearly one-third YoY.

image

What if the trade war threats dissipate, consumers keep consuming and corporate America finally decides to pay up for workers? Jay Powell may have to address this possibility. Is there a Powell put on the bond market?

(…) In previous expansions, inflation was the spoiler. Central banks had to slam on the brakes to slow growth to restrain inflationary pressures in an economy expanding faster than its potential.

So while tipping the economy into recession was never the goal — except, perhaps, when Paul Volcker realized that the only way to whip inflation now was to send the economy into a hard reverse — it was almost always the result, given the long and variable lags with which monetary policy operates. (…)

So what could go wrong to upset the apple cart, upend the best laid plans of the Fed for a soft landing and send the expansion — which would turn 10 years old in June and become the longest on record in July — into reverse? (…)

Inflation could rear its ugly head, forcing the Fed to tighten more aggressively. This seems unlikely, given that there have been no early-warning signs of demand-driven price increases from industrial commodity prices at a time when growth in China, Japan and Europe is slowing. (…)

It’s not clear that a trade war by itself would stymie U.S. economic growth. Exports constitute a relatively small share of GDP: 12.3% in the third quarter of 2018. That’s down from an all-time high of 13.7% in 2014. So foreign trade matters; it just isn’t the driver of U.S. economic growth. That honor belongs to consumer spending, which has accounted for more than two-thirds of GDP since 2001. (…)

My guess is the main impetus for a contraction in GDP growth would come from financial markets. Specifically, if another stock-market meltdown SPX, +1.29%   or an international crisis, triggered by, let’s say, a messy divorce between the U.K. and European Union in March, sends investors running to the safety and security of U.S. Treasuries, the yield curve could invert in what traders call a “bullish flattener,” with long-term rates TMUBMUSD10Y, -0.10%  declining independently of any action on the part of the Fed. (…)

So it would not take much in the way of bad news to put the Fed in a position where it has to lower rates, not so much to address the crisis but to offset the reaction to it: a flight-to-quality into Treasuries that inverts the term structure and creates a disincentive to the lending and credit creation that drive economic growth.

Unless the Fed responds aggressively to such an inversion — and I’m not convinced policy makers will seize the day — it almost guarantees that Soft Landing 2.0 will remain a mere footnote in economic history, a case of what might have been, not a model for central banks to emulate in the future.

Hmmm…Given the strength in employment, I would not so easily dismiss the possibility of an inflation scare that would force the Fed to return to its hiking strategy. There are more and more examples of strengthening pricing power in the U.S.. If corporations realize they can boost prices, they will also be more open to boost wages and yaddi, yaddi, yadda…

Here’s an interesting chart from Pantheon Macroeconomics via The Daily Shot:

Trump Says U.S. May Delay China Trade Deal Deadline

(…) “If we’re close to a deal where we think we can make a real deal, I could see myself letting them slide for a little while,” Mr. Trump said during remarks at the Oval Office. (…) “At some point, I expect to meet with Xi and make the parts of the deal that the group is unable to make,” Mr. Trump said. (…)

“I’m happy either way,” he said. “I could live receiving billions and billions of dollars a month from China. China never gave us 10 cents. Now they are paying billions a month for the privilege of coming into the U.S. and honestly taking advantage.”

Pointing up While the United States is collecting billions in tariffs, that money is not coming directly from China but from companies and customers who buy imported goods.

…and eventually pass them on or accept lower profit margins.

(…) “Xi is scheduled to meet both Lighthizer and Mnuchin on Friday,” one source briefed on the arrangements told the South China Morning Post.

A second source said Xi was expected to meet the US delegation in Beijing this week, although the specific time had not been confirmed.

In addition, a banquet would be hosted for the US delegation in “a Chinese cuisine restaurant” in downtown Beijing later this week, with Chinese Vice-Premier Liu He expected to toast the US delegates, the first source added. (…)

Stephen S. Roach: Warnings from the global trade cycle

(…) There is a distinct possibility that a turn in an already weakened trade cycle could spark a surprisingly swift deterioration in the global economy. (…) China is the world’s largest exporter and second-largest importer. Its negative impact on an already weakened global trade cycle is only just starting to become apparent. (…) The eurozone, as a whole, ranks right behind China among global exporters and slightly above China as the world’s second largest importer. With exports to the United Kingdom accounting for about 3% of the European Union’s GDP – considerably higher for Belgium, Ireland, and the Netherlands – Brexit-induced frictions to global trade can hardly be taken lightly.

All in all, the global trade cycle is facing major stress in 2019, and markdowns have only just begun. This underscores the risks of a major shortfall in world GDP growth. In a still tightly connected world, no major economy will be an oasis. That includes the US, whose 45th president continues to insist that it’s easy to win a trade war. Maybe not. (HT Brave Chicken)

Trump shows signs of support for border funding deal US president moves towards plan after earlier saying he was not ‘happy’ or ‘thrilled’
RECESSION WATCH

What friends are for? Fred, an old friend of mine sent me a link to a pdf by Larry Williams (ireallytrade.com). It made me work a fair bit to verify and build my own spreadsheets and charts. The goal is to sell equities before recessions happen.

  • The Conference Board Employment Trend Index and its 5-month moving average. I could not replicate exactly Williams’ chart which uses a 20-day m.a. with monthly data (!). Instead, I have used a 5-month m.a.. The down arrows point when the ETI declined below its 5m m.a. for 3 consecutive months (my own rule to eliminate too may false signals otherwise). There are still too many false signals but some warnings were good (in 1981, in 1989-90, in 2000 and 2006-07). We currently have one down month under the belt.

image

image

  • The Unemployment Rate and its 12m m.a.. The down arrows are when the UR rises above its 12m m.a.. Some false signals as well but a decent warning tool nonetheless. Note that Williams’ pdf charts omit to indicate some false signals. Note also the down arrow this January. Maybe it is best when the m.a. is also turning up…

image

image

Williams rightly observes that “as with all economic indicators, the sell signals are better than the buy signals.”

THE EARNINGS RECESSION

The earnings recession has started. At the end of Sept, the consensus was +6.7% for YoY EPS. By end-2018, that estimate was down to +3.3%. And now -0.8%, with six of the eleven sectors in negative terrain. (David Rosenberg)

The new bear buzz as people are discovering that Q1’19 estimates show negative YoY growth (but not subsequent quarters, yet). The last time we went through an earnings recession was between Q3’15 and Q2’16 when the S&P 500 Index declined some 8% in seven months as WTI prices plummeted from $105 to $30. The Rule of 20 P/E was where it is now but inflation rose from 1.8% to 2.3% while trailing EPS declined 11% from $110 to $98, dragging the Rule of 20 Fair Value (yellow line) 6.5% lower during the interval.image

  • Don’t listen to the market cheerleaders: Today’s dour outlook is poised to get worse (David Rosenberg)

(…) On Dec. 31, the analyst community was calling for $40.21 EPS for the first quarter and now that is down to $37.95. A 5.6-per-cent downward revision in six-weeks time doesn’t happen every day, I assure you. The rose-coloured crowd says “oh, don’t worry – this is a repeat of 2016.” The “only” difference, which they don’t tell you, is that this is not just an energy story – six of the 11 S&P 500 sectors are in profit contraction, with tech leading the pack down at minus 10 per cent at the moment. This is a much broader story and a macro backdrop fraught with much more risk than was the case back then.

Interestingly, second-quarter EPS growth estimates have also been shaved and we are just getting going here – now at plus 1.2 per cent year-over-year for the coming quarter. Looking at the guidance, one can reasonably assume that it won’t be long before this consensus forecast also swings negative, which will mark the first “earnings recession” since the first half of 2016. (…)

But last time, the jobless rate was a full point higher, the output gap still wasn’t closed, the yield curve was much steeper and the Fed had only raised rates once – not nine times along with the balance-sheet unwind. Totally different backdrop. And now the European Central Bank is done with its quantitative easing program whereas it stepped in to fill the Fed’s void three years back. Brexit has turned from a vote to a disruptive reality. Italy has replaced Greece as the EU’s fiscal basket case – it truly is too big to fail and too big to rescue. The tax-cut and deregulation wave is behind us. And even if we can avert a trade war with China, these complex battles among economic, cyber and technology lines are going to be with us for a very long time. China knows how to play the long game better than anybody else – the benefits of a central command political system.

Be careful what you wish for.

I recently warned about the growing discrepancy in earnings data among the various aggregators, allowing data picking to suit narratives. We’re right in there with Q1’19 estimates.

Factset’s numbers show Q1 EPS for the S&P 500 Index of $37.95, down 2.0% YoY and full year 2019 EPS of $169.76, up 5.1% from the 2018 estimate of $161.47.

Refinitiv has Q1’19 EPS at $37.98, close to Facset’s, but because their Q1’18 number is lower, the decline this year is only 0.2%. Refinitiv’s 2019 number is $169.02, up 4.2% from its 2018 figure of $162.07. This latter number will surely prove too low given that trailing EPS are currently $162.85 per Refinitiv.

Capital IQ adds to the confusion with its Q1’19 number of $38.16, up 4.4% from its low Q1’18 number of $36.54 and a full year number of $167.65, up 7.8%.

In 2015, when the collapse in oil prices caused another big discrepancy in aggregators’ data, I decided to consistently use Thomson Reuters’ data (now Refinitiv/IBES). It is also conveniently providing a daily railing EPS number.

For now, full year 2019 forecasts call for 4.2% earnings growth, down from 7.3% Jan. 1 and 10.2% on October 1, 2018. Energy and Materials account for most of the drop while Apple seems the main culprit on Technology. Excluding the two commodity sensitive sectors, growth is expected at 5.3% in 2019.

image

The market will indeed need to cope with generally poor Q1 profits but positive earnings surprises could embellish the quarter and make it acceptable if economic and political conditions become supportive.

image

So far in Q4’19, with 345 companies having reported, the beat rate is steady at 71% and the surprise factor is an encouraging +3.6%. Q4 growth is now expected to reach 16.5% (the 345 companies having reported aggregate a 17.7% growth rate), which would be about 10% excluding the tax reform, a pretty respectable number given the circumstances. Revenue growth is expected at 6.0% in Q4 (6.9% for the 345 reports in), indicating further gains in pretax margins.

During the last 2 days, we got 5 positive guidance and 8 negative ones, an improvement over the pos/neg ratio seen so far in Q4. Here’s the trend in guidance (3-month average) courtesy of James Bianco, President at Bianco Research LLC:

No alt text provided for this image

The Rule of 20 P/E is now 19.1, up from 16.4 at the December trough. Fair Value (R20 P/E at 20) is 2900.

The Current State of AI Adoption

(…) To get a better sense of the current state of AI adoption, McKinsey recently conducted a global online survey on the topic, garnering responses from over 2,000 participants across 10 industry sectors, eight business functions and a wide range of regions and company sizes. The survey asked about their progress in deploying nine major AI capabilities, including machine learning, computer vision, natural language text and speech processing, and robotic process automation.

(…) Thirty percent of organizations are conducting AI pilots. Nearly half, 47%, have embedded at least one AI capability in their standard business processes, compared to 20% in 2017. AI opportunities can be found across the firm, but only 21% report using AI across multiple business functions. AI investments are still quite small. Fifty-eight percent of respondents said that less that one-tenth of their digital budgets goes toward AI, while 71% expect that AI investments will increase significantly in the coming years.

Many respondents said that their organizations lack the necessary skills and practices to create value from AI at scale, including identifying key strategic opportunities and obtaining the data required by AI applications. Most felt that AI will have a relatively minor impact on their overall future employment, despite the fact that AI will likely automate a significant fraction of existing work,

While still in its early days, AI is already delivering meaningful value for those who’ve embraced the technology. Seventy-eight percent report receiving significant or moderate value, while only 1% say that they’ve seen none or negative value. Across business functions, value was highest in manufacturing and risk management, where 80% report receiving significant or moderate value, followed by supply chain management and product and service development at 76%. (…)

Here’s an interesting video about AI and its future impact on our lives:
https://a16z.com/2019/02/08/better-together-humanity-machine-learning-chen-summit/