U.S. CPI Holds Steady as Energy Prices Decline; Core Prices Increase Steadily
The Consumer Price Index remained unchanged during January for the third consecutive month. (…) The 1.6% y/y increase was the weakest since September 2016. The CPI excluding food & energy increased an expected 0.2% (2.2% y/y) for the eighth month in the last nine. (…)
The rise in the “core” CPI reflected a fourth consecutive 0.2% increase in services prices. The 2.8% y/y rise moderated, however, from its 3.1% peak this past June. Medical care service price inflation eased to 0.3% from two months at 0.4%, and the y/y rise moderated to 2.4%. The cost of shelter increased a steady 0.3% (3.2% y/y) as the owners’ equivalent rent of primary residences rose 0.3%, and by a lessened 3.2% y/y. Primary shelter rents increased an improved 0.3% (3.4% y/y). (…)
Goods prices excluding food & energy rose 0.4% following December’s stability. The 0.3% y/y gain was the strongest since 2009 and compared to price deflation from 2013 until September 2018. The latest rise was dominated by a 1.4% strengthening (6.4% y/y) in household appliance prices which followed a 0.2% decline. Apparel prices also exhibited strength with a 1.1% rise (0.1% y/y) after holding steady in December. Household furnishings costs gained 0.4% (1.2% y/y) following two months of little change. (…) New vehicle prices rose 0.2% and were unchanged y/y. Medical care goods prices inched 0.1% higher (-0.3% y/y) following a 0.4% decline.
Food prices rose 0.2% (1.6% y/y) last month as meat prices strengthened 0.9% (0.1% y/y). (…)


Looking at the last 6, core CPI is up at a 2.2% annualized rate but the last 3 months a.r. is 2.6%. In fact, it looks like everything is rising at 0.2% or 0.3% MoM. Beware FOMC!

- The Atlanta Fed’s sticky-price consumer price index (CPI)—a weighted basket of items that change price relatively slowly—rose 2.6 percent (on an annualized basis) in January, following a 2.6 percent increase in December. On a year-over-year basis, the series is up 2.4 percent.

Wages are accelerating against decelerating inflation. Good for consumer spending.
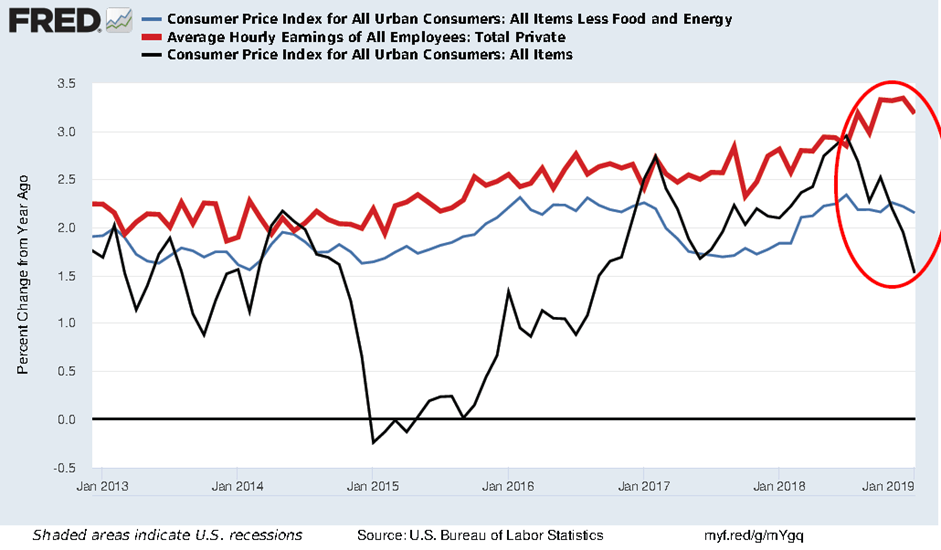
Here’s the real earnings of private employees using core CPI. At 1.0% YoY, nothing to spur a spending boom but better than the 2007-08 trend. Against total CPI, however, real wages are up 1.7% YoY. This should help sustain real spending over the shorter term.

Sustained consumer spending is particularly important given that the U.S. really cannot afford a recession given these next two items:
U.S. Tax Revenues Fall, Deficit Widens in Wake of New Tax Law Federal tax revenue declined 0.4% in 2018, the first full calendar year under the new tax law, despite robust economic growth and the lowest unemployment rate in nearly five decades.
The Treasury Department said Wednesday federal revenue totaled $3.33 trillion last year, while federal spending totaled $4.2 trillion, a 4.4% increase from the previous year.
That pushed the U.S. budget gap up to $873 billion for the 12 months that ended in December, compared with $680.8 billion during the same period a year earlier—a 28.2% increase. Last year was the highest deficit for a calendar year since 2012. (…)
In 2018, however, rising interest rates and a bigger debt load pushed up the government’s interest costs, and a bipartisan budget deal led to a sharp increase in military spending. At the same time, the lower tax rates kicked in, constraining receipts for much of the year. (…)
The U.S. is on track to record a $900 billion deficit this year, CBO said, and annual deficits are expected to top $1 trillion starting in 2022.
Tax receipts are flat so far this fiscal year, due in part to a decline in corporate income tax collection, while federal outlays have increased 10%, Treasury said. The government ran a $319 billion deficit in the first three months of the fiscal year, which began Oct. 1, compared to a $225 billion deficit in the same period a year earlier.
Declining corporate tax receipts have been partially offset by a surge in tariff revenue, after the White House began imposing levies last year on imported goods, such as steel, solar panels, cars, washing machines and lumber. Treasury said Wednesday that customs duties nearly doubled in the first three months of the fiscal year, totaling $17.8 billion, compared with $9.4 billion in the same period a year earlier.
As a share of gross domestic product, the deficit totaled 4.2% in December, Treasury said.
By comparison, the last time the jobless rate was below 4%, in 2000, the U.S. ran a budget surplus of 2.3% of GDP for the year. (…)
U.S. National Debt Soars to a Record $22 Trillion

Speaking of debt, this during a booming job market (via The Daily Shot):
Auto-Loan Delinquencies Are the Highest Since 2012
The number of loans at least 90 days late exceeded 7 million at the end of last year, the highest total in the two decades the Federal Reserve Bank of New York has kept track. Expressed as a percentage of total debt, the delinquency rate is the highest since 2012, as overall borrowing has also increased. (…)

-
Can sub-prime auto loans bring down financial system?
U.S auto loans have surged by half a trillion dollars in the last six years to reach a record US$1.27 trillion at the end of 2018. Part of this increase came courtesy of “sub-prime” loans, i.e. those made to borrowers with low credit ratings, and hence nobody should be surprised that delinquency rates are now rising ─ at the end of last year, 2.4% of new auto loans were 90 or more days delinquent, the highest share since 2010. Should investors be concerned?
It’s worth noting that the sub-prime share of auto loans has stabilized, which suggests the delinquency rate may not be far from peaking. More importantly, sub-prime auto debt,
at US$285 billion, represents just 2% of household debt outstanding. This is small in comparison to the onset of the last financial crisis when sub-prime mortgages topped US$1 trillion and represented about 10% of household debt. Also encouraging is the fact that bank exposure to the auto sub-prime problem looks manageable. As today’s Hot Charts show, banks hold US$474 billion of outstanding auto loans of which just 23% (or US$109 billion) is sub-prime. In other words, rising auto delinquencies on their own are unlikely to lead to a credit crunch and recession à la 2008/2009. (NBF)
China’s 9% Surge in Exports Surprises Economists January’s rise reverses a 4.4% decline in December and beat the expectations of many economists, who had forecast another decrease. The better-than-expected performance, economists said, likely came in part from exporters hurrying out orders ahead of February’s Lunar New Year holiday and before the cease-fire in the U.S.-China trade war expires on March 1.
Imports, however, dropped for a second consecutive month, though the 1.5% decline last month compared with January a year ago is less steep than December’s 7.6% drop and smaller than many economists projected.
January’s better-than-expected performance, economists said, likely came in part from exporters hurrying out orders ahead of February’s Lunar New Year holiday and before the cease-fire in the U.S.-China trade war expires on March 1. (…)
“The U.S. won’t probably be comfortable with today’s bilateral data,” Mr. Ding said. In particular, he pointed to a 41.2% on-year drop in Chinese imports from U.S.
China’s exports to the U.S. fell 2.4% from a year earlier in January, compared with a 3.5% decline in December, the customs data showed. (…)


Japanese Economy Scores Rebound Japan’s GDP grows an annualized 1.4% in the October-December period
The world’s third-largest economy after the U.S. and China expanded at an annualized pace of 1.4% in the October-December period following a 2.6% contraction in the previous quarter, roughly in line with economists’ forecasts. (…)
Private consumption, which accounts for nearly 60% of gross domestic product, increased 0.6% on quarter in the fourth quarter, while capital expenditures rose 2.4% as companies shook off the effects of natural disasters. The economy shrank in the previous quarter partly due to a typhoon that closed a major airport and an earthquake that left the northern island of Hokkaido without electricity for two days. (…)
Exports, an engine of the Japanese economy, subtracted 0.3 percentage point from growth in the October-December quarter, showing the impact of the U.S.-China trade conflict and the overall slowdown in the Chinese economy. (…)
Trump Considers 60-Day Extension for China Tariff Deadline
“I think it’s going along very well,” Trump told reporters in the Oval Office on Wednesday. “They’re showing us tremendous respect.” (…)
Strikes at Low-Wage Plants Signal Revival of Labor Demands in Mexico A wave of strikes at low-wage plants in a border city threatens to spark more labor strife as Mexico looks to overhaul laws following a new trade deal with the U.S. and Canada.
EARNINGS WATCH
We now have 357 reports in. The beat rate is steady at 71% and the surprise factor is also steady at +3.6%. Blended earnings are seen up 16.6% (13.7% ex-Energy). Q1’19: –0.3% (+0.3% ex-E).
Trailing EPS are $162.83. With core CPI at +2.2%, the Rule of 20 P/E is now 19.1, only 5% below fair value of 2900 which was the previous peak reached last fall.
MOVING AVERAGES MOVING
- The S&P 500 has gone through its now rising 200dma.
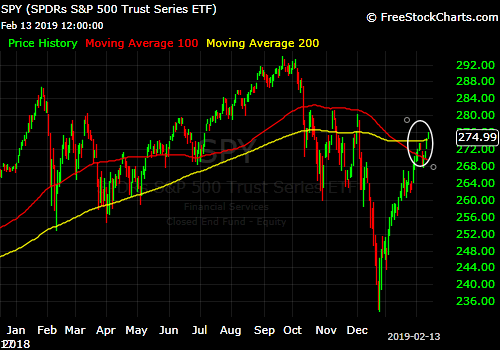
- Broadly.
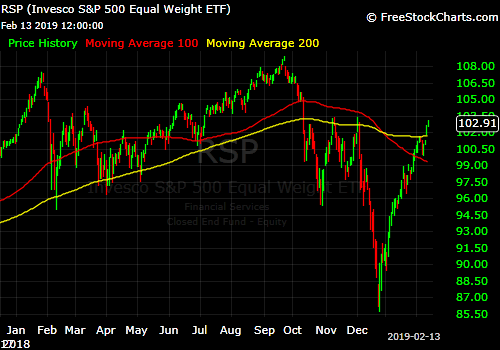
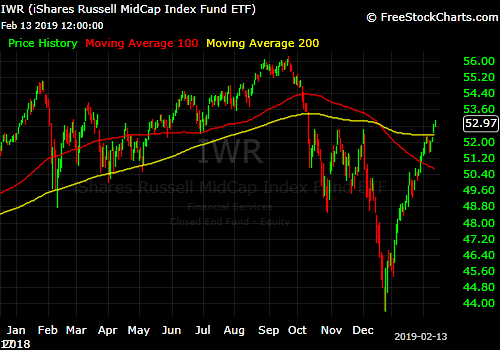
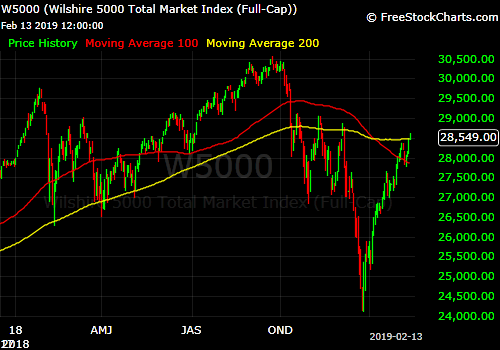
- But not full broadly.

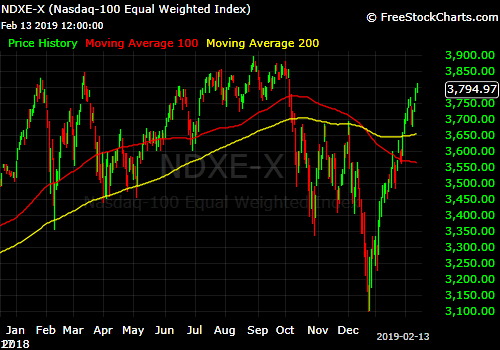
- Nasdaq the same.

- Also broadly.