The enemy of knowledge is not ignorance, it’s the illusion of knowledge (Stephen Hawking)

It ain’t what you don’t know that gets you into trouble. It’s what you know for sure that just ain’t so (Mark Twain)

Invest with smart knowledge and objective odds

THE DAILY EDGE (6 August 2018): Cracks!

Slower July Hiring Masks Strength in U.S. Labor Market Nonfarm payrolls rose a seasonally adjusted 157,000 as unemployment falls to 3.9%

(…) In Friday’s report, revised figures showed employers added 59,000 more jobs than previously reported the prior two months, pushing the three-month average for job gains to a healthy 224,000.

(…) through the first seven months of the year, employers added an average of 215,000 a jobs a month, an acceleration from last year’s average through July of 184,000 a month.

As employers competed for workers, wages rose 2.7% for all workers in July from a year earlier, matching the rate for nonmanagers. That is lower than the roughly 4% annual pace for hourly wage gains for nonmanagers recorded in 2000, the last time the jobless rate held near a similarly low level.

But such wages have advanced at a 2.7% rate or better for the third straight month, the most solid stretch of gains in nine years. And that gain came even though the reference week for the Labor Department’s establishment survey didn’t include the 15th of the month, when many Americans are paid, which tends to subdue wage numbers. (…)

In July, the share of American adults who had jobs or were looking for one held at 62.9% after a June increase as more than 100,000 workers entered the labor force. The rate is up slightly from a recent low of 62.3% in 2015, but still near the smallest share of adults participating since the late 1970s, a time when women were still just entering the workforce in greater numbers. (…)

The share of U.S. adults with a job rose to 60.5% last month, the highest rate since January 2009.

(…) the unemployment rate for workers 25 years and older with less than a high-school diploma hit 5.1% last month, the lowest rate for data tracing back to 1992. (…)

The broadest measure of unemployment, including those too discouraged to look for work, plus Americans stuck in part-time jobs who want to work full time, fell to 7.5% from 7.8% the prior month. But that rate, known as the U-6, remains somewhat elevated compared with the last time unemployment was similarly low. In December 2000, the broader measure was 6.9%. (…)

GMM Nonstick Coatings, a 350-employee supplier of coatings for cookware companies like Calphalon, has added about 25 workers this year. Ravin Gandhi, chief executive of the supplier, said the company is competing for highly educated workers, many in research and development.

So it raised wages about 5% to 6% in the first half of 2018 compared with the same period a year earlier, up from 1%-to-2% pay raises the company was offering a few years ago.

“You’ve got to really roll the red carpet out and go after people,” Mr. Gandhi said. (…)

U.S. Service sector business activity growth remains sharp, but prices charged rise at fastest rate in almost four years

The seasonally adjusted final IHS Markit U.S. Services Business Activity Index registered 56.0 in July, down from 56.5 in June. The rise in output was steep overall, despite softening to the weakest since April. Where an increase in business activity was reported, panellists linked this to favourable demand conditions and more robust client demand. Although the rate of growth eased from recent peaks, it remained one of the fastest in the last three years.

image

New business also grew sharply in July, albeit at a slightly softer rate. The pace of increase eased for the third successive month to the slowest since January, but remained well above the trend seen in 2017. Respondents suggested robust client demand and the release of new business lines drove the expansion.

On the price front, input cost inflation softened to a three-month low in July. The rate of increase was, however, sharp and well above the series trend. Panellists suggested that higher prices for fuel, steel and electronics were particularly notable. Others also cited greater wage and transportation bills as driving the rise in cost burdens.

Meanwhile, robust demand conditions led to a steep rise in average charges. The rate of inflation accelerated to the quickest since September 2014 as firms partly passed on higher costs to clients.

In line with a slightly weaker rise in output, capacity was placed under less strain. Employment growth eased to a five-month low, with the rise in staffing numbers tempered by difficulties finding suitable candidates for vacancies. Although only fractional, the contraction in outstanding business was the first since April 2017 and signalled a turnaround from the moderate expansion seen in June.

Business confidence eased to a six-month low and was subdued in the context of the series history, with some service providers raising concerns surrounding tariffs and their effects on client demand.

At 55.7 in July, the final seasonally adjusted IHS Markit U.S. Composite PMI™ Output Index dipped slightly from 56.2 in June. Despite the rate of expansion easing to a three-month low, it remained strong in the context of the series history.

image

China Threatens Retaliatory Tariffs on $60 Billion of U.S. Products China said it would slap levies on $60 billion of U.S. goods if Washington moves ahead with tariff threats against Beijing. Its central bank also moved to stabilize the yuan.

(…) The planned levies, on imports ranging from farm products and machinery to chemicals, range from 5% to 25%.

The planned Chinese penalties come on top of the tariffs on $50 billion in American goods on which Beijing already has imposed or said it would impose, bringing the total amount of U.S. products potentially subject to Chinese tariffs to $110 billion—or 85% of U.S. goods entering China last year, according to U.S. statistics. (…)

“China reserves the right to continue to introduce other countermeasures,” it said in the Friday statement. (…)

“Talks have stalled but in recent days I can report that there has been some communication for the first time in a good while…at the highest levels,” National Economic Council Director Laurence Kudlow told reporters Friday.

U.S. Treasury Secretary Steven Mnuchin and President Xi’s economic envoy, Liu He, and their teams, have been in conversations about a possible meeting, but the talks remain at a preliminary stage. Mr. Kudlow didn’t say if he was referring to those talks, or if other administration officials had also been in touch with their Chinese counterparts in recent days. (…)

Trump Says U.S. Now Has the Upper Hand on China in Tariff Battle

(…) China is prepared for a “protracted war” and doesn’t fear sacrificing short-term economic interests, according to an editorial in the nationalist Global Times on Sunday evening. “Considering the unreasonable U.S. demands, a trade war is an act that aims to crush China’s economic sovereignty, trying to force China to be a U.S. economic vassal.” (…)

Canada’s Freeland Upbeat on Nafta Talks, Wants Quick Conclusion
U.S. Trade Gap Widened in June Deficit grew at the fastest rate since November 2016

(…) The trade deficit in goods and services increased 7.3% in June from the previous month to a seasonally adjusted $46.35 billion, the Commerce Department said Friday. Exports fell 0.7% from May, while imports into the U.S. increased 0.6% on the month. (…)

Soybean exports remained strong in June. But as China, the world’s biggest consumer of the oilseed, shifts its purchases to Brazil and other countries amid the trade dispute with the U.S., economists say the trend could reverse as soon as July. (…)

Given the strength in the U.S. economy, the trade gap is likely to get worse as the year goes on (TRUMPISM: Déjà-vu!).

In Canada’s Grocery Carts, a Boycott U.S.A. Movement Starts Rolling Canadians irked by U.S. metals tariffs and President Trump’s harsh words for their prime minister are boycotting American products and buying Canadian goods.

(…) The country is the U.S.’s top export market, taking a little more than 18% of all U.S. goods that are sold abroad. Sylvain Charlebois, a professor in food distribution and policy at Dalhousie University in Nova Scotia, estimates roughly 40% to 60% of food on Canada’s grocery shelves is from the U.S. (…)

China’s Softer Stance on Defaults Spurs Asian Bond Market Beijing’s easing policy for deleveraging and defaults has helped fuel a mini-revival across Asia’s credit markets, pushing up bond prices in recent weeks and sparking debt issuance.

(…) Market sentiment improved after China took steps to boost the economy, and eased efforts to slow debt growth. Among other things, Beijing injected liquidity into the banking system, encouraged local governments to tap the bond market and promised to boost domestic consumption and support businesses. It also pledged to ensure economic stability during a trade fight with the U.S.

“China’s fine-tuning of its deleveraging campaign has removed the risk of excessive tightening,” said Omar Slim, a Singapore-based fixed-income portfolio manager with PineBridge Investments.

The shift by Beijing helped spark a rally across Asian financial markets. The average yield on the ICE Bank of America Merrill Lynch Asian High Yield Index, after being driven above 9% by a selloff, has fallen to about 8.5% as junk bond prices have climbed. (…)

But the problems remain…

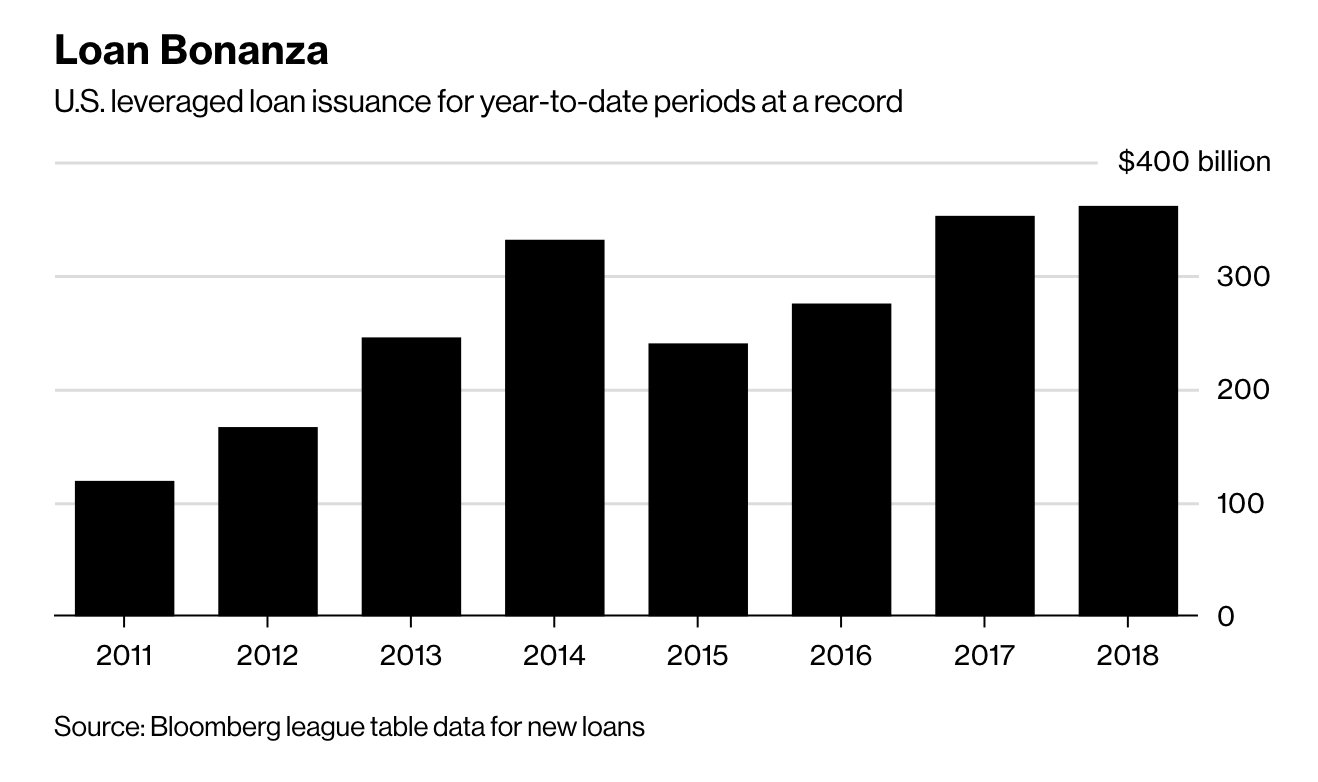
The Unseen Risk in the Booming Loan Market

In recent weeks, a growing share of new borrowers have had to lift interest rates on leveraged loans to win over investors. This might just be a touch of indigestion after several large deals to fund private-equity buyouts and takeovers, but some bankers think it is an early signal that liquidity is retreating from low-quality debt. (…)

Loans are popular right now because their yields adjust with interest rates, so they don’t lose money like fixed-rate bonds do during times of rising rates. The real problem lies in how investors who don’t normally buy loans will react to the end of quantitative easing, or central bank bond buying programs, which pushed them into risky loans in the first place. (…)

More recently, a string of loans have had to increase spreads by an average of 0.5 percentage points, according to data from S&P Global Market Intelligence’s LCD research service. In all, about 30% of new loans had to increase spreads during marketing in June and the first half of July—up from 12% in May. (…)

Loan pricing may have moved, but other terms remain very aggressive, by some measures more so than in 2007. Debt multiples on private-equity deals are as high as then at more than six times earnings on average, but investors complain that these earnings are often flattered by things like assumptions on cost savings. Also, the covenants that protect lenders by allowing them to act when things deteriorate have all but disappeared. They mostly still existed in 2007. (…)

Jamie Dimon Warns of 5% Treasury Yields The JPMorgan boss says investors should be prepared for a yield rise.

(…) “I think rates should be 4 percent today,” Dimon said Saturday at the Aspen Institute’s 25th Annual Summer Celebration Gala. “You better be prepared to deal with rates 5 percent or higher – it’s a higher probability than most people think.” (…)

Still, Dimon remained positive on the outlook for financial markets.

The current bull market could “actually go for 2 or 3 more years” because the economy is still doing quite well and markets usually turn right before the economy, he said. (…)

U.S. bond market takes looming Treasuries deluge in stride

EARNINGS WATCH
Profits Soar at Big U.S. Companies as Economy Advances America’s biggest companies are reporting some of the strongest earnings growth since the recession, boosted by lowered tax rates and a robust U.S. economy.

(…) About 80% of the companies in the S&P 500 index have reported second-quarter results so far. The energy industry led the way as producers and refiners ride a rebound in the price of crude oil. Energy profits more than doubled in the quarter from a year ago. The financial and technology sectors also reported strong gains, with profits rising about 25% apiece. (…)

Nice, but get all the facts:

Factset’s weekly summary:

Overall, 81% of the companies in the S&P 500 have reported earnings to date for the second quarter. Of these companies, 80% have reported actual EPS above the mean EPS estimate, 6% have reported actual EPS equal to the mean EPS estimate, and 15% have reported actual EPS below the mean EPS estimate. The percentage of companies reporting EPS above the mean EPS estimate is above the 1-year (75%) average and above the 5-year (70%) average.

If 80% is the final percentage for the quarter, it will mark the highest percentage of S&P 500 companies reporting actual EPS above estimates for a quarter since FactSet began tracking this metric in Q3 2008.

In aggregate, companies are reporting earnings that are 4.9% above expectations. This surprise percentage is below the 1-year (+5.6%) average but above the 5-year (+4.4%) average.

In terms of revenues, 74% of companies have reported actual sales above estimated sales and 26% have reported actual sales below estimated sales. The percentage of companies reporting sales above estimates is above the 1- year average (73%) and well above the 5-year average (58%).

In aggregate, companies are reporting sales that are 1.4% above expectations. This surprise percentage is above the 1-year (+1.2%) average and above the 5-year (+0.7%) average.

The blended, year-over-year earnings growth rate for the second quarter is 24.0% today, which is above the earnings growth rate of 22.8% last week.

The blended, year-over-year sales growth rate for the second quarter is 9.8% today, which is above the sales growth rate of 9.3% last week.

image

Pointing up Thomson Reuters’ tally of Q3 pre-announcements shows a worsening trend:

image

Not only are the negatives worse than at the same time during 3Q17 and 2Q18, but just last Friday we got 8 negative pre-announcements and zero positive.

Factset has not seen much of an impact on Q3 estimates just yet…

During the month of July, analysts lowered earnings estimates for companies in the S&P 500 for the third quarter. The Q3 bottom-up EPS estimate (which is an aggregation of the median EPS estimates for all the companies in the index) dropped by 0.6% (to $40.76 from $41.00) during this period. During the past five years (20 quarters), the average decline in the bottom-up EPS estimate during the first month of a quarter has been 1.6%. During the past ten years, (40 quarters), the average decline in the bottom-up EPS estimate during the first month of a quarter has been 2.2%. During the past fifteen years, (60 quarters), the average decline in the bottom-up EPS estimate during the first month of a quarter has been 1.6%.

image

…but this needs to be closely monitored, as are the technicals below:

TECHNICALS WATCH

During the last month, many of the market leaders of 2018 such as IT, Consumer Cyclicals and small caps, faltered. Rather than moving into cash, investors appear to have rotated into Consumer Non-Cyclicals, Industrials and Financials, and from small to larger caps. As a result, most of Lowry’s Research’s breadth and supply/demand indicators remained strong “suggesting the bull market is still being supported by expanding Demand and contracting Supply.” That said, the weakening trend in small caps continued and needs to be closely monitored for signs of “either improved Small Cap performance or that weakness is beginning to migrate into the Mid Caps”, the latter being a signal that the topping process is underway.

CMG Wealth’s Steve Blumenthal shares this NDR chart illustrating another secular peak in stock allocation. We are clearly late cycle:Pointing up Trailing EPS are now  $148.20 or $152.55 pro forma the tax reform for 12 months. This is up 15.6% from calendar 2017 EPS, helping mitigate the impact on valuation of accelerating inflation. But full year 2018 estimates are $162.03, up 6.2% from current pro forma trailing EPS. The bulk of the acceleration from tax reform is behind us while inflation trends remain worrisome and corporate guidance seems to be wavering, along with early cracks in some technical indicators.

Equity markets often tend to move on marginal trends. And we are entering the two worst months of the year from a seasonal viewpoint…

When you read statements like these

“Companies are coming out unapologetically with pricing increases,” said Jim Russell, portfolio manager at Bahl & Gaynor. “That is one of the more optimistic things we see for keeping [profit] margins high in 2018 and into 2019.” (WSJ)

be mindful that

  • companies are trying to offset cost push inflation in a highly competitive world
  • that accelerating inflation would eat into real wages and spending and
  • that accelerating inflation vs slowing profits are not a winning formula for investors.

image

THE DAILY EDGE (3 August 2018):

Ross Signals More Tariff Pain Ahead in China Trade Battle

Commerce Secretary Wilbur Ross signaled there’s more pain ahead unless China changes its economic system, as the Asian nation repeated it will never surrender to U.S. trade threats.

“We have to create a situation where it’s more painful for them to continue their bad practices than it is to reform,” Ross said in an interview on Fox Business Network on Thursday. The U.S. will keep turning up the pressure on China for as long as the country refuses to level the economic playing field, said Ross.

“The reason for the tariffs to begin with was to try and convince the Chinese to modify their behavior. Instead they have been retaliating. So the president now feels that it’s potentially time to put more pressure on, in order to modify their behavior,” he said. (…)

“China is fully prepared and will have to retaliate to defend the nation’s dignity and the interests of the people, defend free trade and the multilateral system, and defend the common interests of all countries,” China’s Ministry of Commerce said in a statement Thursday on its website. The “carrot-and-stick” tactic won’t work, it said. (…)

Along with its pledge to fight back, China also left the door open for a resumption of negotiations. “China has consistently advocated resolving differences through dialogue, but only on the condition that we treat each other equally and honor our words,” the ministry said.

The U.S. is open to renewing formal negotiations with China, though Beijing must agree to open its markets to more competition and stop retaliating against U.S. trade measures, according to two senior administration officials who briefed reporters Wednesday on the condition of anonymity. (…)

Ross said on Thursday that imposing U.S. tariffs on what would add up to about half of all Chinese imports, which were valued at more than $500 billion last year, won’t cause a major economic upheaval.

A 25 percent levy “on $200 billion, if it comes to pass , is $50 billion a year,” said Ross on Thursday. “$50 billion a year on a $18 trillion economy” is a fraction of a percent, he said, adding “It’s not something that’s going to be cataclysmic.” (…)

  • The RSM has a different math:

The initial costs of the first few rounds of the prolonged trade spat are coming into view. Those costs will be concentrated in a number of critical industrial ecosystems. If the tariff policy is fully implemented, the costs will likely exceed $1.3 trillion with risk of a much greater hit to the U.S. economy than many are currently anticipating, and a premature end to the business cycle.

Euro area economic growth slows at start of third quarter

The pace of euro area economic expansion eased in July, ceding most of the momentum gained in the prior survey month. At 54.3, the final IHS Markit Eurozone PMI® Composite Output Index was down from 54.9 in June and unchanged from the earlier flash estimate.

image

The slowdown was mainly centered on the service sector, where growth eased from June’s four-month high. Manufacturing production rose at a slightly faster pace that was broadly similar to that signalled for services activity.

imageNational PMI data pointed to a broad-based expansion of economic output, with growth registered in all of the countries covered by the survey. The rate of increase in Germany improved to a four-month high, whereas growth slowed in France (two-month low), Italy (two-month low), Spain (56-month low) and Ireland (four-month low).

The principal factor underlying slower output growth was a weaker expansion in new work received. New business growth was the second-slowest in over one-and-a-half years. Only Germany saw its rate of expansion improve. Alongside weaker growth of new order intakes, reduced optimism about future business performance also contributed to the generally subdued picture. Although companies continued to forecast that economic activity would (on average) be higher in one year’s time, the overall degree of positivity dipped to a 20-month low. Confidence improved slightly in Germany and France, but dipped in Italy, Spain and Ireland. (…)

July saw a modest easing in price pressures. That said, rates of inflation in output charges and input costs remained elevated and above their respective long-run averages. Input price rises were linked to rising fuel and other oil-related cost increases, which a number of companies passed on to their clients.

The final IHS Markit Eurozone PMI® Services Business Activity Index posted 54.2 in July, down from June’s four-month high of 55.2 and below the earlier flash estimate of 54.4. It was the second lowest reading during the past year-and-a-half. (…)

If the headline index continues to track at its current level, quarterly GDP growth over the third quarter as a whole would be little-changed from the softer-than expected expansion of 0.3% signalled by official Eurostat data for quarter two.

The outlook seems to be turning into a straight choice between the upturn being sustained at its current subdued pace or rising headwinds reining in growth further during the months ahead. On this front, downside risks are more prevalent, as the slower expansion in new order inflows during July was partnered by a tandem dip in business optimism to a 20-month low. Both are reflecting the uncertainty about global market conditions, especially given the ongoing rhetoric about trade wars and the potential spillover effects to the broader economy and to manufacturing in particular.

Improved domestic demand may offset some of this in the near-term, but will need to strengthen further if it is to maintain that role. The faster growth seen in Germany, if sustained, should also help in this regard, especially if it can aid in reversing the weaker expansions seen in its eurozone partners such as France, Italy and Spain during July. However, given rising signs of slowdown and the current uncertain outlook, the ECB will likely maintain its cautious approach to policy at present.”

Chinese business activity expands at slower rate in July

Business activity growth across China slowed at the start of the third quarter, according to the latest Caixin China Composite PMI™ data (which covers both manufacturing and services). This was shown by the Composite Output Index falling from 53.0 in June to 52.3 in July.

The slowdown in overall growth momentum was broad-based, with both manufacturers and service providers in China registering weaker increases in activity in the latest survey period. Notably, service sector output rose at the slowest rate for four months in July, as illustrated by the seasonally adjusted Caixin China General Services Business Activity Index falling from 53.9 in June to 52.8. Meanwhile, manufacturing production rose only modestly.

image

Growth in new orders also softened across both monitored sectors in July, most notably across the service sector. Furthermore, the latest increase in new business placed with service providers was the weakest recorded for just over two-and-a-half years and modest. According to panellists, relatively subdued market conditions had contributed to the slower rise in new orders. At the same time, new business received by manufacturers rose at the softest pace since April. Consequently, new work at the composite level increased at the slowest rate for just over a year.

Chinese services companies continued to add to their payroll numbers during July. However, in line with the trend for business activity, the rate of job creation softened since June and was only slight. Employment across China’s manufacturing sector remained on a downward trend at the start of the second half of 2018, though the rate of job shedding eased slightly from June. At the composite level, workforce numbers fell for the second month in a row, albeit marginally.

Higher staffing levels and increased efforts to clear unfinished workloads led to a further decline in outstanding business at services companies in July. Though slight, the rate of backlog depletion was the quickest recorded since the start of 2016. In contrast, capacity pressures persisted at goods producers, as highlighted by a further rise in the level of work-in-hand at manufacturing companies. Overall, outstanding business rose at the weakest rate since September 2017.

Average input costs continued to rise across both the manufacturing and service sectors in July, with the former noting the sharper rate of growth. The increase in input costs faced by goods producers remained steep, despite the rate of inflation easing since June. Meanwhile, services companies registered a strong rise in operating expenses that was generally linked to higher fuel and raw material prices, alongside greater salary costs.

As was the case for input costs, output charges rose across both monitored sectors at the start of the third quarter. That said, manufacturers raised their selling prices at the slowest pace for three months, while services companies increased their charges at the joint-weakest rate since September 2017. Overall, output prices rose at the softest pace since the start of the year.

July survey data signalled a marked deterioration in optimism among services companies, with the level of positive sentiment edging down to the joint-lowest on record. Confidence at manufacturers was meanwhile little-changed from June, remaining historically subdued. At the composite level, optimism towards the year-ahead outlook for business activity fell to the lowest level in 32 months.

Secular inflation?

From Richard Berstein, Chief Executive and Chief Investment Officer, Richard Bernstein Advisors:

We’re not wild about these types of charts, but Chart 4 compares the current cycle’s inflation with the secular period of inflation from the 60s and 70s. We are not showing this chart to suggest that inflation will follow a definitive pattern. Rather, we show it to demonstrate how benignly one of the worst inflationary periods in US history started. That might be worth considering simply because investors remain quite sanguine about inflation given the economic and policy backdrop. (http://www.rbadvisors.com/images/pdfs/Overheating_Ahead.pdf).

image

EARNINGS WATCH

380 companies in, 80% beat rate and +5.1% surprise factor. Q2 EPS now seen up 23.6%, from up 20.7% July 1 and +22.9% July 31.

Trailing EPS now $148.05 or $152.40 pro forma the tax reform for 12 months.

Thomson Reuters published its first tally of corporate pre-announcements for Q3, the first warning that the positive momentum may be ending: there are more pre-announcements and they are slightly more skewed towards the negative side than at the same time in 3Q17 and 2Q18.

image