This is the WSJ headline, featuring the ISM survey and ignoring Markit’s. Here’s the full story:
June data pointed to a relatively subdued month for the U.S. manufacturing sector, with output, new order and employment growth all slowing since May. At the same time, survey respondents signalled resilient confidence towards the year ahead outlook, with optimism up to its strongest level since February. Meanwhile, cost pressures were the weakest recorded for 15 months, which resulted in the slowest pace of factory gate price inflation since late-2016.
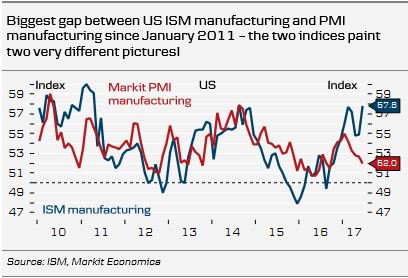
The seasonally adjusted IHS Markit final US Manufacturing Purchasing Managers’ Index™ (PMI™) registered 52.0 in June, down from 52.7 during May, to signal the least marked improvement in overall business conditions since September 2016. Slower rates of output and new business growth were the main factors weighing on the headline PMI in June, which more than offset a stronger contribution from the stocks of purchases component. (…)

Survey respondents noted that softer new business growth continued to act as a brake on production schedules.
Some firms noted that efforts to boost inventories of finished goods helped to lift output levels. The latest rise in post-production inventories was the fastest recorded since January’s survey-record high. Stocks of purchases also increased in June, with the rate of inventory accumulation the sharpest for four months.
New order books improved in June, but the latest increase was the weakest since September 2016. Reports from survey respondents cited subdued demand and renewed risk aversion among clients. Export sales increased only marginally, which manufacturers linked to intense competitive pressures and a continued growth headwind from the strong dollar.
(…) the pace of job creation eased to its lowest since March. Companies reporting a rise in payroll numbers mainly commented on efforts to boost operating capacity and hopes of an upturn in sales. Just over one-third of the survey panel (35%) anticipate a rise in production volumes in the next 12 months, while only 2% forecast a reduction. (…)
The PMI has been sliding lower since the peak seen in January and the June reading points to a stagnation – at best – in the official manufacturing output data.
“The survey’s employment index meanwhile suggests that factories will make little or no contribution to non-farm payroll growth in June.

-
 The ISM has a totally different reading:
The June PMI® registered 57.8 percent, an increase of 2.9 percentage points from the May reading of 54.9 percent. The New Orders Index registered 63.5 percent, an increase of 4 percentage points from the May reading of 59.5 percent.
The Production Index registered 62.4 percent, a 5.3 percentage point increase compared to the May reading of 57.1 percent. The Employment Index registered 57.2 percent, an increase of 3.7 percentage points from the May reading of 53.5 percent. The Supplier Deliveries index registered 57 percent, a 3.9 percentage point increase from the May reading of 53.1 percent. The Inventories Index registered 49 percent, a decrease of 2.5 percentage points from the May reading of 51.5 percent.
The Prices Index registered 55 percent in June, a decrease of 5.5 percentage points from the May reading of 60.5 percent, indicating higher raw materials’ prices for the 16th consecutive month, but at a slower rate of increase in June compared with May. Comments from the panel generally reflect expanding business conditions; with new orders, production, employment, backlog and exports all growing in June compared to May and with supplier deliveries and inventories struggling to keep up with the production pace.

- WHAT RESPONDENTS ARE SAYING …
- “Overall, business is strong. (Plastics & Rubber Products)
- “Overall, demand is up 5-7 percent and expected to continue through the end of the year, at least. ” (Transportation Equipment)
- “Demand is picking up; meeting budget expectations.” (Electrical Equipment, Appliances & Components)
- “Business is still very robust. Have continued to hire to match increased demand.” (Computer & Electronic Products)
- “Business [is] steady; not great, but good and fairly solid.” (Furniture & Related Products)
- “Business globally continues to show improvement.” (Chemical Products)
- “Dry weather helping demand.” (Nonmetallic Mineral Products)
- “International business outside North America on the upswing.” (Machinery)
- “Metal pricing continues to drag down our profit margins, but we are very busy quoting new business, so our customers have a good outlook on the rest of the year.” (Fabricated Metal Products)
- “Business is strong both domestically and internationally. Supplier deliveries are quick domestically, international supply chain is slowing. We are in a hiring mode.” (Food, Beverage & Tobacco Products)
Differences between these two surveys are not unusual (see my Dec . 2012 post: U.S. PMI: Markit vs ISM and my Nov. 3, 2015 post). I tend to give more weight to Markit’s for the following reasons:
- While the sub-indices (New Orders, Production, Employment, Supplier Deliveries, and Inventories) in the ISM PMI composite reading are equally weighted, the Markit PMI reading assigns unequal weightings to the five component sub-indices (New Orders—0.3, Output—0.25, Employment—0.2, Suppliers’ Delivery Times—0.15, and Stocks of Items Purchased—0.1, with delivery times inverted) which makes more sense to me.
- Markit’s survey panel is nearly twice as large as the ISM’s stated panel size, is very closely mapped against the official structure of the economy and uses a different method of seasonal adjustment, calculating the factors every month instead of once per year.
- These methodological differences have a clear impact. When the Output Indexes from the two surveys are compared against the three-month change in official production data (a widely used comparison for survey and official data), the Markit index has a correlation of 94% compared with 87% for the ISM data (this is based in both cases on the data from mid-2007 onwards, when Markit data were first available). These calculations are from Markit.
- Markit has been more right than the ISM.
Advisor Perspectives has more on the ISM here.
Here’s a chart plotting both surveys since 2010:
 Source: @Danske_Research
CAR SALES DON’T JIBE WITH STRONG MANUFACTURING
- Industry consultant Autodata put the industry’s seasonally adjusted annualized rate of sales at 16.51 million units, which was the lowest rate since February 2015. It came in below Wall Street expectations of 16.6 million vehicles and 2 percent lower than the June 2016 figure. (…)
- Edmunds.com reported that the average monthly payment on a car or truck has soared above $500, forcing buyers to stretch more than ever to obtain a new set of wheels. The firm estimates the average auto-loan length reached a record 69.3 months in June, with the average amount of financing reaching $30,945, up $631 from May.
- Sales to retail customers at dealerships are down less than 1% over the first six months of the year, but sales to nonretail customers such as government fleets, commercial buyers and rental-car companies are off 7.8%, according to J.D. Power.
- Alan Batey, president of GM’s North America region, said an unexpectedly severe downturn in consumer demand for sedans has made it more difficult to ease rental sales, because the rental business would typically help make up the shortfall. “It has tested our commitment” to the strategy, he said, forcing GM to make “tough decisions” to reduce passenger-car production this year, which led to thousands of layoffs at its factories.
In all, vehicle sales declined in 5 of the first 6 months of the year, down at a 20% annual rate!


The value of construction put-in-place held steady during May (+4.9% y/y) following a 0.7% April dip, revised from -1.4%. Earlier figures also were revised. Expectations were for a 0.3% rise in the Action Economics Forecast Survey.
Private sector construction activity declined 0.6% in May following a 0.2% dip, but it increased 6.4% from a year earlier.
Total construction is down at a 1.6% annualized rate between March and May. Private non-residential is down at a 9.5% a.r. while public spending is virtually flat.
The final IHS Markit Eurozone PMI® Composite Output Index fell to a four-month low of 56.3 in June, but was above the earlier flash estimate of 55.7 and only slightly below April and May’s six year record highs of 56.8. The average reading over the second quarter as a whole (56.6) was also the best outcome since Q1 2011. The expansion was again led by the manufacturing sector, where production rose to the greatest extent since April 2011. Although the rate of growth in service sector activity moderated, it was still among the strongest seen over the past six years.

June saw the level of incoming new business rise at the quickest pace in three months and to one of the greatest degrees since early-2011. This tested capacity at manufacturers and service providers, leading backlogs of work to accumulate at one of the fastest rates in six years. This in turn supported further job creation, with staffing levels rising at one of the fastest rates over the past decade. Despite signs of capacity being strained, average output prices rose at the slowest pace for five months in June. This mainly reflected a further easing in cost inflationary pressures, as input prices rose at the weakest rate since last November. (…)
The latest readings are indicative of the eurozone growing by an impressive 0.7% in the second quarter. The dip in the PMI in June certainly doesn’t look like the start of a slowdown. Growth of new orders accelerated very slightly to reach the second highest in just over six years, and companies are struggling to satisfy this increase in demand.

The Caixin China Composite PMI™ data (which covers both manufacturing and services) pointed to a marginal increase in total Chinese business activity at the end of the second quarter. At 51.1 in June, the Composite Output Index fell from 51.5 in May to signal the slowest rate of expansion in a year.
Latest data indicated that the slowdown in overall growth was driven by a weaker performance of the service sector. The seasonally adjusted Caixin China General Services Business Activity Index posted 51.6, down from a four-month high of 52.8 in May, to signal the second-slowest increase in activity for 13 months (after April 2017). At the same time, manufacturing production growth picked up slightly since May, but remained marginal overall.
Slower growth in services activity coincided with a softer increase in new work in June. Services companies noted the weakest increase in new orders for just over a year, with a number of firms mentioning that subdued market conditions had weighed on client spending. Meanwhile, new business rose at a slightly quicker (albeit still marginal) pace across the manufacturing sector. At the composite level, new work increased at a modest pace that was the slowest recorded in nine months. (…)

The global manufacturing economy saw sustained improvement in June, albeit with output growth slipping to the weakest since last September. The headline JPMorgan PMI, compiled by IHS Markit, was unchanged at 52.6 in June, rounding off a solid second quarter.
The global survey’s output index fell, however, down slightly for a third successive month, to suggest that production growth has cooled slightly across the world’s factories. The rate of increase of new orders likewise moderated for a third month.

A drop in the survey’s new orders to inventory ratio to a six-month low hints at production growth cooling further as we move into the third quarter. On the other hand, firms’ expectations about the coming year regained some poise after sliding to a five-month low in May, lending support to the view that the upturn has further to run and that any slowdown could be temporary.
Manufacturing input cost inflation meanwhile eased for a fifth straight month from January’s five-and-a-half year peak, mainly reflecting lower global commodity prices (notably oil). Output price inflation picked up slightly as many firms sought to rebuild profit margins, though the rate of increase was up only marginally on May’s eight-month low.
While supplier lead times continued to lengthen, suggesting many firms are enjoying an increase in pricing power as demand exceeded supply, delivery delays remained relatively moderate on the whole and indicative of only modest inflationary pressures.

European countries continued to dominate the manufacturing PMI rankings in June, led by Austria and Germany. All of the top 11 fastest growing manufacturing economies were located in Europe, with the exceptions of neighbouring Turkey (albeit part-European) and Australia.
In contrast, Asia nations generally struggled. Six of the bottom seven countries in the global ranking were all Asian, including China.
Eurozone Producer Prices Fell in May Figures indicate inflation is likely to remain weak despite pickup in economic growth
The European Union’s statistics agency said Tuesday that producer prices fell 0.4% from April, although they were up 3.3% from May 2016. (…)


(…) “The recent collapse in oil prices was triggered by a breakdown in the technical charts but fueled by the ‘negative feedback loop’ of bearish headlines that usually follow price declines,” the analysts wrote in a July 3 note to investors. “Some oil price headlines have been misleading, or outright wrong, and they have distracted investors from what we believe is fundamentally a bullish overall picture.” (…)
Those concerns have been overblown, the Raymond James analysts argued, saying trends pertaining to U.S. inventories, production and gasoline demand have been misinterpreted. They put out a list of “myths” that explain the downturn and set out to debunk them in arguing that crude can rise about 45 percent from current levels. (…)
If you drew up a list of preconditions for recession, it would include the following: a labor market at full strength, frothy asset prices, tightening central banks, and a pervasive sense of calm. (…)
Still, the presence of recession preconditions isn’t enough to say one is imminent. (…) when unemployment got nearly this low in 1989 and again in 2006, a recession was about a year away; but in 1998, it was three years away, and in 1965, four years. A narrowing spread between short-term interest rates and long-term rates comparable to the present has happened 12 times since 1962, and only five times did recession follow within two years. (…)
Inflation is uncomfortably low rather than too high as in previous cycles, which makes it less likely central banks will have to raise interest rates sharply or rapidly. But in a world with permanently lower inflation and growth, businesses will struggle to earn their way out of debt, and interest rates will bite at lower levels than before. This confronts the Fed with a dilemma. If bond yields remain around 2% to 2.5%, the Fed may be playing with fire by pushing rates to 3%, as planned. If it backs off those plans, it could egg on excesses that make any reversal more violent. (…)
Fed Signals Autumn Decision on Balance-Sheet Reduction Fed officials indicated there is a strong chance they will announce in September a decision to start shrinking the central bank’s portfolio, while putting off a rate increase.
The moves would give officials time to assess how markets react to the balance-sheet reductions and to confirm their view that a recent slowdown in inflation will fade. (…)
Despite the Fed’s interest rate increases, financial conditions have mostly eased, with stock markets running to new highs and the dollar falling. Yields on the 10-year Treasury are at 2.35%, up from recent lows but below the 2.64% annual high set in March. (…)
Higher Health Costs Challenge Republican Senators Republican senators are confronting a political challenge that is increasingly hard to ignore: Under their health-care overhaul, average premiums for a midlevel insurance plan would jump by 20% next January.
CONFUSION ALSO PRESENT IN “MARKET INTERNALS”
Manufacturing surveys can be confusing but so can the so-called “market internals”.
John Hussman’s reading of such internals is clearly bearish:
Investors should understand that unlike much of the advancing period since 2009, our measures of market internals have deteriorated considerably, which now creates vulnerability that extreme valuations will collapse. (Mesas, Valleys, Plateaus, and Cliffs)
He gave more details the previous week:
Put simply, with market internals unfavorable and interest rates off the zero bound, the two main supports that made the half-cycle since 2009 “different” have already been kicked away. From here, we expect the dynamics of this market cycle to resemble other periods when offensive valuations and extreme overvalued, overbought, overbullish syndromes were joined by deteriorating market internals (particularly when interest rates were off their lows). Short term market outcomes are anybody’s guess, but across history, that overall combination has typically defined crash dynamics.
Notably, we’ve observed a widening of internal dispersion in recent weeks. For example, weekly NYSE new lows have averaged about 4% of traded issues recently, with nearly 6% last week, even with the S&P 500 near record highs. Meanwhile, nearly 40% of stocks are already below their 200-day averages. I’ve noted before that raw “Hindenburg Omens” (days when both NYSE new highs and new lows exceed about 2.5% of traded issues) are typically not ominous at all. The exception is where they are accompanied by a broader syndrome of tepid market breadth even with the major indices still elevated, when multiple signals appear in close succession, and when market internals are unfavorable on our own measures. On that note, we’ve observed 4 such daily signals in recent weeks, with two last week alone. We saw similar widening of internal dispersion in December 1999, July and November 2007, and July-August 2015. Still there are a few signals such as 2006 and 2013 that were followed by only minor hiccups. That improves the average outcome, though the average is still negative overall. (Two Supports, Already Kicked Away)
Lowry’s Research reads very different internals of the same animal:
Currently, this bull market is enjoying what is typically the most positive relationship between buyers and sellers – expanding Demand and contracting Supply. That is, our Buying Power Index has been trending higher since early Nov. 2016, reaching a new high in this uptrend on June 30th. In contrast, Selling Pressure has been trending lower since Nov. 2016 and matched its reaction low on June 30th. Thus, both Indexes are in well-established trends of more than eight months and counting. Looking back at all the major market tops since 1929 and there are no, zero, instances of a major market top preceded by a similarly sustained uptrend in Buying Power and downtrend in Selling Pressure.
The process of forming a major market top also includes a gradual deterioration in market breadth, as investors find fewer and fewer stocks at valuations that appear to justify new buying. This deterioration in breadth can be a prolonged process, as it typically first appears among small cap stocks, then migrates to mid caps and finally to large caps. Eventually, this deteriorating breadth affects the Adv-Dec Lines, which begin to diverge from the major price indexes. Historically, this divergence (and, more often, series of divergences) begins at least four to six months prior to the final bull market high. And, these Adv-Dec Line divergences have occurred prior to every bull market top with only three exceptions – 1946, 1952 and 1976.
So, how are the Adv-Dec Lines doing today? The NY all-issues Adv-Dec Line recorded a new all-time high on June 29th and is leading gains in the S&P 500. Lowry’s OCO Adv-Dec Lines, consisting solely of common stocks, reached a new high on June 14th and was only a few issues short of a new high on June 28th. Thus, the Adv-Dec Lines confirm the Buying Power and Selling Pressure Indexes in signaling a healthy bull market.
In summary, even healthy bull markets can experience corrections from time to time. But, absent diverging Adv-Dec Lines accompanied by sustained trends of expanding Supply and contracting Demand, any short term correction in the months ahead is unlikely to develop into a major decline.
Potential caveat: the strong trends towards ETFs could blur the breadth readings as funds blindly keep buying the larger weights, pulling markets higher, drawing more flows into ETFs…
U.S. Warns North Korea It’s Ready For War Over Missiles The U.S. warned North Korea that it is ready to fight if provoked, as Pyongyang claimed another weapons-development breakthrough following its launch Tuesday of an intercontinental ballistic missile.
-
-
Going ballistic: North Korea
Yesterday’s successful intercontinental ballistic missile test marks a breakthrough in the country’s nuclear programme. The rocket that landed off Japan’s west coast yesterday followed a high, “lofted” trajectory whose range implies the missiles could travel 7,000km—enough to reach Alaska. That is striking progress, although the country is still far from having a reliable nuclear warhead. In January President Donald Trump promised that a North Korean ICBM test “won’t happen”; he may now look weak. That he recently claimed to have given up on getting help from China to curb the North’s nuclear ambitions won’t help either. Calls for new UN sanctions come as existing ones are poorly enforced. Some hawks argue for pre-emptive American strikes, but that would bring unthinkable retaliation risks for South Korea. Mr Trump promised a new direction on North Korea. Instead he is stuck with the old, lousy options. (The Economist)
Volvo to Switch to Electric, in First for Major Auto Firm Volvo will become the first major auto maker to abandon the conventional car engine—technology used for more than a century. All new Volvo models from 2019 will be either fully electric or a hybrid.


