The enemy of knowledge is not ignorance, it’s the illusion of knowledge (Stephen Hawking)

It ain’t what you don’t know that gets you into trouble. It’s what you know for sure that just ain’t so (Mark Twain)

Invest with smart knowledge and objective odds

THE DAILY EDGE: 8 NOVEMBER 2021: The Robots Are Coming! Slowly…

U.S. Jobs Growth Rebounded Last Month The U.S. added 531,000 jobs in October and the unemployment rate fell to 4.6%, as the labor market rebounded from a summer lull.

The U.S. labor market sprang back to life in October after a summer slowdown, with employers briskly adding jobs and nearly 200,000 women joining the labor force.

The economy churned out 531,000 new jobs last month, the biggest gain in three months, the Labor Department said Friday. Restaurants, consulting firms and factories all boosted hiring, suggesting broad strength across the economy. Nationwide job growth was also stronger in August and September than previously estimated, with new data boosting employment over that period by 235,000 jobs.

Even with last month’s pickup in job growth to an average of 582,000 jobs a month this year, growth remained below the monthly average of 641,000 jobs that the economy created in the first seven months of the year.

The unemployment rate fell to 4.6% in October from 4.8% a month earlier, and is down by more than half a percentage point in just two months. (…)

About 180,000 female workers aged 16 and older joined the labor force in October, as Covid-19 cases declined and schools reopened. (…)

The average hourly wage for private-sector workers rose 0.4% in October from a month earlier and 4.9% compared with a year ago. In the 15 years before the pandemic, wages grew an average 2.5% a year. (…)

In October, the labor force grew by 104,000 people, entirely due to an increase in female workers. Participation among men fell. But the overall gain in the labor force was modest, leaving the participation rate at 61.6%, near the lowest level since the 1970s. (…)

Good thing Powell made “maximum employment” fuzzier last week. Participation rates are not recovering:

fredgraph - 2021-11-08T071301.931

Aggregate weekly payrolls (employment x wages x hours) is up 9.3% YoY, stable growth since August. During the last 3 months, payrolls grew at a 10.2% annualized rate, very similar to the 10.0% rate of the previous 3 months. However, employment growth accounted for 28% of the growth since August, down from 51% during the May-July period. Wage growth is now running at a 5.3% annualized rate while weekly hours have stabilized at their cyclical peak.

fredgraph - 2021-11-08T061608.546

fredgraph - 2021-11-08T060946.800

Americans are gradually bringing their consumption growth in line with the growth in payrolls as the splurge on durable goods is abating. If employment keeps rising at about 600k per month (+0.4% MoM) and wages maintain their recent 0.4-0.5% pace, payrolls and nominal expenditures should keep rising 10% annualized through next spring. The “stag” part in stagflation seems unlikely for now.

fredgraph - 2021-11-08T063343.395

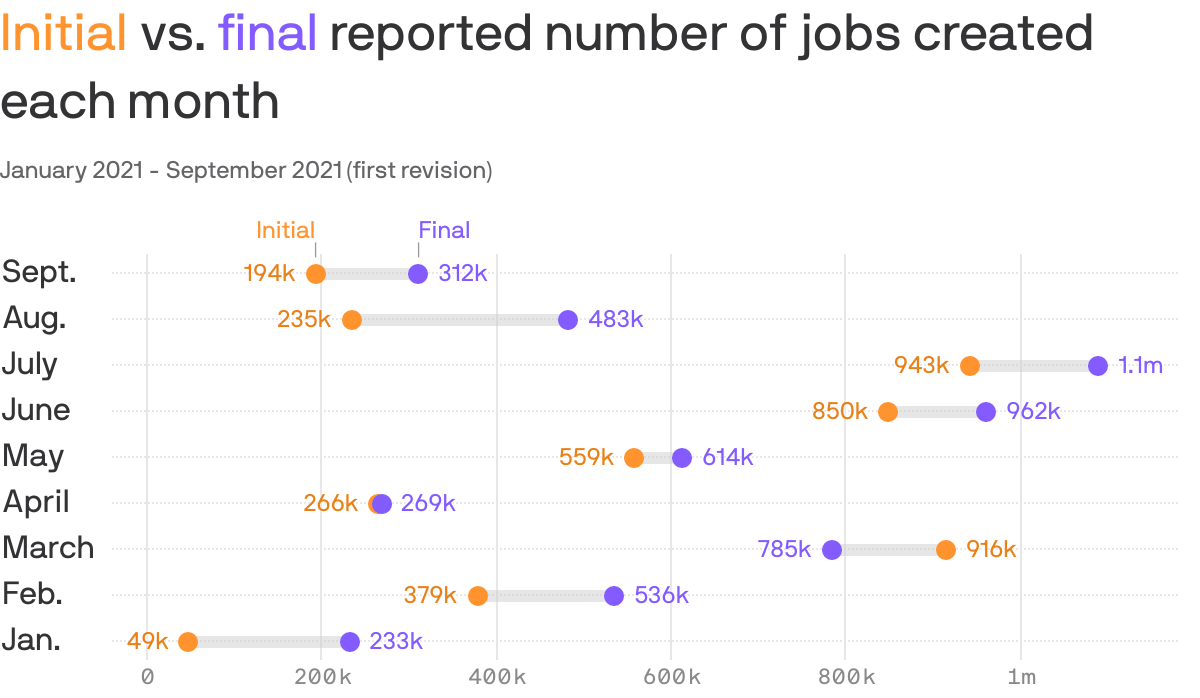
  • The year of revisions (Axios)

Sometimes the initial picture is only half the story. The October jobs report, out Friday, included considerable revisions to the tally of new jobs created in August and September — enough to change how we view the economy’s progress through the peak of the Delta variant.

It’s a reminder to step back and let the whole picture take shape. Throughout the pandemic recovery — a time with absolutely no modern economic precedent — the imperfections of gathering complex data have become all the more stark.

So far this year, the initial jobs number undershot the final estimate in all but one month, with an average of 99,000 in additional jobs per month subsequently added. In total, more than a million jobs have been added to the tally by way of revisions.

In the more predictable 2019, the average total revisions per month amounted to just 10,000, noted the White House Council for Economic Advisers in a tweet on Friday.

The data so far this year imply it would be reasonable to expect October’s red hot job gains to get revised even higher — and for September’s number to receive another lift as well.

Canada’s Jobs Engine Shifts Into Lower Gear With 31,000 Gain The economy added 31,200 jobs last month, Statistics Canada said Friday in Ottawa, missing expectations for a gain of 41,600 in a Bloomberg survey of economists. The unemployment rate fell to 6.7% from 6.9% in September, and total hours worked rose 1%. Average hourly wages for permanent workers were up 2.1% from a year earlier, suggesting the impact of rising consumer price inflation has yet to drive pay gains higher.

Canada employment exceeds pre-pandemic levels

But, why is that?

fredgraph - 2021-11-08T061020.458

A Hawkish Case for Fed Action on Inflation Emerges “Disruptions that initially appeared to be temporary bottlenecks driving up prices now look as if they may be more long-lasting,” Kansas City Fed chief Esther George said

(…) “I think transitory, to economists, means sort of not permanent,” Mr. Macklem said in an interview that aired on CTV’s Question Period. “I think to a lot of people, transitory means it’s going to be over quickly. … I don’t know exactly what the right word is, but it’s probably something like, ‘transitory but not short-lived.’”

Mr. Macklem pointed to the bank’s latest inflation projections, published on Oct. 27, which show the annual rate of inflation rising to close to 5 per cent for the remainder of the year, before dropping to around 2 per cent by the end of next year. The bank now expects inflation to average 3.4 per cent for the whole of next year, a full percentage point higher than its previous projection, from July. Inflation hit an 18-year high of 4.4 per cent in September. (…)

Unions Are on the Rise, But So Are the Robots

(…) There were a record 310,700 industrial robots operating in the U.S. last year, up 6% from 2019, according to a report from the International Federation of Robotics released late last week. New robot installations actually declined in the U.S. last year as the financial strains of the pandemic weighed on corporate spending, but manufacturing headcount also fell, boosting the ratio of robots to humans.

There were 255 industrial robots operating for every 10,000 manufacturing employees last year, compared with 229 in 2019, IFR data show. That growth boosted the U.S. two spots on IFR’s country-by-country comparison of robot density, and the country now sits in seventh place globally. But the real growth is just getting started. The IFR projects that North American robot installations will grow 17% in 2021 and that a “post-crisis boom” will continue to fuel low double-digit growth rates in 2022 and beyond. (…)

Indeed, the recently concluded earnings and fall conference season was littered with comments about automation investments. Garbage-hauler Waste Management Inc. found upgrading and rebuilding its single-stream recycling plants can reduce the labor needed to operate them by 35%-plus. The company has accelerated this overhaul and now expects to revamp 90% of this volume by 2023 or 2024. “Certain jobs simply don’t attract the interest they previously did,” CEO James Fish said.

In the biopharma sector, “we can get to the point where we’re automating a lot of the small-scale assembly and a lot of the inspection processes,” Rich Tobin, CEO of pump-maker Dover Corp., said at an investor conference in September. “Our ability to expand capacity in colder products on the biopharma side has not required the traditional amount of labor that [it would have] if we had done this project four or five years ago.” Air-conditioner maker Carrier Global Corp. has increased its investments in automation by 50% this year and expects those systems to have churned out 6 million hours of manufacturing work by the end of 2026, CEO Dave Gitlin said. Toolmaker Stanley Black & Decker Inc., which has committed to moving big chunks of its China-based supply chain to the U.S., highlighted automation projects underway at a facility in Charlotte, North Carolina. (…)

This IFR presentation has lots of interesting charts, most of which are not very flattering for the U.S. compared to China. It seems that robots did nit get the MAGA memo. Just when we really need a productivity boost.

image

image

image

image

 image image

image

Yes, America is forecast to grow its robots installations 30% between 2021 and 2021, bettering Australasia’s 21%. But compared to 2019, growth is 28% vs 48%.

image

EARNINGS WATCH

Through Nov. 5, 445 companies in the S&P 500 Index have reported earnings for Q3 2021. Of these companies, 80.7% reported earnings above analyst expectations and 14.6% reported earnings below analyst expectations. In a typical quarter (since 1994), 66% of companies beat estimates and 20% miss estimates. Over the past four quarters, 85% of companies beat the estimates and 12% missed estimates.

In aggregate, companies are reporting earnings that are 10.7% above estimates, which compares to a long-term (since 1994) average surprise factor of 4.0% and the average surprise factor over the prior four quarters of 18.3%.

Of these companies, 76.2% reported revenue above analyst expectations and 23.8% reported revenue below analyst expectations. In a typical quarter (since 2002), 61% of companies beat estimates and 39% miss estimates. Over the past four quarters, 79% of companies beat the estimates and 21% missed estimates.

In aggregate, companies are reporting revenues that are 2.7% above estimates, which compares to a long-term (since 2002) average surprise factor of 1.2% and the average surprise factor over the prior four quarters of 4.1%.

The estimated earnings growth rate for the S&P 500 for 21Q3 is 41.5%. If the energy sector is excluded, the growth rate declines to 33.2%. The estimated revenue growth rate for the S&P 500 for 21Q3 is 16.2%. If the energy sector is excluded, the growth rate declines to 12.8%.

The estimated earnings growth rate for the S&P 500 for 21Q4 is 21.8%. If the energy sector is excluded, the growth rate declines to 14.6%.

Analysts keep revising upwards:

image

image

image

Pointing up Even though more companies are warning negatively:

image

TECHNICALS WATCH

Last week’s bounce in small caps is a positive sign that investor interest is broadening.

iwm

The large caps 13/34–Week EMA Trend is back on its solid trend.

CANADA ON THE CHEAP!

image

image

From my old friend John Aitkens:

image

image

image

Fiera Capital’s excellent team of strategists currently expects that U.S. and international equities will offer negative returns in the next 12-18 months but that Canadian equities, thanks to their resource bias, will fare positively in a reflationary recovery scenario (50% probability). A stagflation scenario (40%) would take all investors in double digit red numbers however.

China Bond Rout Shifts From Evergrande to Other Big Developers

China property woes hit the nation's biggest developers

Xi lays groundwork for third term by adopting Mao and Deng’s power ploy Chinese president expected to be elevated into Communist pantheon at annual party meeting

THE DAILY EDGE: 7 AUGUST 2019

World Economy Edges Closer to a Recession as Trade Fears Spread

(…) New Zealand’s central bank on Wednesday stunned investors by dropping its benchmark rate by 50 basis points, double the expected reduction and sending the kiwi tumbling. Thailand also surprised, cutting by 25 basis points. India’s central bank lowered its rate by an unconventional 35 basis points. (…)

Morgan Stanley economists predict that if the U.S. puts 25% tariffs on all Chinese imports for four to six months and the country hits back, a global economic contraction is likely within three quarters. The tensions also extend beyond the U.S and China to include Japan and South Korea as well as Britain’s future relationship with the European Union. (…)

While central banks would likely cut interest rates and perhaps resume quantitative easing, that may no longer be enough to revive animal spirits this time and governments might not be fast enough to loosen fiscal policy.

“With no end in sight, there are significant downside risks to our forecasts for U.S. and global growth,” Bank of America Corp. economists warned clients this week. “If the trade war escalates — this could include a more explicit currency war — uncertainty would be considerably higher and financial conditions much tighter.” (…)

U.S. JOLTS: Job Openings Rate Slips; Hiring Rate Steadies

The Bureau of Labor Statistics reported that the total job openings rate eased to 4.6% during June from 4.7% in May, revised from 4.6%. It remained below the 4.8% record logged early this year. The job openings rate is the job openings level as a percent of total employment plus the job openings level. The ability to find workers to fill openings remained difficult. The hiring rate held steady at 3.8%. It has been below the openings rate since mid-2014. Employers are still reluctant to let people go. The layoff & discharge rate has returned to the record low of 1.1%. Individuals remain ready to find new work. The quits rate in June held steady at a near-record 2.3% where it’s been since last year.

The private-sector job openings rate also held steady m/m at 4.9%. It remained below the 5.2% record reached in November. The rate has increased from 4.6% early last year and from the 2.0% average at the recession low in 2009. (…) The government sector job openings rate improved to a near-record 3.1%, up sharply from the 2009 low of 1.2%.

Job availability fell slightly m/m, but nevertheless remained plentiful. The level of job openings eased a modest 0.5% (-0.6% y/y) to 7.348 million after improving 0.2% to 7.384 million in May. These figures are just below the record high. Private-sector openings fell 1.8% y/y while government sector job openings jumped by one-third y/y.

Hiring activity remained stable. The private-sector hiring rate held at 4.2% and remained below January’s expansion high of 4.4%.(…) The hiring rate in government remained at 1.6%.

Haver Analytics focuses on opening and hiring rates. I prefer to look at the actual number of openings and hires. Openings have dropped 3.6% since peaking at the end of 2018. The decline is worse in the private sector: –4.8%

image

The  YoY trends: total non-farm: openings –0.6%, hires –2.2%. Private sector: openings –1.8%, hires –2.0%.

image

Hmmm…how tight is this labor market?

China Keeps Official Yuan Rate Just Stronger Than 7 Per Dollar China set a daily anchor for trading in its currency at the weakest since 2008 but again avoided moving that official rate beyond the symbolic 7-yuan-per-dollar level.
China Deals ‘Body Blow’ to Struggling U.S. Farm Belt Farmers, agricultural groups decry retaliatory move to stop buying U.S. crops and livestock

China’s move will affect farmers raising fuzzy green soybean pods in Illinois, milking cows in California and feeding hogs in North Carolina, all of whom have seen business suffer as a result of tariffs that Chinese officials implemented last year. (…)

Feeding China’s growing appetite has meant big business for the U.S. farm economy. China was one of the biggest export destinations for U.S. agricultural commodities from 2009 to 2017 alongside Canada and Mexico, according to the U.S. Department of Agriculture. In 2017, Chinese buyers imported $19.5 billion in farm goods. (…)

That dropped to $9.1 billion last year as China’s tariffs on U.S. soybeans, pork, milk and other products made them more expensive for importers there, prompting some to seek alternatives and scale back imports from the U.S. Over the first six months of this year, China’s agricultural imports from the U.S. were down 20% from the same period last year. (…) Jim Mulhern, chief executive of the National Milk Producers Federation, said dairy exports to China have dropped 54% so far this year.

Given the scale of China’s agricultural imports, it would be hard for U.S. farmers to make up for those sales even with much higher exports to other nations, economists say. (…)

The USDA last week began signing up farmers for a program that will disperse about $14.5 billion to U.S. farms, following a roughly $10 billion program last year. Farmers say the government payments will help but likely won’t make them whole. (…)

Research firm Trade Partnership Worldwide LLC projected in February that tariffs on U.S. exports could cost the country’s agricultural sector 59,000 to 71,000 jobs over the next two years. (…)

Fingers crossed The sheer scale of China’s need for farm commodities including soybeans make it likely that the country would need to turn to the U.S. eventually, said Terry Reilly, senior agriculture futures analyst at brokerage firm Futures International. (…)

High five Archer Daniels Midland Co. , after reporting a 58.5% decline in quarterly earnings last week, warned that China is becoming more comfortable buying food elsewhere, recently approving poultry imports from Russia and pork shipments from Argentina.

“People find alternatives, and eventually, they become a little bit more comfortable with those alternatives,” said Juan Luciano, ADM’s chief executive. “This is not good for the U.S. farmer. This is not good for the percentage of U.S. in the export markets.” (…)

Cautious calm returns as White House softens trade war rhetoric

Confused smile This Reuters’ headline is not supported by any factual “White House rhetoric” in the body of the article. I searched around and really found nothing to support that. Same with this other Reuters’ headline: Trump dismisses fears of long-lasting trade war

Tariff Fears Caused a U.S. Import Surge. Now Warehouses Are Full

A short drive outside Los Angeles lies one of the world’s biggest warehouse complexes. Gene Seroka says its 1.8 billion square feet of capacity — enough room to house 9 million cars — is “bursting at the seams.”

The warehouse district is part of the Inland Empire, serving the port of Long Beach and the twin port of Los Angeles, where Seroka is executive director. Together they handle almost half of American’s maritime trade with China. If you live in the U.S., especially the western half, your toothbrush, television or shoes may well have passed through the Empire. (…)

Now, Seroka says that spare room is down to an unprecedentedly low level of about 1%-2%. Try to squeeze in more stuff, in other words, and it’ll be impossible to drive forklifts around or even walk the aisles. (…)

Reuters’ Exclusive: China warns India of ‘reverse sanctions’ if Huawei is blocked – sources

China has told India not to block its Huawei Technologies [HWT.UL] from doing business in the country, warning there could be consequences for Indian firms operating in China, sources with knowledge of the matter said.

India is due to hold trials for installing a next-generation 5G cellular network in the next few months, but has not yet taken a call on whether it would invite the Chinese telecoms equipment maker to take part, telecoms minister Ravi Shankar Prasad has said. (…)

A high-level group of officials, led by the Principal Scientific Adviser to the Indian government K Vijay Raghavan and including representatives from the departments of telecoms, information technology and the intelligence services, has been looking into whether to open the 5G trials to Huawei.

The committee has found no evidence to suggest Huawei has used “back-door” programs or malware to collect data in its current operations in India, the first source and another official in the federal telecoms ministry said.

The interior ministry, which is responsible for the security of the infrastructure, had issued no directive to curtail Huawei’s entry, the telecoms official said.

“We can’t simply reject them just because they are Chinese,” said the official. (…)

Global Oil Prices Slide Into Bear Market Brent crude has fallen more than 20% from an April high amid fresh concerns that the U.S.-China trade war will hurt the global economy and curb fuel consumption.

(gasbuddy.com)

Heavy-Duty Truck Orders Hit Lowest Level in Nine Years Decline comes as truckers point to excess capacity and dimming industrial shipping demand

(…) FTR, which tracks equipment purchases by freight transportation carriers, said orders for heavy-duty trucks in North America fell to 9,800 in July, down 82% from a year ago. Separately, ACT Research said it counted 10,200 orders last month, the fewest it has measured in a month since February 2010. Figures for both groups were preliminary, with final reports due later this month. (…)

DAT Solutions LLC, which matches available trucks to companies looking to move goods in trucking’s spot market, said its measure of capacity in that arena was up 22.6% in July from a year ago while demand was down 37.3%. Several trucking companies said in their second-quarter earnings reports that increases in contract rates also have pulled back since the start of the year.

Truckers say a big part of the waning demand comes from weakness in the manufacturing sector. (…) FTR now expects factory output of heavy-duty trucks to decline 22% next year to about 275,000 units, down from the 353,000 units forecast for 2019, Mr. Ake said. (…)

America’s Pension Funds Fell Short in 2019 Public plans with more than $1 billion in assets earned a median return of 6.79% for the year ended June 30, the lowest since 2016

Public pension plans fell short of their projected returns this year, adding to the burden on governments struggling to fund promised benefits to retired workers. (…) Public pension plans project a median long-term return of 7.25%, according to data collected by Wilshire Associates in 2018. (…)

But those returns still haven’t brought pension funding levels close to what is needed to pay for future benefits. State and local pension plans have about $4.4 trillion in assets according to the Federal Reserve, $4.2 trillion less than they need to pay for promised future benefits. Contributing factors include increasing lifespans, overoptimistic return assumptions, and government decisions to skimp on pension payments. (…)

Robots and firms

(…) Figure 1, constructed from the ESEE dataset, provides a clear indication that firm heterogeneity in the adoption of robots matters greatly for the labour market effects of robot technology. It demonstrates that firms that adopted robots between 1990 and 1998 (‘robot adopters’) increased the number of jobs by more than 50% between 1998 and 2016, while firms that did not adopt robots (‘non-adopters’) reduced the number of jobs by more than 20% over the same period. From macro-level information on robot use, as employed in the existing literature, it is impossible to identify and investigate this striking pattern in the data. (…)

Figure 1 Evolution of firm-level employment for robot adopters versus non-adopters

Notes: The figure depicts the evolution of average firm-level employment (measured by the number of workers) in a balanced sample of firms from 1990-2016, separately for robot adopters (solid black line) and non-adopters (dashed grey line). Robot adopters are defined as firms that entered the sample in 1990 and had adopted robots by 1998. Non-adopters are firms that never use robots over the whole sample period.

We provide strong support for a hitherto neglected mechanism, namely, that robot adopters expand their scale of operations and create jobs, while non-adopters experience negative output and employment effects in the face of tougher competition with high-technology firms. Aggregate productivity gains are partly driven by substantial intra-industry reallocation of market shares and resources following a more widespread diffusion of robot technology, and a polarization between high-productivity robot adopters and low-productivity non-adopters.