Eurozone PMI rises to five-month high as manufacturers regain momentum
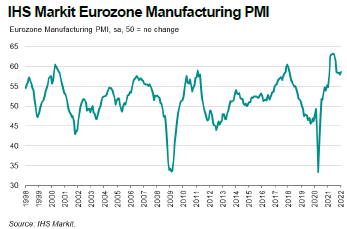
Latest IHS Markit PMI® data showed the eurozone manufacturing sector regaining some momentum at the beginning of 2022, with production, new orders and employment all registering faster increases. Improvements on these fronts also came amid further tentative signs of supply chain issues starting to abate, as vendor performance deteriorated to the weakest extent in a year.
The rate of input price inflation also eased, to the weakest in nine months, but factory gate charges were increased to the second-fastest extent in almost 20 years of data collection.
All three broad market groups registered strong improvements in manufacturing conditions during January, although investment goods makers remained the outperformer for a second straight month.
The IHS Markit Eurozone Manufacturing PMI rose to 58.7 in January, up from 58.0 in December and its highest level since last August. Furthermore, the latest data was also indicative of stronger growth momentum after the headline index slumped to a ten-month low previously.
Data split by euro area nation revealed Austria had the strongest-growing manufacturing sector in January, while faster expansions were also seen in the Netherlands, Germany and Ireland. Elsewhere,
manufacturing growth in Spain was strong and unchanged from December, while slower improvements were seen for Italy, Greece and France.
Eurozone manufacturing output increased further in January, extending the current sequence of growth to 19 months. Furthermore, the expansion accelerated to the quickest since last September. Demand conditions also improved, with new orders rising at the fastest pace in four months. Survey data showed stronger sales growth across overseas markets too as new export order growth quickened slightly over the month.
Capacity pressures remained apparent however, as evidenced by a further increase in backlogs of work. Overall, the level of outstanding business grew sharply and at a rate that was above its historical average, but the pace of accumulation was the softest since last February.
In an effort to clear unfulfilled orders and manage rising intakes of new work, additional staff were hired by eurozone goods producers in January. The rate of job creation was the fastest since last August and among the quickest in over 24 years of data collection.
That said, the supply side of the manufacturing sector continued to hinder efficient business operations. Latest survey data showed another steep deterioration in vendor performance during January. More positively, however, the extent to which supplier delivery times lengthened was the slowest in a year.
Consequently, fewer incidences of delivery delays facilitated a stronger expansion in purchasing activity, which rose at the quickest rate in five months. That said, the rate at which inputs were stockpiled slowed from December’s survey record.
On the prices front, latest data showed eurozone manufacturers were faced with still-substantial cost pressures in January. However, the rate of input price inflation eased to a nine-month low. Nevertheless, firms took a more aggressive approach to price setting, with factory gate charges rising at a faster rate. Furthermore, the rate of output price inflation was the second-fastest on record, surpassed only by that seen last November.

Japan: Manufacturing conditions improve sharply atstart of 2022
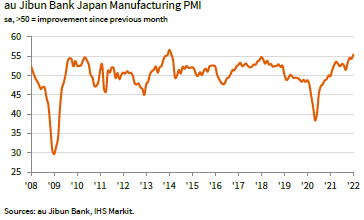
Japanese manufacturers indicated a stronger improvement in operating conditions in January. Both output and new orders rose at quicker rates at the turn of the year, with the former rising at the fastest pace in nearly eight years. The rise in demand was coupled with sustained reports of supply chain pressures as delivery delays and material shortages continued to weigh on input costs. Manufacturers were increasingly unable to absorb these increases, which resulted in the sharpest rise in output prices since July 2008. Firms reported that sustained disruption had encouraged them to boost safety stocks, with holdings of raw materials increasing at the second strongest rate in the survey history.
The headline au Jibun Bank Japan Manufacturing Purchasing Managers’ Index™ (PMI) rose from 54.3 in December to 55.4 in January, signalling a sharp improvement in the health of the sector. Moreover, the increase marked the strongest improvement in manufacturing performance since February 2014.
(… ) new orders among Japanese manufacturers rose further. The pace of the expansion was solid and the fastest recorded for nine months. Respondents linked higher sales to stronger client confidence in both domestic and international markets. As such, foreign demand for Japanese manufactured foods continued to expand at the start of the year, with the rate of growth quickening from that seen in December, as firms cited stronger demand in key markets for key sectors such as automotives and semiconductors. (…)
Bloated Inventories Are Poised to Slow the U.S. Economy Getting rid of those excess stockpiles will have negative effects that are mirror images of the positive effects of building them.
Gary Shilling also sees a negative inventory cycle:
(…) So it’s no surprise that inventories are bloated. Wholesale inventories climbed 2.1% in December from November and jumped 18.3% from a year earlier. Those excess goods hadn’t yet passed through to retailers, but their inventories already rose 4.4% in December from November.
The building of inventories has been the mainstay of economic growth. In the third quarter of 2021, it accounted for 2.2 percentage points of the 2.3% annualized increase in real GDP from the second quarter. So the rest of the economy rose at just a 0.1% annual rate. In the fourth quarter, the jump in inventories equaled 4.9 percentage points of the 6.9% annualized rate of growth. Without the inventory-building, the economy grew at only a 2.0% annual rate. That’s equal to my forecast of maximum U.S. growth this year but just half the International Monetary Fund’s forecast of 4%. (…)
Meanwhile, those container ships full of goods from Asia that are moored off the ports of Long Beach and Los Angeles will get unloaded and the goods moved inland. (…)
HIKES, YIKES!
There are signs that some Federal Reserve policy makers think that markets may be getting ahead of themselves with the projected pace of rate hikes. Four officials spoke yesterday, each emphasizing the need for gradual tightening and the need for moves to be data-dependent. Kansas City Fed President Esther George, a policy voter this year, said “unexpected adjustments” are in nobody’s interest while San Francisco Fed chief Mary Daly emphasized the need not to be disruptive. The dollar weakened and Treasury yields dropped as markets reacted to the reduced chances of a “shock and awe” hike next month. (Bloomberg)
Oil Posts Its Strongest January in Decades as Market Tightens The global benchmark settled above $91 a barrel, posting a 17% gain this month. The combination of booming demand, scratchy supply and dwindling stockpiles has helped crude soar this month, with top banks and oil companies saying prices may soon pass $100 a barrel.
Bloomberg:
Oil’s recent performance may prompt OPEC+ to go for a bigger-than-expected output increase tomorrow, Goldman said. The outcome remains evenly balanced and it said more than consensus would spark a short-term blip in prices, but wouldn’t change its bullish view. A Bloomberg survey predicted a bump of 400,000, but doubted it’ll be achieved in full as producers struggle to add their promised barrels.
Grilled Cheeses & Cars Could Get Costlier

The latest leg higher, however, is largely a reflection of traders pricing in Russia-Ukraine risk. The most obvious place to see it so far is rising oil and liquefied natural gas. Traders predict as much as a $10 knee-jerk rise in crude if Russia invades, with LNG prices also expected to jump further as supplies to Europe are already squeezed.
But it’s also happening beyond energy. Look at wheat and aluminum, for instance. Given that Russia and Ukraine combined make up a quarter of global grain exports, wheat and corn prices have risen on the possibility of a sudden supply crunch. It’s a similar story for aluminum, as Russia is a key producer of the metal. (…)
If you look at the whole of Russia’s behavior around Ukraine, its strategy becomes clear – or as clear as clear gets in geopolitics. The buildup of troops started months ago. In time, it dawned on the U.S. and its NATO allies that something might be happening. The Russians issued their demands a few weeks ago, asking that NATO not grant Ukraine membership into the alliance and that it withdraw weapons from Eastern Europe. Put differently, Moscow wanted to return to a status quo that it had held before the Soviet Union fell.
One explanation for Russian behavior thus emerged. Moscow’s demands made it seem as though Ukraine and Eastern Europe posed a unique threat to Russia that would abate if NATO abandoned ship. That is simply untrue; missiles no longer need to be close to be a target in order to be a threat. That demand therefore made little sense except in the case I have been pressing: Russia needs strategic depth against a ground assault. However unlikely this threat may be, it is primal and visceral. That threat would be abated some if NATO retreated westward, but it would be all but removed if Russian troops eventually were deployed westward.
The problem with this line of thinking is that Russia knew full well that the U.S. and its allies would reject its demands.
Another theory was that Russia always intended to invade Ukraine. It wanted the United States to reject its offer to justify a war. The Europeans generally don’t want a war, nor do many in the United States. The Russians may have believed the rejection of their demands would have created serious concern in Europe but no more than interested awareness in the United States. So if we shift the focus away from Ukraine, Russia’s intention might have been to simply divide NATO so deeply that it could never be repaired. Considering the Europeans are unwilling to financially sustain the alliance, the U.S. doesn’t trust its members to share all the risks, and with the general economic forces driving Europe apart, Russia doesn’t have to try all that hard to divide the alliance.
On this point, Germany, the de facto leader of Europe, is essential. Its economy is currently weakened by limits on its export market and internal imbalances from the COVID-19 pandemic. One of the stabilizing factors of its economy has been the reliability of Russian natural gas exports, a reliability that was to be enhanced by the Nord Stream 2 pipeline. Russia needs the revenue from selling to Europe in general and Germany in particular. Russia’s actions near Ukraine have thus created a conundrum. Germany – and really, all NATO members – needs Russia’s energy but does not trust Russia. A war might force Russia to stop exports to Europe, giving Germany and others the choice between internal mayhem and long-term security from Russia. Russia has made no overt move because the idea of an attack is more powerful than an actual attack.
This would explain why Russian demands were meant to be rejected, holding off an invasion while the fear of war grows. It would trigger German gestures of solidarity with NATO while urgently searching for a solution that would compel Russia to desist. It would explain Moscow’s extraordinary patience with the U.S. response, and it would explain the promise that in spite of massed forces, there will be no war. If NATO essentially breaks up, Russia will be in a position to create a neutral military zone and an economic zone that it is an integral part of and chief energy supplier to.
The one counter to all this is something we don’t usually pay attention to in geopolitics: public opinion. The outright rejection of the Russian offer should have divided the U.S. and created general anti-American feeling in Europe. So far, this has not happened, despite the fact that Russia is generally pretty good at using social and political divisions to shape the behavior of countries to its benefit.
Moscow’s actions and offers were meant to cast the U.S. as unreasonable. Yet no powerful anti-war movement has arisen in Europe as yet, and the division in Washington remains in place. Driving Europe in the direction the Russians want would seem to require public support. That would deny governments room for maneuver, which is precisely what Russia needs to do.
This is a complex explanation for a very complex set of maneuvers. If NATO shatters, the Russians think they will take control of Ukraine without risk. From the viewpoint of Germany at least, the benefits of NATO do not compare with the benefits of access to natural gas. Germany, for one, cannot value NATO over gas. Russia has adopted a strategy of indirect attack, first weakening NATO, perhaps mortally, then expecting Ukraine to fall in its lap. That is its expectation but Russia, as other nations, has been frequently wrong. The Russians were utterly honest when they said that they were not intending to attack Ukraine. They have bigger fish to fry before that.
Rent Inflation Shows That Landlords Have the Upper Hand Again The Federal Reserve’s rate hikes could add to upward pressure on residential leases.
(…) “We’ve never seen as much demand as we saw in 2021, and now we have a severe lack of availability and low vacancy in all types of housing as well, and that’s really driving the rent inflation that we’re seeing,” says Jay Parsons, the head of economics at RealPage, Inc., a company that provides property-management software for landlords. (…)
Omair Sharif, president of the research firm Inflation Insights, sees rental inflation hitting multidecade highs of 5% or more later this year as rent increases spread to existing leases across the country. A pickup in building activity already underway should, by sometime in 2023, help bring it back down into the 3% to 4% range that prevailed before the pandemic. “We are seeing a pretty substantial supply response in some of these metros where we have seen big gains,” he says. “It’s just going take some time.” (…)
Completed projects are being rented out at an “historically fast pace,” according to the Joint Center for Housing Studies of Harvard University’s annual report on the U.S. rental housing market, published Jan. 21.
“By the second quarter of 2021, 72% of units were leased within three months of completion, up from 43% in the first quarter of 2020 and exceeding the 57% averaged from 2014 through 2021,” the report said. “The rapid pace of absorptions may encourage developers to continue building rental properties at today’s robust rate, potentially easing some of the pressure on supply.” (…)
“As the Fed tightens policy in an effort to cool inflation, shelter costs are likely to run counter to policymakers’ intentions—rising as the newly employed demand shelter and as higher interest rates slow construction and discourage home-buying,” Riccadonna said in a Jan. 26 report.
- U.S. to reduce levies on most Canadian softwood producers The Commerce Department said late on Monday that based on its preliminary assessment, the combined countervailing and anti-dumping tariffs will be 11.64 per cent for most Canadian producers, compared with 17.91 per cent currently.
Elevated Job Openings Show Early Sign of a Pullback There were 10.8 million job openings on Jan. 21, according to an analysis of postings by jobs site Indeed, a decrease of more than a million from its estimate for the end of December.
(…) The government figures [out later this morning] lag behind private-sector data by about a month. (…)
“Overall, demand for workers is still quite strong, but some sectors might have just pulled back on their hiring plans because there has been a corresponding pullback in consumer demand for those services,” Mr. Bunker said. He added that businesses offering in-person services were more affected by the Omicron variant. (…)
BEAR…ISH?
Yesterday, David Rosenberg warned: “In the span of four weeks, we have had no fewer than SIX negative daily Dow reversals of 1%+. This happened 95% of the time in the past in 1987 (crash); 1990 (recession), 1997-98 (Asian crisis); 2000-03 (tech wreck/recession); 2008-09 (GFC); 2018 (Powell!). All either corrections or bear markets.”
Today, John Authers: Be Warned — the Turbulence This Time Is Different
(…) The volatility has been of the kind that normally only happens when a serious financial incident is in the offing. Also, while volatility persists, it’s now been a week since the Nasdaq 100 and the S&P 500 put in a bottom. It’s just possible that the worst is already over, after both those indexes had suffered double-figure percentage falls but avoided the 20% decline widely taken to signify a bear market.
The maximum drawdowns before last week’s Monday afternoon turnaround were 16.58% for the Nasdaq 100 and 11.97% for the S&P 500. Is it reasonable to hope that the worst is over?
(…) while there remain plenty of reasons to buy the Nasdaq 100 at present, valuation isn’t one of them. The index is still more expensive than it was on the eve of the crash in 2008, and at any time between then and the arrival of Covid. (…)
Looking at corrections as a trading phenomenon, the following work from Oxford Economics suggests that we are indeed entitled to hope that this incident is largely played out, if we assume that no recession is imminent (and very, very few are prepared to predict one this year.) (…)
If there isn’t a recession, selloffs tend to burn themselves out at around the 20% mark, while the average drawdown, once a selloff has reached 10%, stops at 15.4%. According to research by Crandall, Pierce & Co., since 1945 the average S&P fall of between 10% and 20% has bottomed at 13.96%, so this incident would look pretty typical if the bottom was already in. It doesn’t seem too much to ask that the worst is behind us. Or, to put a more bearish spin on it, the market will muddle through for now, and only collapse once a recession becomes unavoidable. For a precedent, take the summer of 2007, when the S&P sold off 11.91% as the credit crisis broke out, scrambled all the way to make a new high in October — and then endured a 57.69% selloff as recession took hold in 2008.
(…) turbulence starting with valuations this elevated, interest rates this low, and inflation at a four-decade high is something very, very different indeed. There is no good precedent. For stock investors, as for the Fed, it remains vital to watch the macro data — and then the bond market’s response. For this selloff to go much further with the economy expanding would require a financial accident as exceptional as the Black Monday crash, which was driven by a sudden and unprecedented breakdown in the risk-management systems of the time. Today’s macro conditions, however, do seem to be exceptional. (…)

U.S. Companies Face More Restrictions After Privacy Ruling Against Google American technology providers are under intense pressure in Europe after a regulator there found Google Analytics’ services illegal. The decision is expected to spur a domino effect that could result in similar restrictions for other U.S. tech providers.
The recent ruling means American companies beyond big tech firms will have more difficulties moving data from Europe to the U.S., and could lead to tougher scrutiny from privacy regulators of banks, airlines and other sectors, privacy experts say. (…)
Rulings on Google will have broad effects for U.S. companies that do business in Europe. “The big question is to what extent can we all use American services,” said Tobias Judin, head of the international section at the Norwegian data protection regulator. Mr. Judin’s office is also investigating two complaints into Google Analytics. Any company that sends data from Europe to the U.S., or is subject to the FISA law,would face the same legal challenges, he added. (…)
The growing restrictions on data transfers will make it more difficult for American tech companies to convince European business partners their data won’t be exposed to government authorities, Ms. Fennessy said. (…)
COVID-19
State of Affairs: Jan 31 Katelyn Jetelina
Well, case patterns continue to vary greatly across the world. For example, after reaching ridiculous heights, France and Australia are on the descent. Japan’s cases are gaining speed, and interestingly, U.K., Canada, and South Africa have stalled after their initial descent.
Denmark’s out-of-this world cases continue to increase. I thought this dramatic figure from John Burn-Murdoch at Financial Times was spot on; it also highlights that ICU rates are decreasing and deaths are about 50% of that of their last winter wave. With an 83% vaccination rate, Denmark decided to remove all COVID19 public health mitigation measures—which, as you can imagine, has caused quite the international debate.
The mix of case patterns across the world is likely attributed to BA.2 (the sister lineage of Omicron) taking hold. The WHO confirmed that investigating BA.2’s ability to induce severe disease and to escape prior immunity should be prioritized. Since my update last week, we’ve learned a little more about this sub-lineage:
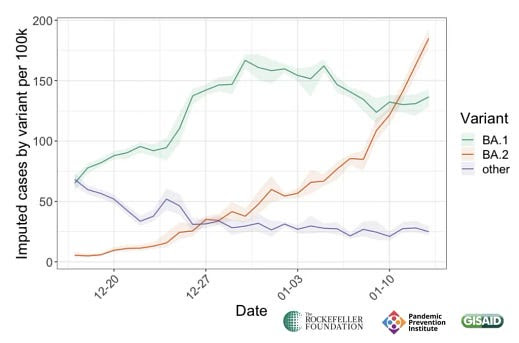
Transmissibility. We have consistent evidence that BA.2 outcompetes BA.1. In England, for example, BA.2 has a +126% growth rate over BA.1. Secondary attack rates in U.K. households are also higher: 13.4% of BA.2 cases transmitted within their households vs 10.3% of BA.1. The graph below, which displays the variant growth in Denmark, confirms a growth advantage. Importantly, as seen in a study of Denmark households, vaccination helped protect against transmission more for BA.2 than BA.1.
(Chart from Pandemic Prevention Institute Here)
Immunity escape. We have preliminary evidence that vaccines continue to work great against BA.2. In fact, they work a little better than against BA.1. The U.K. Health Security Agency released a report last Friday suggesting vaccine effectiveness against symptomatic disease was 70% for BA.2 compared to 63% for BA.1. This is great news.
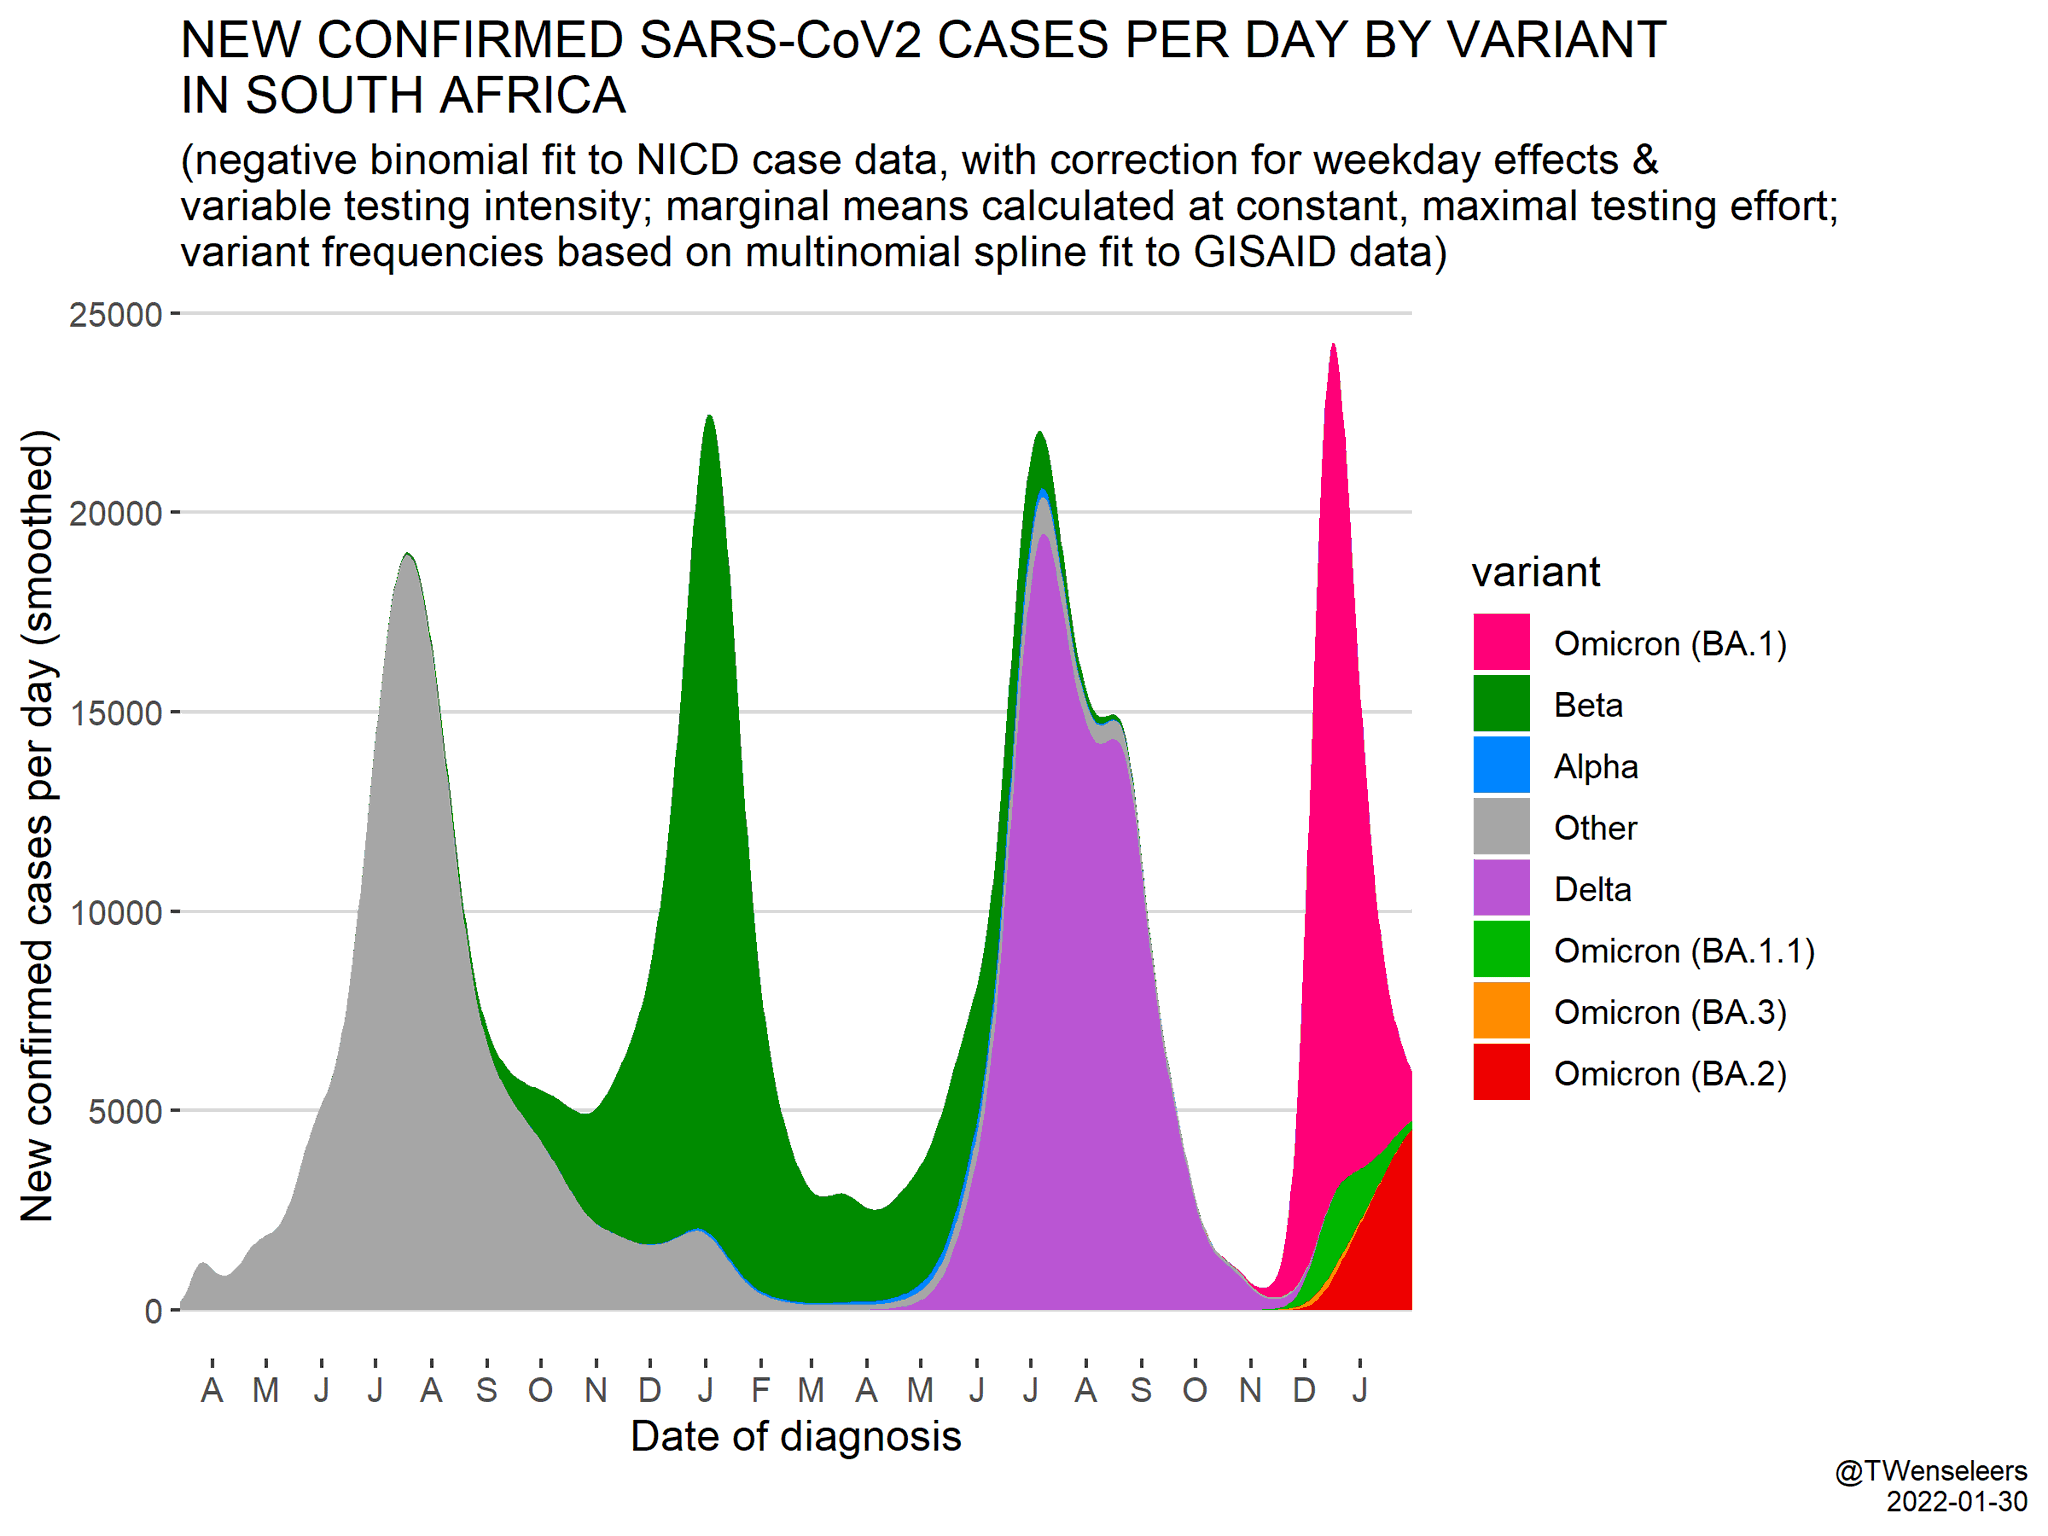
So, BA.2 means that we’ll likely see a prolonged Omicron wave across many countries. For example, in South Africa cases are due to start increasing because BA.2 is taking hold. How much cases increases, though, will be important to closely follow over the next few weeks.
(Tom Wenseleers Twitter)
In the United States, cases and test positivity rates continue to decline. Because both metrics are mirroring each other (rather than showing opposite trends), I’m confident this is the “true” trend and not a testing capacity or testing behavior phenomenon. The raw number of cases, though, continues to be greatly underreported. Because of the massive blizzard in the Northeast, numbers may be off this upcoming week due to delayed testing, closed labs, and people staying home.
(CDC)
The case trend seems to be consistent across all U.S. regions. In fact, there are only 10 states with case growth right now, with Montana (+79%), Washington (+55%), and Idaho (+46%) as the leaders. But even the leaders have less than impressive growth compared to at the beginning of the Omicron wave when we were reaching 4-digit percentage increases.
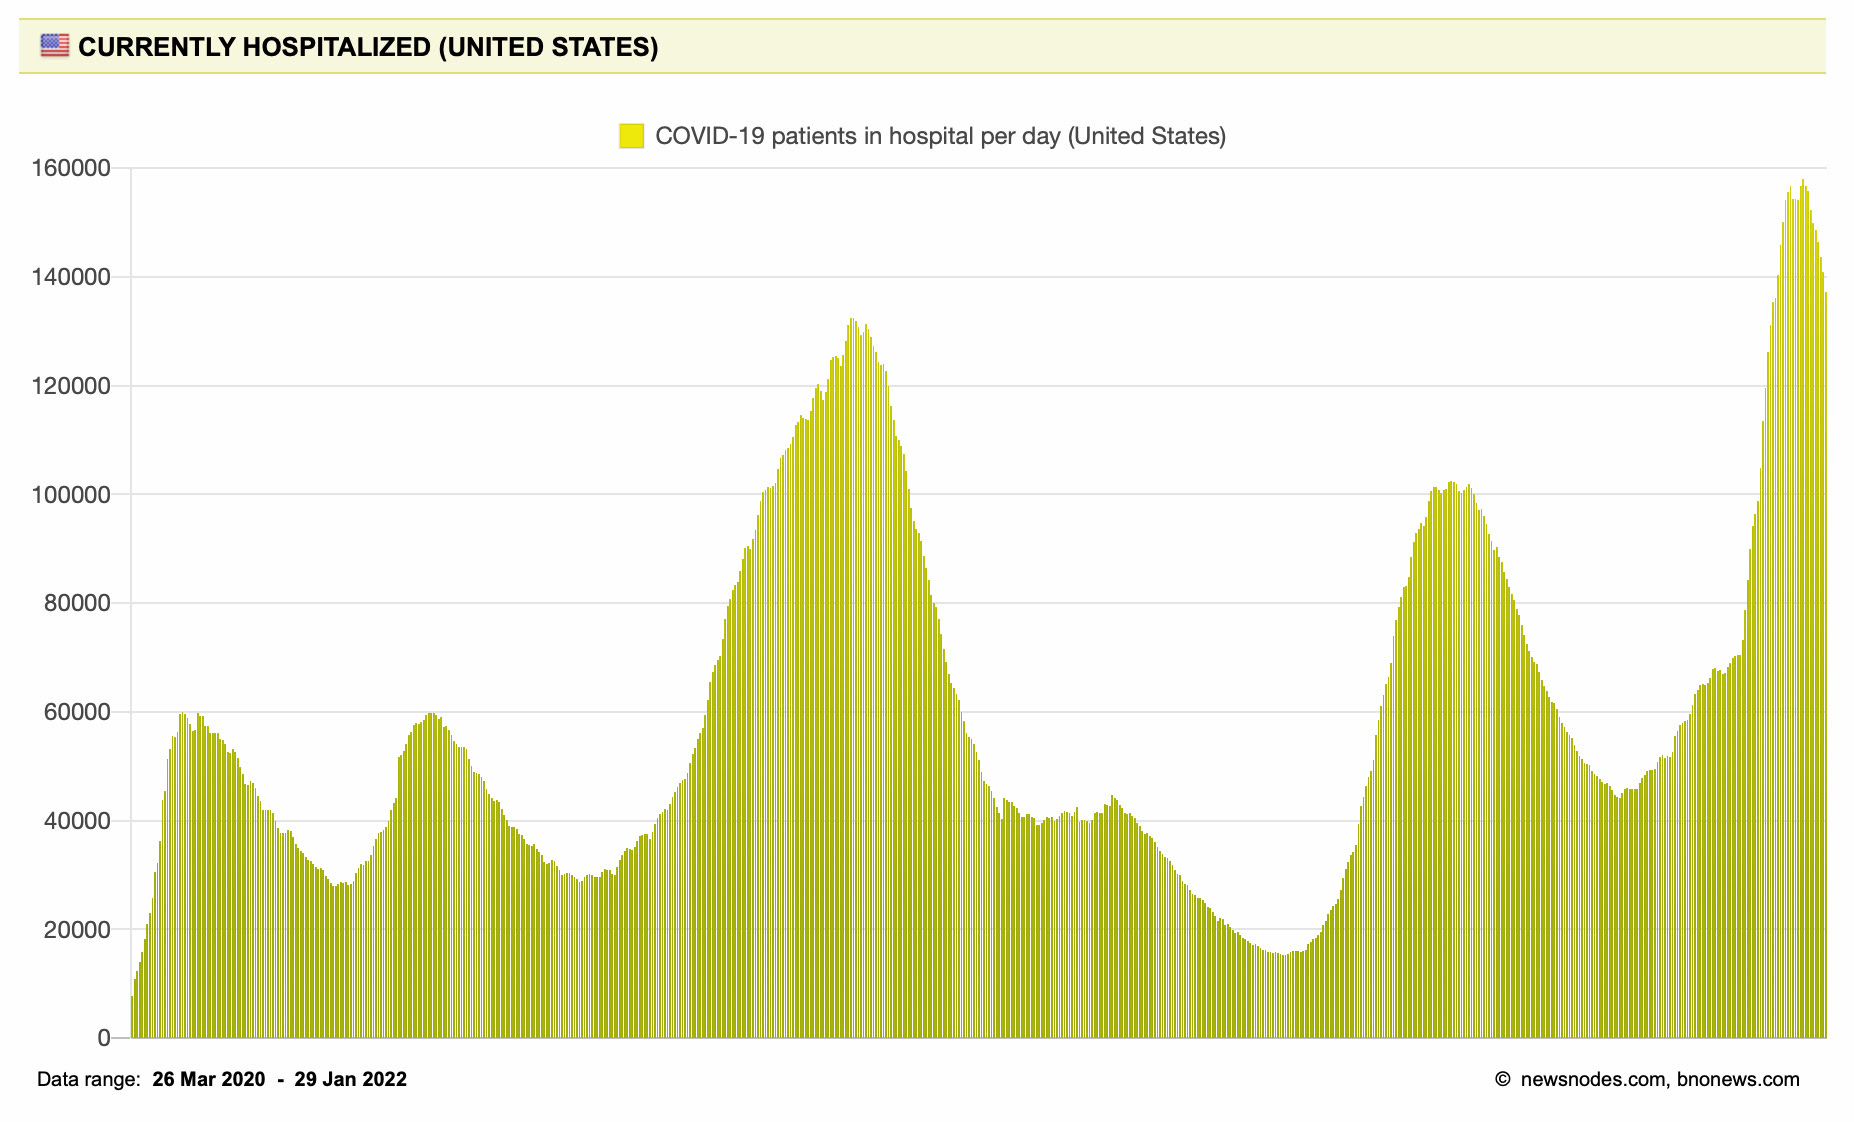
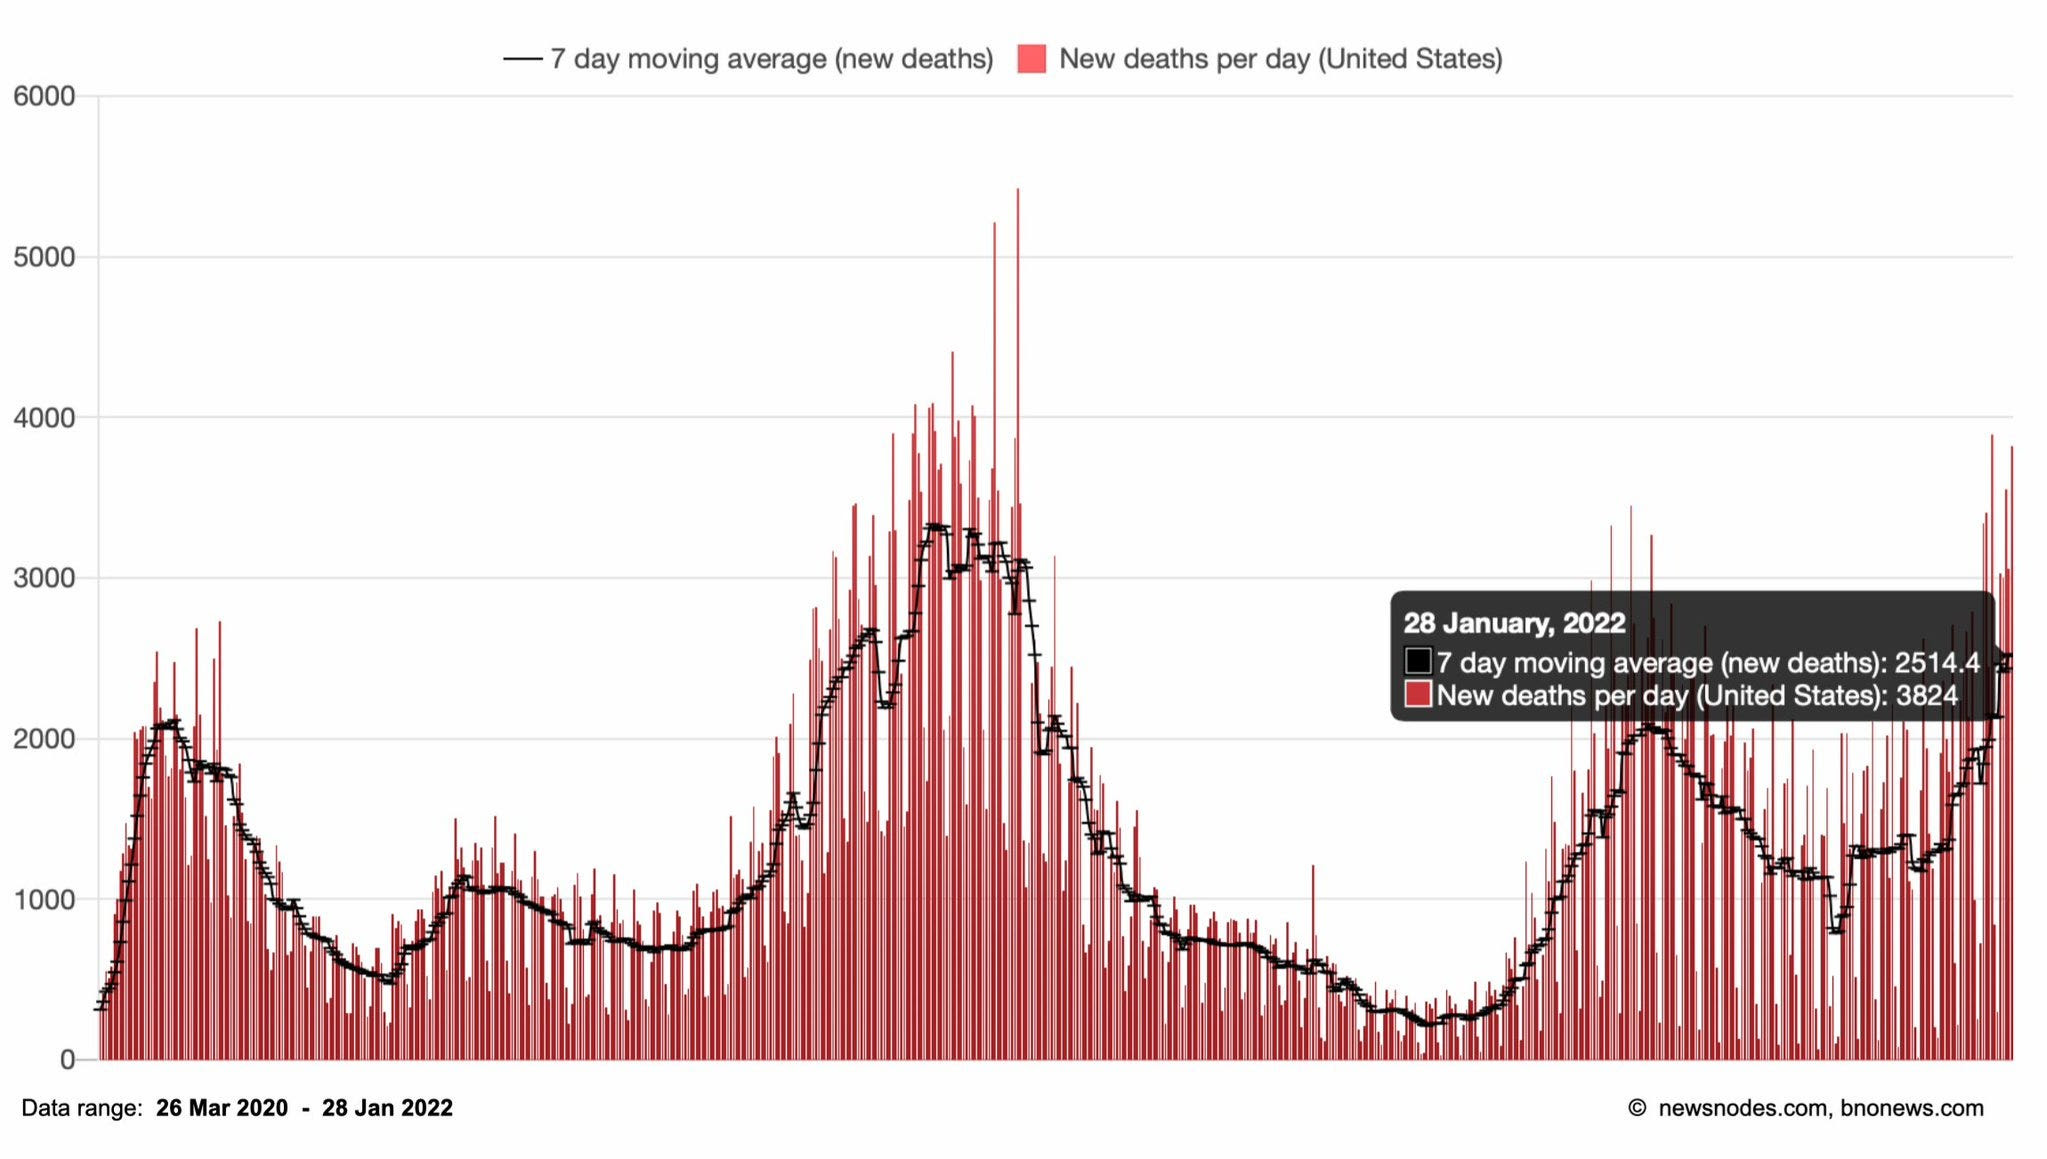
Unfortunately, hospitalizations and deaths continue to lag cases. And while hospitalizations continue to decline, they are still very high at 146,787 people hospitalized. This means we are still above last winter’s hospitalization peak. Deaths haven’t peaked yet and have increased 29% in the past 14 days. Last Friday, we recorded 3,824 deaths in. one. day. On average, we are losing 2,572 people per day.
Thanks to immunity, treatment, and an intrinsically less severe Omicron, the case fatality rate (CFR) continues to decline in the Untied States and across the globe. We’re seeing a similar pattern in infection fatality rate (IFR— which takes into account asymptomatic and non-reporting) in the U.K. But, as seen in the second graph below, IFR is still about two times higher than the flu. (Keep in mind this means U.S.’s IFR is about two times higher than the U.K.’s). Even though COVID19 is getting less and less lethal on an individual-level, COVID19 is also getting more and more transmissible. In places like the U.S. with suboptimal vaccination breadth and depth, the two are essentially cancelling each other out and COVID19 continues to make a big impact on population-level metrics, like death.
In the United States, 67.7% of people aged 5+ have the primary series (63.7% of the total population). And, as we’ve seen in previous waves, Omicron’s silver lining was that more people got their first dose. This uptick was modest; the Kaiser Family Foundation reported only 8% of unvaccinated adults said Omicron made them more likely to get vaccinated. We are inching closer and closer to vaccination saturation. Yet vaccination rates continue to be disproportionately spread across a variety of sociodemographic groups.
Among those who are vaccinated, only 41.3% are boosted. Even more worrisome to me is that only 64% of Americans 65+ years have a booster, as they are more likely to have severe breakthrough cases than younger populations. The number one reason people aren’t boosted is because they “don’t need it/don’t feel at risk from COVID” followed by “ineligible (hasn’t been long enough since last shot)” and “don’t think it will be effective.” But the story continues to be clear: Boosters do help against infection, hospitalization, and death. But certainly not as much as getting vaccinated in the first place.