U.S. Readies Final China Trade Deal as Hawks Urge Caution
The U.S. is eyeing a summit between the two presidents as soon as mid-March, said one of the people, who spoke on condition of anonymity because the preparations are confidential. (…)
“Speaking of China we’re very well on our way to doing something special. But we’ll see,” Trump said at a press conference in Hanoi on Thursday. “I am always prepared to walk. I’m never afraid to walk from a deal, and I would do that with China, too, if it didn’t work out.” (…)
Treasury Secretary Steven Mnuchin said on Thursday the two nations are working on a 150-page
document that would turn into a “very detailed agreement,” though he cautioned that “we still have more work to do.” (…)
“The progress has been terrific,” Kudlow, director of the White House’s National Economic Council, said in an interview on CNBC. “We have to hear from President Xi and the Politburo of course, but I think we’re headed toward a remarkable historic deal.” (…)
RECESSION WATCH
The BEA today released some key stats on the U.S. consumer. Unfortunately, visibility and dependability are still suffering from the shutdown.
Due to the recent partial government shutdown, this report combines estimates for December 2018 and January 2019. December estimates include both income and outlays measures, while January estimates are limited to personal income. Estimates of outlays for January are unavailable due to a delay in the release of the Census Bureau’s Advance Monthly Retail Sales.
Real consumption expenditures are reported down 0.6% MoM in December, supporting the already reported weak retail sales. However, real disposable income was measured up a huge 1.0% MoM in December.
The increase in personal income in December primarily reflected increases in personal dividend income, compensation of employees, and farm proprietors’ income. Personal dividend income increased $83.4 billion, primarily reflecting a one-time special dividend payment by VMware Incorporated
Is VMW that widely held?
If these numbers are close to the reality, Americans substantially boosted their savings at year-end. Really? Why? The data-dependent Fed, and us all, will remain in the dark a little longer on the state of the all-important consumer sector. 
-
Jobless Claims Rose in Mid-February The number of Americans filing applications for new unemployment benefits increased last week.
Initial jobless claims, a proxy for layoffs across the U.S., rose by 8,000 to a seasonally adjusted 225,000 in the week ended Feb. 23, the Labor Department said Thursday. (…) The four-week moving average of claims, a steadier measure, declined to 229,000. (…)
David Rosenberg’s concerns about “forward-looking initial claims” must be alleviated by claims coming back into the 2018 channel after the shutdown:

U.S. Economy Grew 2.6% in the Fourth Quarter The economy completed one of the best years of a nearly decadelong expansion, growing at a modest pace despite turbulent markets, uncertainties about trade with China and a government shutdown in late December.
The dependence on the consumer was most evident in the last quarter:

Tax Refunds Bounce Back After Slow Start Average tax refunds rebounded after a weak start to the tax-filing season, according to Internal Revenue Service data released Thursday that was highlighted by Treasury Secretary Steven Mnuchin.
The average tax refund was $3,143 through Feb. 22, a 1.3% increase from the same period last year. Before that, average tax refunds had been running behind last year’s pace. Through Feb. 22, about 81% of tax returns that have been processed are yielding refunds, nearly identical to last year. (…)
THE PMIs
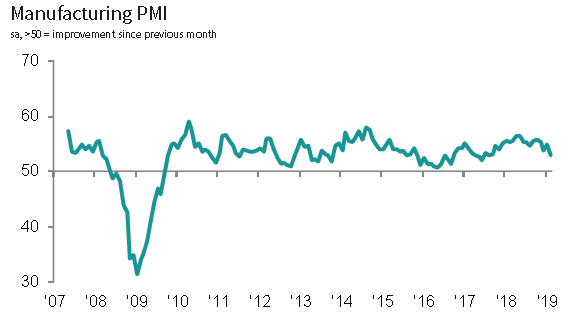
U.S. PMI dips to 18-month low in February
February data signalled a softer, but still solid, improvement in operating conditions across the U.S. manufacturing sector. The headline PMI slipped to its lowest since August 2017 amid slower expansions in output and new orders. Notably, the increases were slower than their respective long-run trends, with growth rates dipping to 17- and 20-month lows, respectively. Meanwhile, foreign client demand continued to rise marginally. A sustained upturn in new orders led to a further rise in employment, with backlogs also increasing.
At the same time, inflationary pressures softened in February. Rates of both input price and output charge inflation eased from January, with the former edging down to an 18-month low.
The seasonally adjusted IHS Markit final U.S. Manufacturing Purchasing Managers’ Index™ (PMI™) posted 53.0 in February, down from 54.9 at the start of the year. Midway through the first quarter of 2019, manufacturing firms indicated a solid, albeit softer, improvement in the health of the sector, with the index registering its lowest level for 18 months.
Production increased further in February, albeit at a slower pace. Panellists reported that the upturn stemmed from a sustained expansion in new business and efforts to clear backlogs. That said, the rise in output was modest overall, with growth the softest since September 2017 and below the long-run trend.
Similarly, new business received by manufacturers expanded at a slower rate in February. The modest upturn was the weakest since June 2017. Although panellists stated that firmer client demand drove the latest increase, some firms noted that longer lead times were pushing clients to find alternatives. Foreign client demand, however, continued to increase. Though marginal, the rise in new export orders quickened since January.
On the price front, input cost inflation eased to an 18-month low in February. The increase in purchasing prices was nevertheless sharp, reflecting higher raw material costs and tariffs. Factory gate prices rose solidly, albeit at the second slowest rate since December 2017.
The rate of job creation was faster than the series trend in February, with firms raising their workforce numbers solidly. Pressure on capacity was exhibited by another monthly rise in backlogs of work. Although only fractional, the latest increase extends the current sequence of order book accumulation to 19 months.
A slower rise in new business reportedly led to softer growth in buying activity. Growth in pre-production inventories also eased in February as stocks of inputs were used in production.
Finally, expectations towards the one-year outlook for output remained positive in February. Panellists were buoyed by forecasts of further upturns in new business. That said, the degree of confidence slipped to the second-lowest since November 2016 (behind December 2018).
The survey exhibits a strong advance correlation with comparable official data, and suggests that factory production and orders growth rates are close to stalling mid-way through the first quarter, albeit in part representing some pay-back after a strong January. Export markets remained the principal drag on order books.
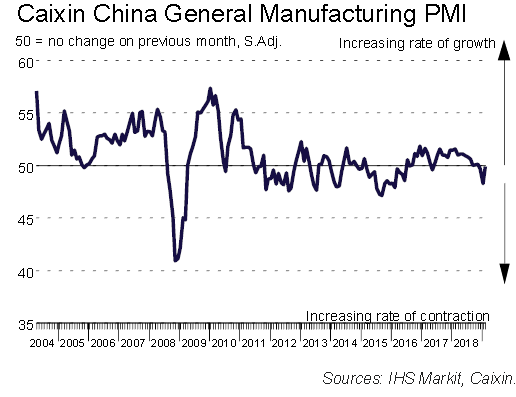
Chinese production expands slightly in February
Operating conditions faced by Chinese manufacturers were broadly stable in February. Encouragingly, both output and total new orders expanded slightly, despite export sales slipping back into contraction. At the same time, capacity pressures continued to build, with backlogs of work rising further. However, efforts to contain costs contributed to a further decline in employment and inventories. At the same time, a relatively subdued demand outlook weighed on purchasing activity, while confidence towards the year-ahead edged down slightly. Prices data meanwhile showed that average input costs fell for the third month in a row, but prices charged rose slightly.
The headline seasonally adjusted Purchasing Managers’ Index™ (PMI™) registered only fractionally below the neutral 50.0 mark at 49.9 in February, to signal broadly stable operating conditions. Notably, the reading was up from January’s recent low of 48.3, to mark its highest level in three months.
February survey data signalled a renewed increase in Chinese manufacturing production. Though marginal, the expansion contrasted with a modest reduction at the start of the year. A number of panellists raised output due to firmer client demand, as total new orders also rose slightly during February. Data indicated that the upturn was predominantly driven by greater domestic demand, as new export orders fell marginally.
The subindex for new orders returned to expansionary territory in February after staying in contraction for two months. Despite slipping back into contractionary territory following a rise the month before, the gauge for new export orders hit its second highest level since March 2018. Domestic manufacturing demand improved significantly, and foreign demand was not deteriorating as quickly as last year.
The measure for stocks of finished goods fell further into negative territory, and reached its lowest level since May 2016.
The level of outstanding work at Chinese goods producers rose for the thirty-sixth month running in February. The rate of accumulation was similar to those seen in recent months and modest. Signs of sustained pressure on operating capacity occurred alongside a further fall in staffing levels.
Relatively soft demand conditions led manufacturers to reduce their purchasing activity for the second month in a row. At the same time, plans to streamline costs contributed to further falls in inventories of both purchased items and finished goods.
Supply chains remained under pressure in February, as shown by a second successive monthly deterioration in vendor performance. Though modest, lead times increased to the greatest extent for eight months.
Average purchasing costs fell in February, albeit at the weakest rate in the current three-month sequence of reduction. Some panellists linked the decline to lower raw material prices. In contrast, output charges increased midway through the opening quarter of the year. Though marginal, it was the first time that selling prices had risen since last October.
Businesses were generally confident that output would rise over the next 12 months in February. However, the degree of optimism slipped slightly from January’s eight-month high. Positive projections were often linked to new products, increased investment and expectations that market conditions will improve.
Overall, with the early issuances of local governments’ special-purpose bonds and targeted adjustments to monetary policy, the situation in the manufacturing sector recovered markedly in February due to the effect of increased infrastructure investment.
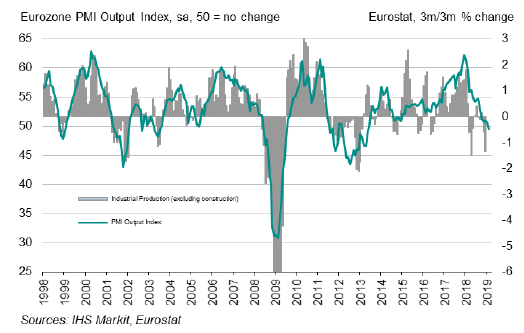
Eurozone manufacturing sector contracts in February
There was a deterioration in eurozone manufacturing operating conditions during February as signalled by the IHS Markit Eurozone Manufacturing PMI® slipping below 50.0 for the first time since June 2013. After accounting for seasonality, the PMI recorded 49.3, down from 50.5 in January. Although slight, the contraction signalled in February ended a run of growth in the manufacturing economy that had stretched to over five-and-a-half years.
IHS Markit Eurozone Manufacturing PMI
By market group, weakness was again most apparent in the intermediate and investment goods sectors. Both recorded deteriorations in operating conditions compared to the previous month. In contrast, consumer goods continued to expand, albeit at a modest pace that was the weakest seen since July 2016.
By country, the weakest performers were Germany and Italy. The PMI for Germany slipped further below the 50.0 no-change mark to record a 74-month low in February, whilst Italy saw its manufacturing PMI record its lowest level in nearly six years. Although marginal, Spain also saw a deterioration in operating conditions for the first time since November 2013. Meanwhile, growth improved slightly in France, but remained historically weak, whilst there were deteriorations in growth seen in Austria and the Netherlands. (…)
Output was undermined by the sharpest fall in new work received since April 2013. A challenging international climate, characterised by political and trade uncertainties, meant that export orders fell a fifth successive month and to the greatest degree for over six years. The new orders to inventory ratio has also fallen to its lowest since 2012, with many companies reporting excess warehouse stocks.
Despite the marginal fall in output, evidence of spare capacity in the manufacturing economy continued to build. Backlogs of work declined for a sixth successive month and to the greatest degree since April 2013. Inventories of finished goods were also higher for a fifth successive month, albeit only slightly and to a considerably lesser degree than the survey record seen at the start of the year.
Although production, new orders and backlogs all continued to fall, manufacturers continued to take on workers at a solid pace during February. Employment growth has now been sustained in each month since September 2014, with Germany recording the strongest growth followed by Greece and Ireland. In contrast, only marginal jobs gains were seen in Italy and Spain.
Meanwhile, input price pressures continued to weaken during February. Led by lower prices paid for oil-based products and reducing supply-side constraints (average lead times lengthened only marginally), input costs rose to the slowest degree in since October 2016. A similar trend was seen for output charges, which increased at the weakest rate since the end of 2016. (…)
Finally, the deepening downturn in new work, plus worries over domestic political and international trade developments, continued to weigh on expectations during the latest survey period. Overall business confidence dipped on January’s four-month high and was amongst the weakest seen in the past six years.

Remember that the ECB has no dry powder while some $11T of eurozone sovereign debt yields below zero…Draghi is retiring with his “whatever it takes” on Oct. 31. 2019.
Japan manufacturing production declines at fastest rate since May 2016
Japanese goods producers recorded a sharper downturn in output during February, while new order intakes declined at a quickened pace. As a result, the headline PMI dipped into contraction territory for the first time in two-and-a-half years. New export business also continued to decline amid lower sales to China. As a result, output charges were raised at a slower rate and businesses pared back their output expectations for a ninth successive month.
On the upside, employment increased, input costs rose at the softest pace in 16 months and efficiency gains at suppliers helped delivery times broadly stabilise.
The headline Nikkei Japan Manufacturing Purchasing Managers’ IndexTM (PMI)® pointed to the first contraction in the Japanese manufacturing economy since August 2016 during February. The headline figure fell to 48.9, from 50.3 in January, the lowest in 32 months.
Latest survey data showed a second straight monthly decline in production volumes at Japanese manufacturers. The contraction was moderate, but the most pronounced since May 2016. Panellists linked the fall in output to reduced new order intakes. Deteriorating demand conditions were signalled in the February PMI survey. New work placed with Japanese goods producers dropped at the fastest rate in over two-and-a-half years. Furthermore, the decrease in order books was broad-based across both domestic and foreign markets, with falling new export sales also recorded. Although overseas orders fell at a slower rate than in January, it was the second-sharpest decline for two-and-a-half years.
Intensified downturns in demand and output coincided with a further easing of business confidence in February. Future output expectations were pared back for the ninth month running, leading sentiment to fall towards broadly neutral territory. Global trade frictions, downbeat demand forecasts and the impending consumption tax hike were cited as risks to the outlook.
(…) Backlogs of work declined at the sharpest rate in 32 months.
Elsewhere, input lead times were close to stabilising in February amid reports of efficiency gains at suppliers. Vendor performance deteriorated only marginally. Reduced purchasing activity also helped ease pressure on supply chains. Input buying fell at the quickest rate since July 2016. Cost burdens continued to rise in February, with raw materials, labour and transport mentioned as sources of inflation. The increase was marked, but the softest in 16 months. As a result, firms were able to raise output prices at a slower pace.

China’s Domestic Slowdown Drives Global Trade Slump
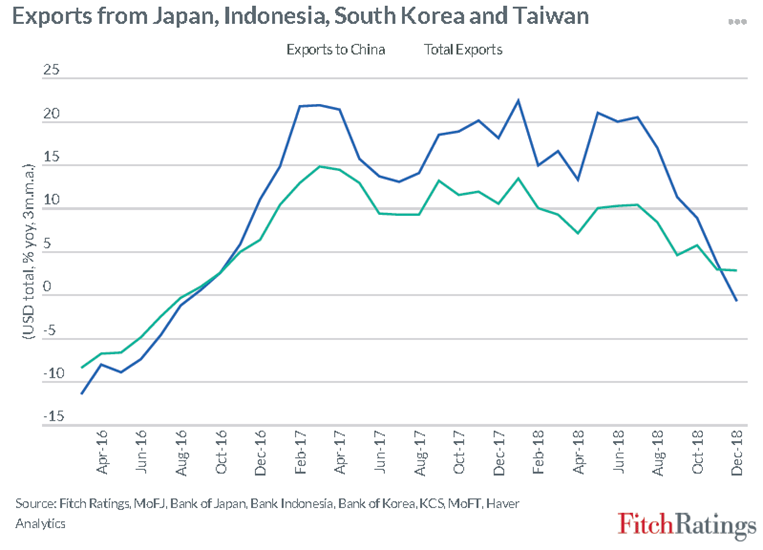
The recent pattern of trade flows in Asia suggests that the sharp decline in world trade growth in the second half of 2018 was primarily due to the slowdown in domestic demand in China rather than the direct impact of tariffs associated with increased US-China trade tensions.
The Fitch Ratings economics team’s latest chart of the month shows that exports to China from a selection of other large economies in Asia have slowed much more sharply than their overall exports. Since intra-Asian trade flows are much less likely to have been affected by the tariff measures imposed by the US and China, this points to weakening domestic demand in China as a key driver of the slowdown. China’s year-on-year import growth (in nominal US dollar terms) turned negative at the end of 2018, despite rising import prices. This was the first decline since 2016 and reflects a slowdown in domestic investment and private consumption.

The US and the Eurozone have also seen their export growth to China falling more rapidly than total exports. Germany in particular has been hit hard by declining auto sales in China, although, for the Eurozone as a whole, exports have also been affected by declining sales in the UK and Turkey. US exports to China have fallen very sharply in recent months but these bilateral flows have been distorted by tariff measures, including possible front-loading of trade flows in mid-2018 ahead of anticipated further tariff hikes and the subsequent payback. The evidence from Asia suggests the outlook for Chinese domestic demand will be a key driver of global trade in 2019.
Keep in mind, however, that 32% of China exports are re-exports.
EARNINGS WATCH
After 475 reports, the beat rate stands at 69% and the surprise factor at +3.3%. The blended growth rate for Q4 has increased to 16.7%.
Trailing EPS have reached $162.92, still well above the expected $161.64 full year 2018 EPS.
SENTIMENT WATCH
The bears went back in hibernation…
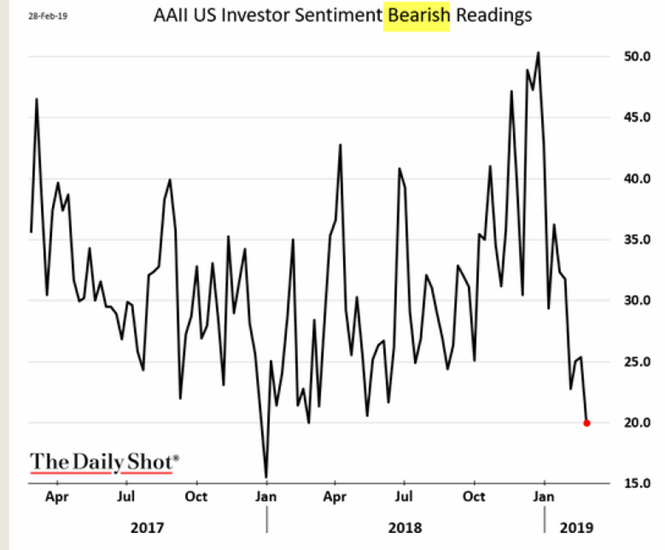
Ned Davis Research’s sentiment gauges are also flashing red (via CMG Wealth):
- NDR Crowd Sentiment Poll: Extreme Optimism (S/T Bearish for Equities).
- NDR Daily Trading Sentiment Composite: Extreme Optimism (S/T Bearish for Equities).
HISTORICAL CHARTS
For your records, these long-term Moody’s charts:
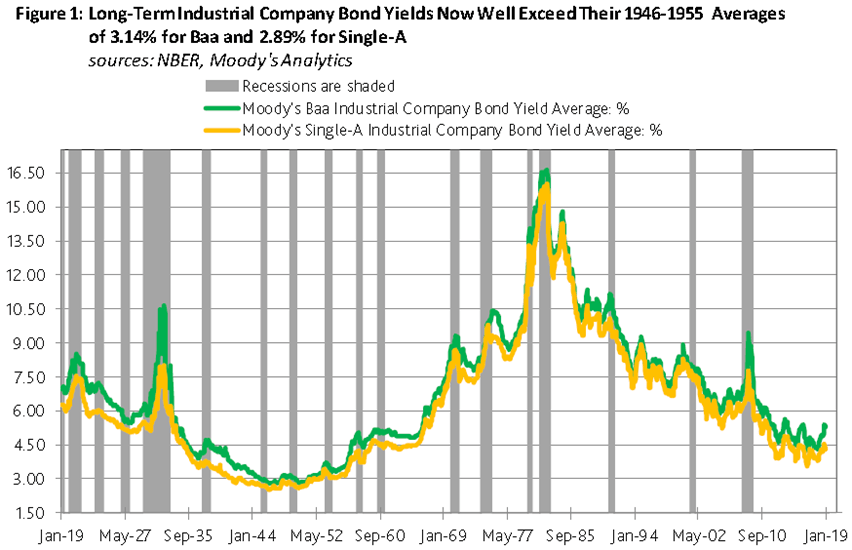
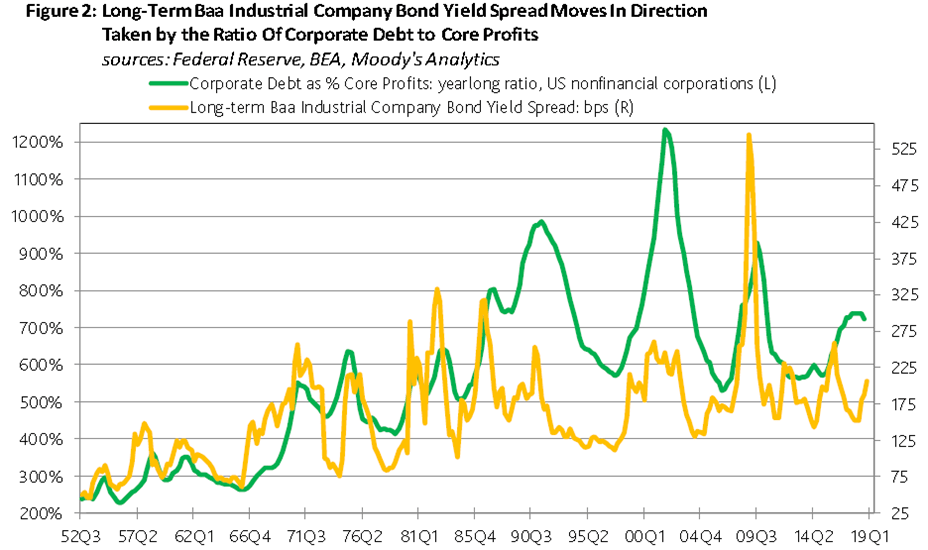
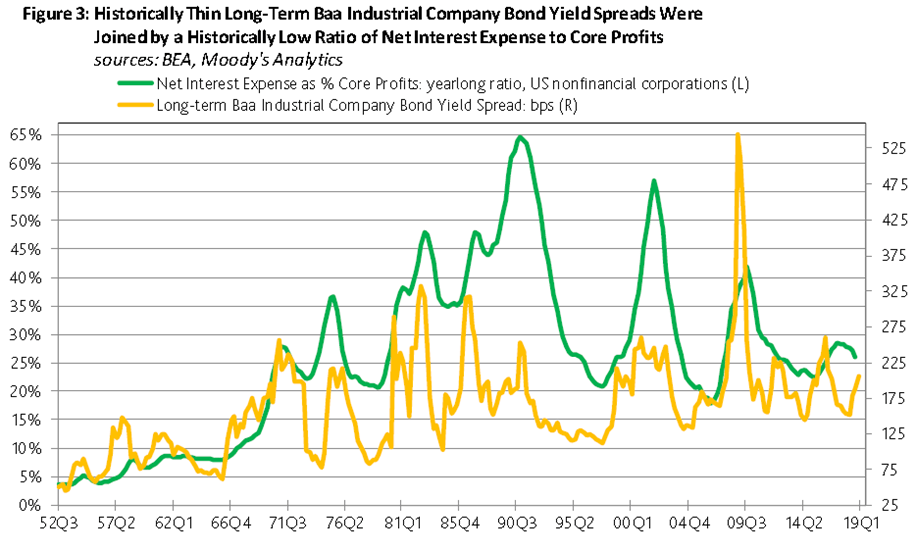
The medians of the now 100-year sample are 5.71% for the single-A industrial yield, 6.36% for the Baa industrial yield, 105 bp for the single- A yield spread, 167 bp for the Baa yield spread, and 83 bp for the difference between the Baa and single-A yields. Currently, both the single-A and Baa industrial company bond yield spreads exceed their long-term medians, while the latest gap between the Baa and single-A yields practically matches its 100-year midpoint. By contrast, both the single-A and Baa industrial yields are now well under their 100-year medians. In terms of month-long averages, the single-A industrial yield was last as high as 5.71% on April 20, 2010, while the Baa industrial yield was last at 6.36% on April 9, 2010.
POST TRUMP
International enrollment at US graduate schools (The Daily Shot)

Source: WSJ.com, h/t Paul Menestrier; Read full article