Gains in U.S. Jobs Strengthen Outlook Employers added 225,000 jobs in January and the jobless rate ticked up to 3.6%, signs the U.S. labor market is positioned to fuel economic growth in 2020. Economists had forecast job gains of 158,000.
Wages climbed 3.1% from a year earlier, a touch stronger than December’s rise of 3%. Wage growth for rank-and-file workers cooled to 3.3% in January, down from a recent peak of 3.8% in October. (…)
Some of the January job gains came in industries, such as construction and leisure and hospitality, that benefited from mild winter weather. Still, employers across an array of sectors added jobs. That helped lift monthly payroll growth for the past three months to an average of 211,000 jobs, compared with an average of 175,000 for all of last year. (…)
In January, the share of Americans aged 25 to 54 working or looking for work ticked up to 83.1% from 82.9% in December, the highest rate since 2008. (…)
-
Americans Joining Workforce at Record Rate Nearly three of four Americans who became newly employed in recent months came from outside the labor force
That is the highest ratio in three decades of records and helps explain how employers have consistently added jobs without stoking stronger wage growth. (…)
These new entrants are helping push the share of Americans in their prime working years—age 25 to 54—who are employed or seeking work back to near prerecession levels. Labor-force participation for that group has increased by a full percentage point in the past six months to 83.1% in January, the highest rate since September 2008 but still below the record high of 84.6% reached in 1999. (…)
Overall a pretty good job report with the 3 month average at 211k vs the 6 month average of 206k and a 2019 average of 175k, a 2018 average of 193k and a 2017 average of 176k.
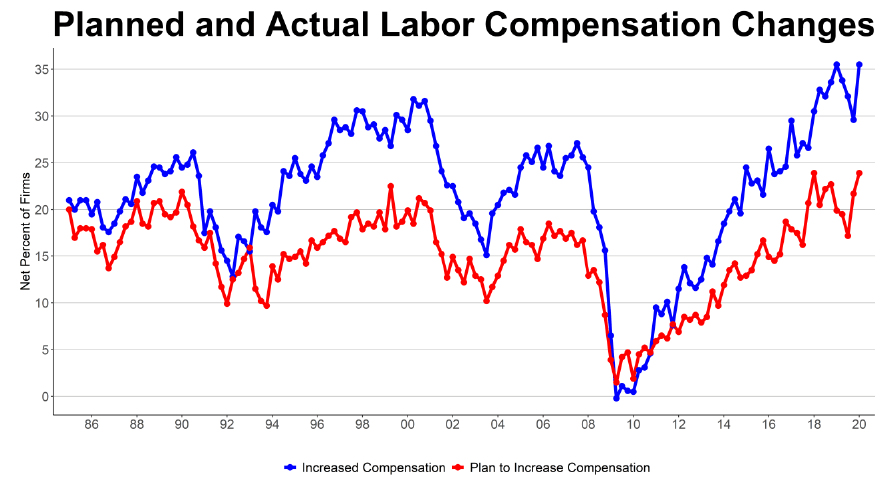
The latest NFIB job report was also upbeat on hiring and wages:

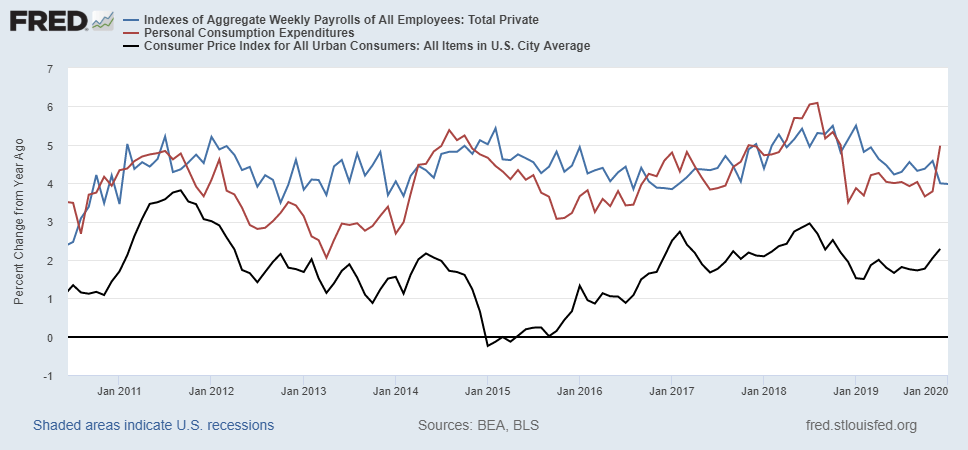
The combination of employment growth with the change in hours worked and hourly wages, the Payroll Index, was up 4.0% YoY in January, unchanged from December but down from +5.5% in January 2019. Given the strong correlation with consumer spending, we can anticipate that growth in the latter will slow do the 4% range in Q1, roughly 2.0% real.
 (AAR)
(AAR)
 (AAR)
(AAR)Canada’s job market blows past forecasts in January, unemployment rate falls
The country added 34,500 positions in the month, Statistics Canada said Friday in its Labour Force Survey (LFS), nearly double the consensus estimate of 17,500 new jobs. The unemployment rate ticked down to 5.5 per cent, just shy of tying a record low.
With January’s gain, the labour market has recouped its losses from a sluggish second half of 2019, when hiring slowed considerably from a scorching pace to start the year. More than 60,000 jobs have been created over the past two months, suggesting recent economic weakness hasn’t spooked employers from adding to their headcounts.
Moreover, average hourly wages for permanent employees rose by a lofty 4.4 per cent from a year ago. (…)
All the new jobs were in full-time positions, and nearly 50,000 positions were created in goods-producing industries, with particular strength in manufacturing (20,500) and construction (15,800). (…)
Falling Rates Could Boost Mortgages Ahead of Spring Selling Season The average rate on a 30-year fixed-rate mortgage is at 3.45%, the lowest in more than three years, potentially boosting the U.S. housing market as it enters the crucial spring selling season.
(…) The reduced rates widen the pool of homeowners who could lower their monthly payments. Mortgage-data firm Black Knight Inc. estimates that 11.3 million U.S. homeowners would qualify for and benefit from a refinancing, the second-most on record. Average monthly savings would be $268. (…)
U.S. Home Prices Rose 3.4% in January as Supply Fell to Eight-Year Low
Compared to January 2019, national housing inventory declined 13.6%-the largest fall in more than four years-to the lowest level since realtor.com began tracking the data in 2012.
As a result of a supply shortage, sellers were upping their asking prices. The median listing price in January was $300,000, a 3.4% increase year-over-year.
The largest decline in terms of inventory was at the entry-level market, or homes priced under $200,000, where listings dropped 19% year-over-year. The supply of upper-tier properties, priced at more than $750,000, declined 5.9% annually. The remainder of the market saw a 12% decrease in supply year-over-year, according to the report. (…)
EARNINGS WATCH
From Refinitiv/IBES:
Through Feb. 7, 322 companies in the S&P 500 Index have reported earnings for Q4 2019. Of these companies, 70.5% reported earnings above analyst expectations and 18.9% reported earnings below analyst expectations. In a typical quarter (since 1994), 65% of companies beat estimates and 20% miss estimates. Over the past four quarters, 74% of companies beat the estimates and 19% missed estimates.
In aggregate, companies are reporting earnings that are 5.3% above estimates, which compares to a long-term (since 1994) average surprise factor of 3.3% and the average surprise factor over the prior four quarters of 4.9%.
Of these companies, 65.9% reported revenue above analyst expectations and 34.1% reported revenue below analyst expectations. In a typical quarter (since 2002), 60% of companies beat estimates and 40% miss estimates. Over the past four quarters, 58% of companies beat the estimates and 42% missed estimates.
In aggregate, companies are reporting revenue that are 1.1% above estimates, which compares to a long-term (since 2002) average surprise factor of 1.5% and the average surprise factor over the prior four quarters of 1.0%.
The estimated earnings growth rate for the S&P 500 for 19Q4 is 2.3%. If the energy sector is excluded, the growth rate improves to 5.1%. The estimated revenue growth rate for the S&P 500 for 19Q4 is 5.0%. If the energy sector is excluded, the growth rate improves to 6.2%.
This last number is remarkable: while nominal GDP growth slowed from 4.6% to 4.0% from Q1 to Q4, S&P 500 revenue growth ex-Energy held up at 6.2%, well above inflation and wage growth rates.
The estimated earnings growth rate for the S&P 500 for 20Q1 is 4.0%. If the energy sector is excluded, the growth rate declines to 3.7%.
TECHNICALS WATCH
Lowry’s Research reviews potentially negative short-term trends in Supply/Demand and Adv-Dec Lines but concludes that “the forces of Supply and
Demand support a healthy bull market with
months more to run. Thus, there is little reason
to deviate from a fully invested position.”
Nasdaq hits records, but more than half of stocks are still in bear market
SentimenTrader dug into that story, noting that
Even with the rebound in shares this week, there are still 52% of Nasdaq stocks that are more than 20% below their highs. More than 69% of stocks are at least 10% off their highs.
That has preceded some trouble in the past. Over the past 15 years, there was a total of 53 dates when the Composite closed at a 52-week high but more than 50% of stocks were in bear markets and more than 65% in corrections.
(…) this was a mostly negative factor in the months ahead. The S&P 500 fared even worse, with only a 34% win rate over the next 3 months. Seems like at least a minor warning sign.

 A Do-it-yourself (DIY) Valuation of Tesla: Of Investment Regrets and Disagreements!
From Aswath Damodaran, Professor of Finance at the Stern School of Business at NYU.