Traveling in Peru, posting is more limited.
CPI Strengthens With Higher Energy Costs; Core Prices Are Tame
The Consumer Price Index increased an expected 0.4% during March following a 0.2% February rise. It was the largest monthly increase since January 2018. The 1.9% y/y increase compared to a 2.9% y/y high last July. The CPI excluding food & energy improved 0.1% for a second consecutive month. A 0.2% gain had been expected. The 2.0% y/y rise was the weakest since February 2018 and was below the 2.4% July peak.
Higher energy prices strengthened the gain in the overall CPI. Their 3.5% jump (-0.4% y/y) was the largest since September 2017 and followed declines during four of the last six months. (…) Food prices also were strong last month as they improved 0.3% (2.1% y/y) after a 0.4% rise. (…)
Service prices improved 0.3% (2.7% y/y) following five consecutive months of 0.2% increase. Shelter costs rose an accelerated 0.4% (3.4% y/y) as the cost of lodging away from home jumped 0.8% (2.9% y/y). Rents of primary residences increased 0.4% (3.7% y/y) and the owners’ equivalent rent of primary residences gained a steady 0.3% (3.3% y/y). (…)
Weighing on the gain in the overall CPI was a second consecutive 0.2% decline (-0.0% y/y) in core goods prices. (…)
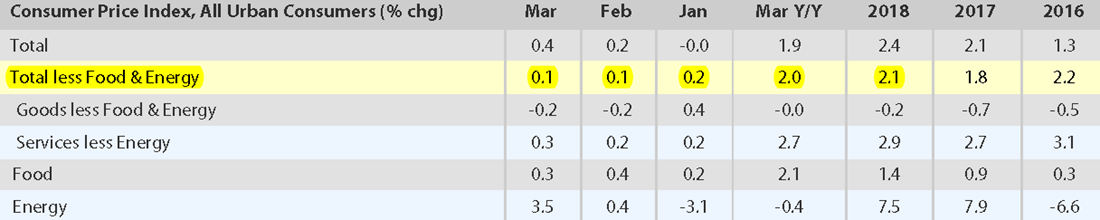
Last 3 months annualized: core CPI: +1.2%, core Goods: 0.0%.
U.S. JOLTS: Job Openings and Hiring Diminish
The Bureau of Labor Statistics reported that the total job openings rate declined to 4.5% during February, its lowest level since March 2018. The job openings rate is the job openings level as a percent of total employment plus the job openings level. Finding workers to fill openings just became more difficult. The hiring rate eased to 3.8% and has been moving sideways for about a year. Employers became a little less hesitant to let people go. The layoff & discharge rate rose from the record low to 1.2%. And with jobs plentiful, workers remained ready to seek out new positions. The quits rate held steady at a near-record 2.3%. The JOLTS data begin in 2000.
The private-sector job openings rate declined sharply to 4.8%, the lowest level since March of last year. In leisure & hospitality, the rate dropped to a roughly one-year low of 5.5%. In professional & business services it eased to 6.3%, but remained up from 5.2% twelve months earlier. In education & health services, the rate fell to 5.0% from the record 5.4%, and in trade, transportation & utilities, it fell sharply to 4.4%, the lowest point since November 2017. The rate eased to 3.7% in construction but in manufacturing it improved to 3.7%, up from 3.3% twelve months earlier. The government sector job openings rate eased to 2.9%, and remained up sharply from the 2009 low of 1.2%.
The level of job openings declined 7.1% to 7.087 million (+8.5% y/y). Private-sector openings fell 7.5% (+8.1% y/y) while government sector job openings were off 2.2% (+12.6% y/y).
The private-sector hiring rate held steady at 4.2% but remained below May’s eleven-year high of 4.4%. The rate in leisure & hospitality eased to 6.5%, but in professional & business services, it rose to 5.5%. The rate remained below the 2017 high of 6.1%. The construction sector’s hiring rate declined sharply to 4.8%, the lowest level since September 2016. The hiring rate in trade, transportation & utilities improved to 4.2% after falling sharply in January. In education & health services, the rate held steady for a second month at 3.0%. In manufacturing, the rate fell to 2.7%. The hiring rate in government fell to 1.6%.
Total hiring rose a lessened 1.8% y/y to 5.696 million. Hiring in the private sector rose 1.9% y/y while government sector hiring gained 1.1% y/y.

U.S. Small Business Optimism Is Little Changed
The National Federation of Independent Business (NFIB) reported that its Small Business Optimism Index of 101.8 during March was basically unchanged from February, but remained down sharply from its August peak of 108.8. The index gained 0.1% m/m but was 2.8% lower y/y.
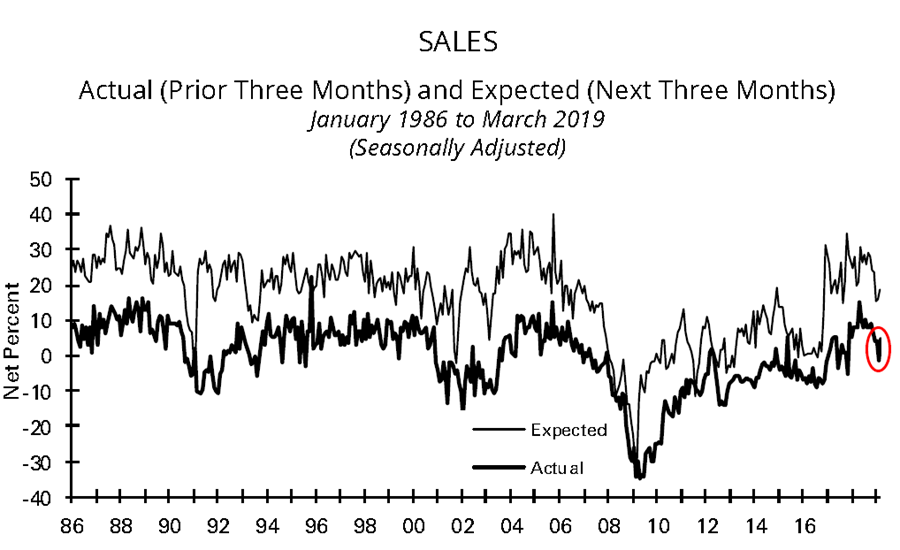
A steady 11% of respondents expected the economy to improve, down from a high of 48% in January 2017. Twenty-three percent of firms thought that now was a good time to expand the business. It was 34% in August of last year. A higher 19% expected higher real sales, up m/m but still below a 29% high two years earlier. A steady 27% of firms expected to make capital outlays but that remained below the high of 33% last August.
Pricing power eased m/m. A greatly lessened 24% of firms were planning to raise prices, down from November’s ten-year high of 29%. Current pricing pressure also eased. A net 12% of firms were raising average selling prices, the least since January of last year and below the 19% high last May.
Labor market readings improved m/m. The 18% of respondents planning to increase employment was improved m/m, but remained below the record 26% in August. A greatly increased 54% were finding few or no qualified candidates for job openings, up from 47% twelve months earlier.
Pressure to raise worker compensation rebounded m/m as a higher 20% of firms were planning to raise compensation and an increased 33% were doing so now. Both figures remained down sharply, however, versus last year’s highs.
Credit remained more difficult to get as a steady six percent reported trouble obtaining financing, the most since September 2017.

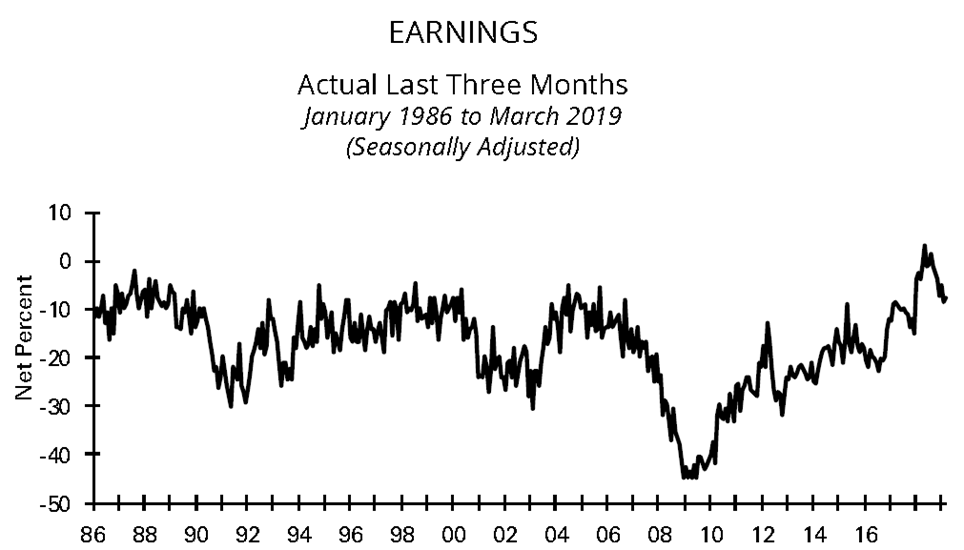
More charts from the survey: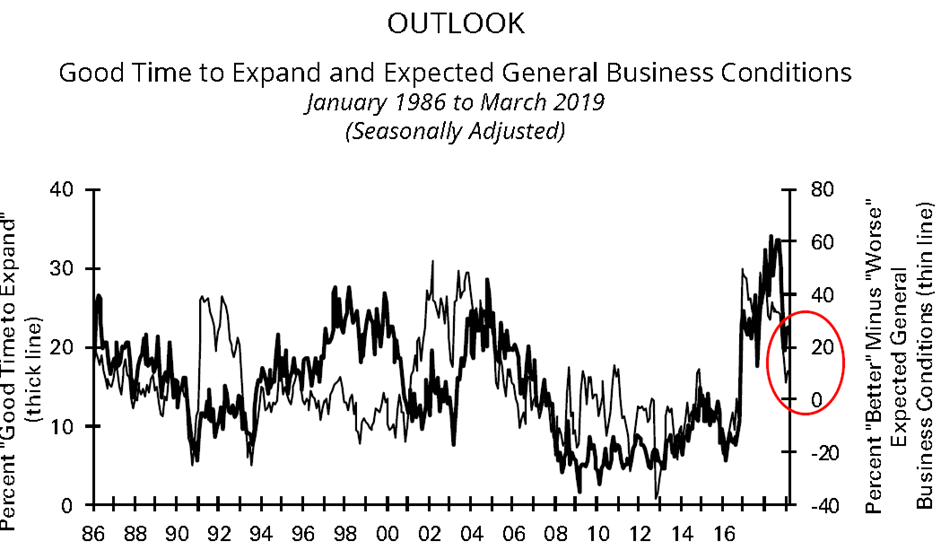

RECESSION WATCH
Economic Outlook from Freight’s Perspective
Transportation is sending more warning signals
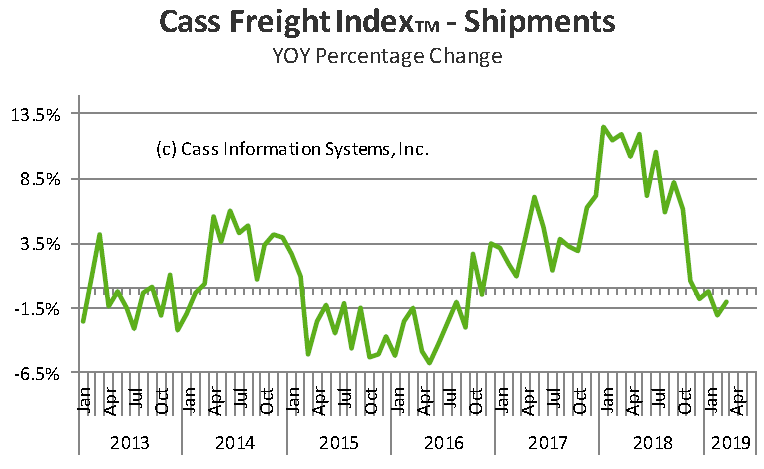
With March down -1.0% — the fourth YoY negative month in a row — we are preparing to ‘change tack’ in our economic outlook. Yes, all of these still relatively small negative percentages are against extremely tough comparisons; yes, the two-year stacked increase was 10.8% for March; and yes, the Cass Shipments Index has gone negative before without being followed by a negative GDP. But, at a minimum, business plans and economic outlooks should be moderated or have contingency plans included or expanded. (…)
Beyond our concern that the Cass Freight Shipments Index has been negative on a YoY basis for the fourth month in a row,
- We are concerned about the severe declines in international airfreight volumes (especially in Asia) and the recent swoon in railroad volumes in auto and building materials;
- We are reassured by the sequential increase in the Cass Freight Shipments Index (up 2.0%) and the volumes in U.S. domestic trucking (especially in truckload dry van);
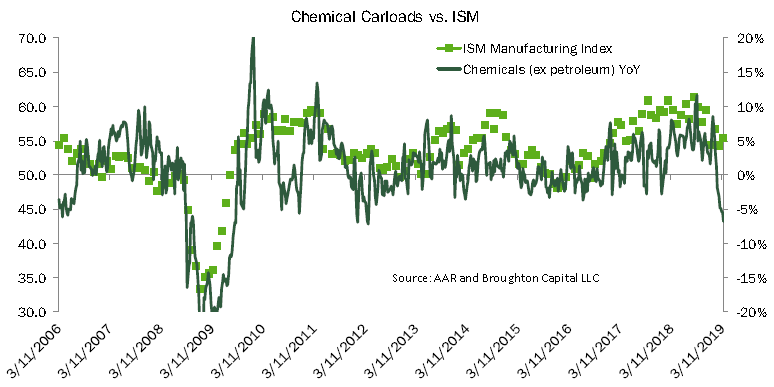
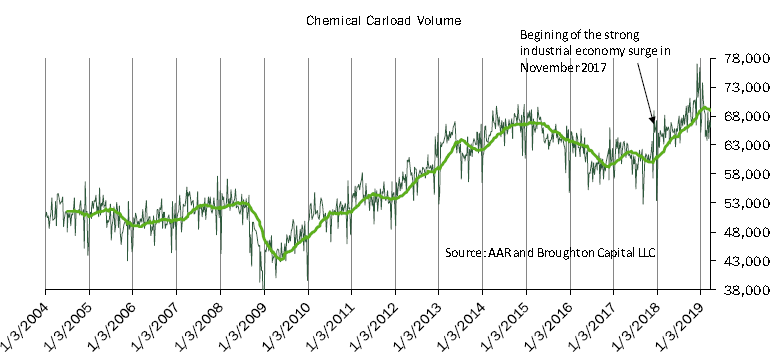
- We are closely watching the volumes of chemicals and other shipments via railroad, as they have lost momentum in recent weeks and may give us the first evidence of the global slowdown spreading to the U.S.
(…) Recent airfreight volumes in Europe suggest that the region’s economy has cooled. Airfreight volumes in Asia suggest that the region is on the verge of, or is already entering, a recession. As we’ve highlighted before, when trade tariffs slow the rate of growth for our global trading partners, it poses a real threat to the U.S. rate of economic growth. (…)
Asian airfreight volumes were essentially flat from June to October 2018 but have since deteriorated at an accelerating pace (November -3.5%, December -6.1%, January – 5.2%, February -13.6%). If the overall volume wasn’t distressing enough, the volumes of the three largest airports (Hong Kong, Shanghai, and Incheon) are experiencing the highest rates of contraction.
Even more alarming, the inbound volumes for Shanghai have plummeted. This concerns us since it is the inbound shipment of high value/low density parts and pieces that are assembled into the high-value tech devices that are shipped to the rest of the world. Hence, in markets such as Shanghai, the inbound volumes predict the outbound volumes and the strength of the high-tech manufacturing economy. (…)
While we are closely monitoring these trends and looking for signs of contagion, we are not yet finding much materially meaningful evidence of it. We continue to see the current scenario as most analogous to the 1997-1998 Asian currency crisis, but are far more concerned about the potential for recession in both Europe and Asia. (…)
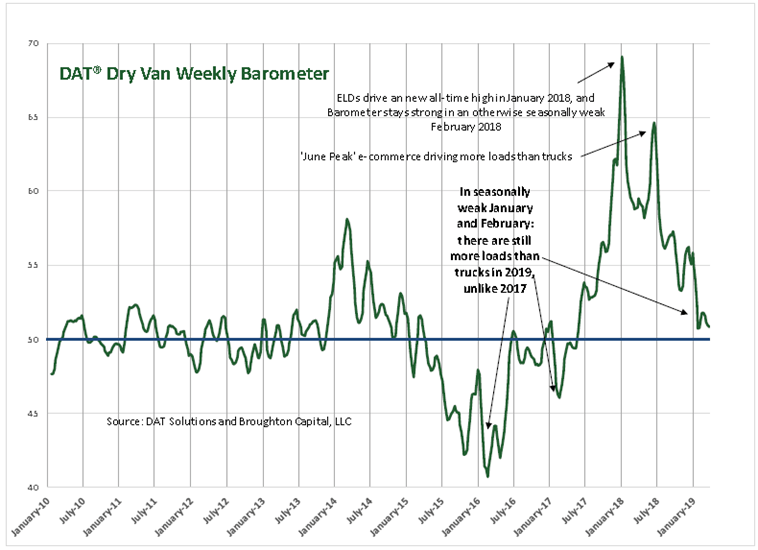
The Consumer Economy – We should also note that dry van trucking volume serves a similar role to container volume in predicting retail sales. Especially when studied using the DAT Dry Van Barometer, a clear pattern of strong volume growth exceeding capacity growth, which is driving pricing power, remains.
The Industrial Economy – With the surge in the price of WTI crude back above $45 a barrel in October of 2016, the industrial economy’s rate of deceleration first eased and then began a steady improvement led by the fracking of DUCs (drilled uncompleted wells), first in the fields with a lower marginal production cost (i.e., Permian and Eagle Ford) and now with oil back above $50 a barrel (WTI is above $64 a barrel as we write this) the U.S. oil industry is now fracking new wells in all the major shale fields. We would note that indications of accelerating strength have been coming from several modes of transportation, but none more visibly than in flatbed trucking which we view as a key heavy industrial indicator. As long as WTI crude oil stays above the marginal cost of production in the major U.S. fracking fields, we expect to see continued industrial economic growth.
Just as the DAT Dry Van Barometer indicating that demand exceeds capacity is a positive sign for the consumer economy, the DAT Flatbed Barometer indicating that demand exceeds capacity is a positive sign that the U.S. industrial economy is still healthy.
Data from the rail industry mirrors the data coming out of the flatbed segment of trucking. We have asserted for years that one of the best predictive indicators of U.S. domestic industrial activity is the chemical carload volume moved via railroad. Our assertion is simple: it is almost impossible to manufacture, or even assemble, anything in mass quantity without chemicals. As a result, there has historically been a very tight relationship between the railroad chemical carload volume and the ISM Manufacturing Index.




 If Cass’ chemical stuff has you confused a little, here’s something less confusing from the chemicals industry itself

Hasta luego!
2 thoughts on “THE DAILY EDGE: 11 APRIL 2019: Recession Watch”
Just curious about the difference between a hyped Red Hot Booming Economy and slow semi-normal recovery after crash. Looks like 10 years of nothing and America not looking great (again).
Real GDP/Case shiller home index (composite 20) as percent change:
&
GDP/Median Sales Price of Houses Sold for the United States, Dollars, Not Seasonally Adjusted (MSPUS) as % change
https://fred.stlouisfed.org/graph/?g=nCAt
Digging further into the March jobs report, David Rosenberg, chief economist and strategist of Gluskin Sheff, finds other disquieting details. The “quits rate,” a barometer of worker confidence and a favorite stat of former Federal Reserve Chair Janet Yellen, fell to 12.5% from 13.5%, which he also says may help explain slowing wage gains. The household survey also found a 212,000 jump in multiple job holders, which, Rosenberg writes in a client note, is a bellwether countercyclical indicator, as more people have to hustle a second job to make ends meet.
https://www.barrons.com/articles/markets-shrug-after-jobs-report-shows-theres-little-to-worry-about-51554487829
Comments are closed.