U.S.-Canada Trade Feud Escalates After Fraught G-7 Summit U.S. officials escalated President Donald Trump’s criticisms of Canada’s prime minister and the global trading system, heightening tensions with allies as Washington enters an important stretch of negotiations on several fronts.
David Leonhardt in the NYT:
(…) The meeting’s central disagreements were over tariffs that Trump has imposed for false reasons. He claims that he’s merely responding to other countries. But the average current tariff of the United States, Britain, Germany and France is identical, according to the World Bank: 1.6 percent. Japan’s is 1.4 percent, and Canada’s is 0.8 percent. Yes, every country has a few objectionable tariffs, but they’re small — and the United States is not a victim here. (…)
It finally happened: U.S. President Donald Trump picked a fight with the nicest people on earth. (…)
Mr. Trump is correct that certain Canadian sectors—particularly dairy—enjoy unfair protection that was grandfathered into NAFTA. U.S. farmers, however, have been some of the biggest winners from NAFTA: Agricultural exports to Canada have nearly quadrupled since it launched nearly 25 years ago.
If the broader agricultural sector gets sucked into NAFTA renegotiations, U.S. farm sector investors could get dragged through the mud—and the biggest winner will be China, which will find its leverage with American farmers much-enhanced.
Though you wouldn’t know it from the Twitter-verse, Canada is now the largest export market for U.S. farmers, with total shipments hitting $20.5 billion in 2017. (…)
Ironically, there’s one key sector where Canada represents a real competitive threat to American industry—oil and gas. Ottawa has long been a significant petroleum exporter, and would love to grab a big piece of the rapidly-growing Asian liquefied natural gas market, where China is a dominant buyer.
Mr. Trump’s policy mix is simultaneously raising construction costs for American oil and gas infrastructure by pushing steel prices higher and alienating both of America’s largest trading partners—one of whom is a major energy and agricultural exporter, and the other the world’s largest energy and food consumer.
Don’t be surprised if U.S. energy producers and farmers end up holding the bag.
From the FT: Car bosses round on Trump over threat of tariffs
(…) Trade Partnership Worldwide, an economic consulting firm, calculated that a 25 per cent tariff on cars and parts imports would potentially create 92,000 new jobs in manufacturing but lead to a loss of 250,000 jobs across the rest of the economy. (…)
“We don’t compete regionally,” he said. “We sell regionally, but we compete globally. The ramifications, unintended or intended, of changes to policies and practices, could be significant.” (Joe Hinrichs, Ford’s head of manufacturing) (…)
Canada Sheds Jobs for a Second Month But Wages Are on a Tear
(…) Indeed, the 3.9% year-on-year increase for average hourly earnings is the highest in nine years. As today’s Hot Charts show, investor concerns are warranted because accelerating wages have typically been associated with upward pressures on core inflation.
(…) Another sign the economy remains tight was a separate Statistics Canada report showing industrial capacity utilization climbed to 86.1 percent in the first quarter, the highest since 2006. (…) (NBF)

BTW:
- The rate of Germany’s labor cost increases is expected to rise sharply over the next year.(The Daily Shot)

Source: Pantheon Macroeconomics
BTW:
- The Eurozone’s export growth slumps. (The Daily Shot)

Source: @OxfordEconomics; Read full article
New housing construction falls to lowest level in a year
Housing starts fell 9.8 per cent to an annualized 195,613 units, from 216,775 in April, Canada Mortgage & Housing Corp. said Friday from Ottawa. Multiple-unit starts dropped 15 per cent to 124,957 units. Single-detached homes was the only segment to see a slight rise from April, with a 2 per cent gain to 70,655.
Auto Lenders Ramp Up Risk
(…) In the first quarter, the average loan term for a new car exceeded 69 months, the second consecutive quarter it had ever been above that level, according to credit-reporting firm Experian. Also in the first quarter, new car loans originated with repayment periods of between 73 and 84 months represented more than a third of total new car loans, up from 7% of loans in late 2009. (…)
Lenders say they typically make the longest loans to prime customers who can afford them and understand the risks. A report last month by Moody’s Investors Service, however, found that borrowers who sign up for loans that last six years or longer have lower credit scores and owe a larger share of the vehicle’s price than consumers with shorter loans. The loan payments also account for a larger share of their income, said Moody’s, which reviewed loans securitized since 2017 and that were mostly comprised of prime borrowers. (…)
Loans with longer repayment periods are more prone to default, according to Moody’s. Loans of five years or longer extended to borrowers in 2015 with high credit scores had a cumulative net loss rate of 1.29% as of spring 2017. For shorter-term loans, the loss rate was 0.28%.
Speaking of banking: From the Mortgage Bankers Association:
Independent mortgage banks and mortgage subsidiaries of chartered banks reported average pre-tax production losses of 8 basis points (a loss of $118 on each loan they originated) in the first quarter of 2018, down from 9 basis points ($237 per loan) in the fourth quarter of 2017, according to the MBA’s Quarterly Mortgage Bankers Performance Report released this week.
The continued drop in overall production volume in the first quarter of 2018 resulted in the highest per-loan production expenses reported since inception of the report in the third quarter of 2008. Mortgage bankers saw their total loan production expenses increase to 377 bps ($8,957 per loan) in the first quarter of 2018, from 353 bps ($8,475 per loan) in the fourth quarter of 2017.
Higher production revenues mitigated a portion of the cost increase. Total production revenue increased to 370 basis points ($8,840 per loan) in the first quarter of 2018, from 362 bps ($8,712 per loan) in the fourth quarter of 2017.

Saudis Start to Ramp Up Oil Output, Ahead of OPEC Meeting The kingdom began producing 100,000 barrels of oil a day more last month and plans to raise output again by at least that much, in shift from earlier plan.
Emerging-Markets Rout Feeds Contagion Fears A retreat in emerging-market assets has sparked concerns that the turbulence could spread from distant corners of the world to the U.S. and elsewhere.
(…) Many currencies of developing countries are near multiyear lows, despite a boost from strong commodity prices and solid global growth, while investor allocations to emerging-market-focused bond funds are at their lowest level of the year, according to the Institute of International Finance.
The spasms highlight the effects that a stronger dollar and higher U.S. bond yields can have as they amplify the problems of vulnerable countries, threatening assets that investors recently considered to be comparatively safe. (…)
“Rising global real interest rates are the number one predictor of financial problems in vulnerable economies,” said Kenneth Rogoff, a professor at Harvard University and the former chief economist of the International Monetary Fund. “The risks are greater than people realize.”
Dollar strength is a danger for some countries because it weakens their currencies and makes it more difficult to pay back dollar-denominated debt. Higher U.S. rates dim the allure of foreign assets, especially in emerging markets, where investors often take on greater risk in exchange for higher yields and returns. (…)
A record $1.6 trillion of debt issued by governments, financial firms, and other companies in all currencies matures this year and $1.7 trillion matures next year, according to the Institute of International Finance. That debt, concentrated in China, South Korea, India, and other countries, will either need to be paid down or refinanced. (…)
With two-year Treasury yields at 2.5%, the assets of potentially vulnerable countries become much less attractive, said Edward Al-Hussainy, currency strategist at Columbia Threadneedle Investments.
“Is the return high enough to compensate you for the risks? Clearly the answer across the board is ‘no,’” he said.
HMMM…
- Mommy, what does peaking mean?


(Charts from David Rosenberg, Gluskin Sheff)
- Mommy, are we prepared for peaking?

Source: @Callum_Thomas
PEAKING? REALLY?
TECHNICALS WATCH
The S&P 500 is clearly out of the wedge, above the rising 100dma and 200dma on volume similar to that of mid-2017.

But wait. There is a new wedge, courtesy of Lance Roberts who also reveals that
This past week the market cleared the 61.8% Fibonacci retracement from the recent lows which removes a major barrier in reaching previous market highs.

Regarding the 200dma, Steve Blumenthal warns:
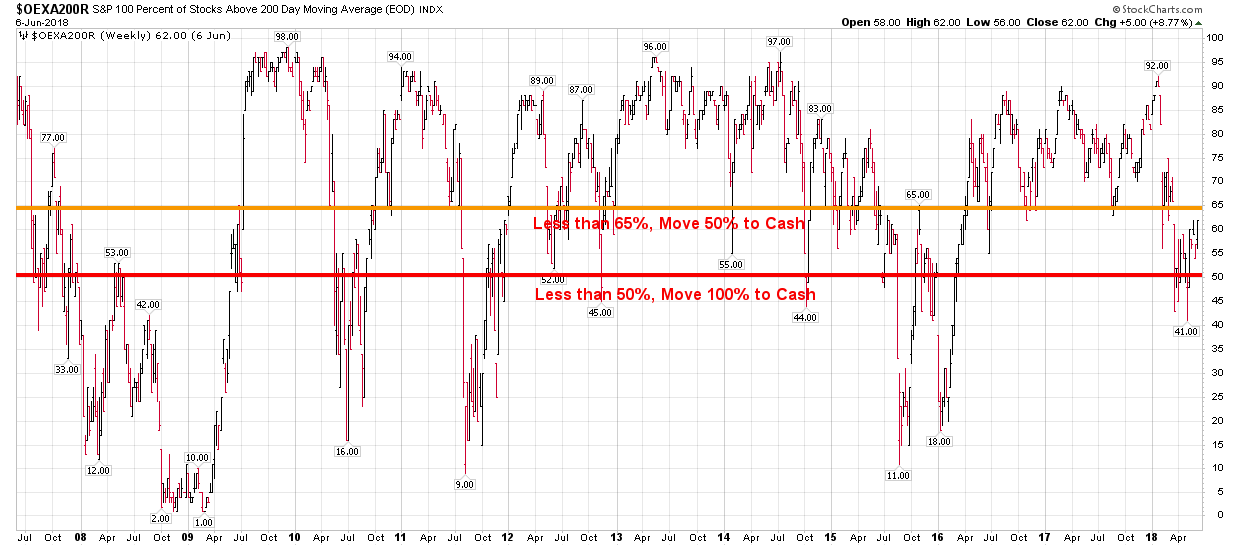
However, it would be nice to see the number of stocks in the S&P 100 Index above the 65% line. Bull markets are strongest when a majority of stocks are sending the averages higher. One rule some traders use is to de-risk from stocks when the percentage of stocks above the 200-day MA line drops below 65% and move the balance of stock exposure to cash when less than 50% of stocks are above their 200-day MA lines.

Lowry’s Research findings continue to impress amid much bearishness from many smart people. Lowry’s indices reveal a continued widening gap between its rising Buying Power and diminishing Selling Pressures, the latter lately reaching levels last seen in 1949! Nobody’s selling!
Ned Davis Research also tracks Volume Demand vs Volume Supply, shared by Steve Blumenthal:
Yellow highlight shows the current signal. Currently in a buy signal. Here is the model’s data 1981 to present (which includes the great bull market and the two bear markets since 2000):

Peaking? Hmmm…
Chinese battery maker CATL jumps 44% on trading debut World leader in electric vehicle batteries hits $12.3bn valuation as it looks to boost output
(…) CATL said it planned to use most of the Rmb5.46bn ($853m) raised through its IPO to build a 24GWh factory with the aim of attaining production capacity of 50GWh a year by 2020. (…)
4 thoughts on “THE DAILY EDGE (11 June 2018): TECHNICALS WATCH”
Here is global tariff data for all to see from WTO ( these are overall averages )
https://www.wto.org/english/tratop_e/tariffs_e/tariff_data_e.htm
click on ‘summary tables’ on upper right ( a zip file will immediately download- click on the zip file )
now click on middle file ( Summary_allE )
now go down ‘ simple average ‘ column
USA massively lower than all other countries
how does US media ignore this?oh and it gets better
The EU will whine ‘ our tariffs not so bad ‘
but on USA cars ? they have a special enviro tax that adds another 15% tax
WTO hides this
How did Bush & Obama allow this system to evolve ? its gang rape of USA companies
there are also outright blockades of many US products as well ……. simply no way to get certain products into certain countries at any tax rate
Why does the NYT pretend its unaware of these tariffs our ‘allies’ already have on us ?
Why does Canada have these tariffs? 270% dairy 69.9% Sausage 57.8% Barely Seed 49% Durum Wheat 26.5% Bovine/Meat 18% Table Linen
Why did Canada create “ingredient strategy” tariff in 2015?
To protect those important industries and curb US imports.
Thanks for that Jill.
Looking at the table, I see these average duties for these countries:
EU: 5.1%, Canada: 4.2%, Japan: 4.0%, Mexico: 7.1%, China: 9.9%, USA: 3.5%. The NYT nbres (the tariffs differential) look close enough to those in the WTO table.
I don’t know if I would qualify USA’s 3.5% “massively lower” than China’s 9.9%, but certainly not any of the other in the “gang”.
Unfortunately, it is almost impossible to perform an objective and thorough analysis of trade without including tariffs, quotas, barriers and direct and indirect subsidies. Best would be none of all but in this world, that seems like a pipe dream.
Thanks for the good resume of the situation Canada/US.
Thank you Sammy, my longest running reader.
Comments are closed.