CONSUMER WATCH
January retail sales are out Thursday (CPI tomorrow).
Cold weather chills spending
Consumers cooled spending last month as inclement weather rocked much of the U.S., according to new data from Bank of America Institute.
Total card spending per household fell 0.2% from the prior year after rising by the same amount in December, the bank says, citing its internal data.
Restaurant spending was particularly weak in January, reversing the boom seen the previous month: Spending on cards per household at eateries fell 3.2%, compared to the 3.6% gain in December.
Bad weather — freezing temperatures, snow and rain across the nation — was mostly to blame for the spending pullback as opposed to broad signs of consumer weakness, BofA said.
“[W]here the weather was better, such as the West, spending was resilient, and in the later part of the month, total card spending per household rebounded across the country,” economists wrote in the data release. (Axios)
For instance, card spending in the Western region of the U.S. rose 1.7% from a year earlier.

Source: BofA Global Research; @MikeZaccardi
A BROAD WEALTH EFFECT!
Americans under 40 saw a massive increase in wealth since 2019
Americans under 40 saw their wealth rise by a staggering 80% since pre-pandemic — a far higher rate than any other age group, per new data from the Federal Reserve Bank of New York.
This is about “stonks and stimmies” — as well as the risk-taking proclivities of youth.
During the pandemic, those under 40, many flush with stimulus checks, took to the stock market and saw big gains.
The big differentiator between the young and the old was in financial assets, according to the NY Fed’s analysis.
- Those under 40 saw the value of their financial assets rise more than 50% from Q1 2019 to Q3 2023. Those who were 40-54 saw a 3% increase, and those over 54 saw their financial assets rise 20%.
- The under-40 crowd’s share of financial assets invested in stocks and mutual funds rose by 39%, while the share for those 40-55 decreased, and for the 55+ crowd, it grew by 12%.
- Of note: The data doesn’t distinguish between changes in asset allocation and changes in returns (more money gained from those investments). The results are a combination of both.
The shift “likely reflects the fact that younger adults, being farther away from retirement, can afford to invest in risky assets at a higher rate than older adults,” the researchers write in a blog post published Wednesday.
- “The youngest age group is also the poorest and thus received much of the COVID-era fiscal stimulus, granting them
- Many of these folks also didn’t have to make a student loan payment for most of that period.
All age groups saw gains in the value of their homes — real estate assets increased about 40%.
Overall, the older cohort is far wealthier than the young. The net worth of those 55 and over was $97 trillion in the third quarter of 2023.
That’s compared to $8.6 trilly for Americans under 40.
(…)

HORNY?
From the Carson Group:
(…) Since the Chinese New Year typically starts between late January and mid-February, we looked at the 12-month return of the S&P 500 Index starting at the end of January dating back to 1950. And wouldn’t you know it? The Year of the Dragon has been up five out of six times and up a median of 11.5%. But if you look closer below, you’ll notice that stocks see double digit returns only every other appearance of the Year of the Dragon, which could mean this time it’s due for a breather.
Here’s how all 12 signs have done since 1950. Turns out the Year of the Goat has the strongest returns, but you’ll have to wait till 2027 to see that one again. More bad news—the Year of the Snake is the worst performer and that takes place after the Dragon next year.
Lastly, we found it amusing that animals with horns saw some of the best returns, while a slimy reptile like the snake or a dirty little rat saw the worst. Given Dragons have horns, maybe this will be a nice year for the bulls?


You might think these guys are not serious. Read on, they also do really good serious stuff:
Much of China’s economy is based on investment spending (43% of GDP) compared with the US, which is mainly consumer based (nearly 70% of GDP is consumer spending). Given much of China’s investment is based on real estate and debt, the ongoing property investment crash in China will continue to hinder any recovery. In fact, property investment was down 10% last year, compared with up 10% in 2018 and 2019 before the pandemic.
Here are some stats from Sonu Varghese, Global Macro Strategist, on China’s real estate issues:
- In March 2021, China was building residential property at a rate of 1.71 billion square meters per year.
- That was cut in half, to ~ 881 million square meters, by December 2022.
- As of October 2023, it’s been cut by another 20%, to 699 million square meters.
Additionally, China has a lot of debt (so does the US), but most of their debt is private debt, which can be a much bigger issue than public debt (like the $34 trillion our government has racked up).
More from Sonu on this:
- Significant amounts of private debt are actually more detrimental than public debt, and a big risk factor, for an economy.
- Private debt is serviced with revenues from business operations.
- If there’s a slowdown, private sector revenues contract.
- The contraction is even more severe if there is leverage.
- That is what happened in the US in 2008 (high household debt) and in 2001 (high corporate debt).


![]() Also this smart analysis helping us better analyze this NDR table:
Also this smart analysis helping us better analyze this NDR table:

![]() Not All Rate Cuts Are the Same
Not All Rate Cuts Are the Same
Here’s the thing—many think the Fed cutting rates is a sign we’re in or near a recession. It is true that some rate cuts have come during times of economic weakness, even recessions. Many immediately think about 2001, 2007, and 2020 as times the Fed cut to stimulate the economy amid troubles. Here’s the truth: Not all rate cuts are the same, as some take place during what we would call periods of normalization.
A normalizing first cut is a cut that takes place likely after the Fed hiked to slow things down, the economy wobbled but didn’t fall into a recession, and then began to expand again amid lower inflation. Think of this like the first cuts in 1984, 1995, and 2019.
Then of course there are what we’d classify as panic cuts. Think times like after the 1987 crash, the fall of 1998 during the Russian ruble and Long-term Capital Management crises, and of course March 2020.
Breaking it down by these three types of cuts shows very interesting results. When the Fed cut during a recession, the S&P 500 has been down an average of more than 14% only three months later and down nearly 12% a year later!
Compare that with a cut to normalize and stocks are up nicely across the board and higher 13.2% on average a year later.
Panic cuts see the best performance, up 17.4% a year later. That makes sense, as times of panic and pure fear are historically great buying opportunities.
As Sonu Varghese, our VP, Global Macro Strategist, has noted time and time again, we simply aren’t seeing any signs of a recession on the horizon and believe any cuts now would be to normalize.
(…) But will the Fed really cut with the stock market at an all-time high? Let’s remember their dual mandate, which is full employment and stable prices. Nowhere does it say how stocks are doing should matter, but the world isn’t so black and white. Still, I looked back and found 20 other times they cut when the S&P 500 was within 2% of an all-time high (based on the day before the cut) and wouldn’t you know it, stocks were higher a year later EVERY. SINGLE. TIME.
2019 was the last time we saw this. You have to go back to the mid-‘90s before that. We’ve said many times we see many similarities between the mid-‘90s and now. Both periods saw an aggressive Fed amid an economy that avoided a recession, inflation tame, strong wages, and high productivity.
We think we are going to see additional productivity strength, which is the key to all of it. High productivity allows the Fed to cut rates and not worry about higher inflation, while wages stay strong. Bottom line, the Fed has cut near all-time highs before and usually it has been a bullish development.


That still leaves 2 questions:
- What happens post a “normalizing cut” after the Fed hiked to slow things down but things did not really slow down?
- What about when equities rallied strongly before the first “normalizing cut”?
The Fed is now seen cutting rates in May, amid a strong (strengthening?) economy.
Meanwhile, the ECB is guiding investors towards June, amid a weak (weakening?) economy.
…amid a weak (weakening?) economy.

Despite favourable inflation dynamics, the ECB continues to worry that the tight labour markets will continue to boost wages and with that contribute to upside inflation risks longer out. Given the structural rigidities of Euro-area wage formation, such worries are not without merit. Several ECB Governing Council members have pointed to the importance of getting a better picture of the labour market situation before drawing firmer conclusions on the inflation outlook. (…)
The coverage of the Euro-area labour market and wage data is quite poor, at least relative to the US, and the data are released with long lags. For example, the comprehensive Q1 data will not be available until the ECB’s June meeting – an important reason to expect the first cut at that meeting.
If the ECB waits for labour market data to confirm weakened inflation dynamics, it is almost bound to be late in starting to reduce rates. However, for now that seems to be an acceptable price to pay for the central bank.
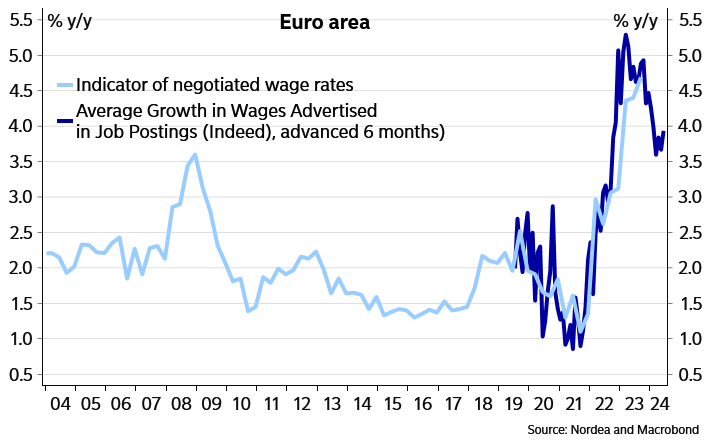
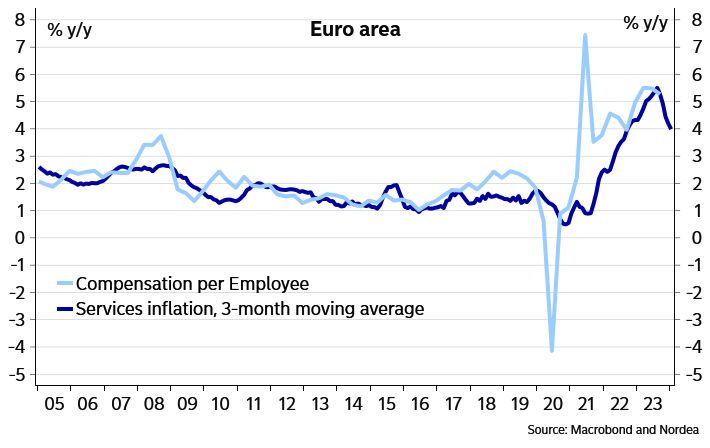
The labour market situation continues to look tight. The unemployment rate remains at its lowest level seen in the era of the Euro area. The latest comprehensive indicator of negotiated wages (Q3 2023) showed y/y growth of close to 5%. Wage demands remain elevated in many sectors, not least in German construction.
Lagarde has argued that 40% of the workforce will have their employment terms, including wages, determined in the coming months, so near-term developments certainly have an impact on the inflation outlook.
High wage demands are naturally not equal to high pay rises. Many of the more timely indicators of the labour market situation point to at least some cooling. The y/y rate in the Indeed wage measure based on average growth in advertised wages has fallen from more than 5% towards 3.5%, though the recent readings again suggest the downward move has stalled.
The European Commission surveys point to labour shortages easing, but from high levels and even the recent readings remain clearly above the pre-pandemic situation.
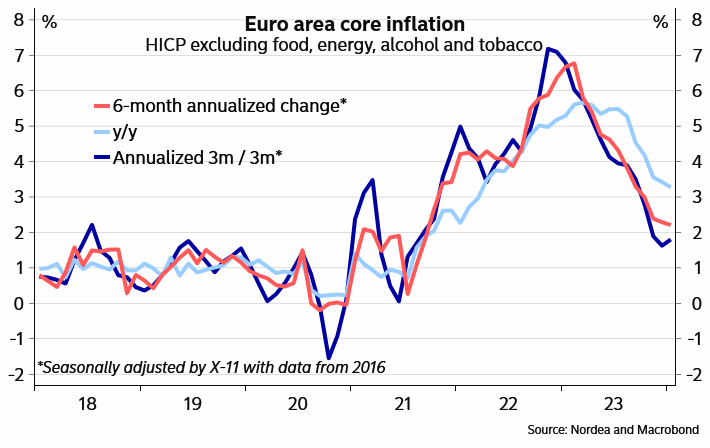
High wage growth still causing headache to the ECB
Some surveys are actually pointing to a renewed increase in price pressures. The output price index of the composite PMI index has risen for three straight months already. In turn, the net share of service sector companies expecting to see higher prices over the next three months has been climbing for four months already. It is thus not clear yet, whether especially service sector inflation will continue to fall going forward.
Surveys point to renewed upside pressures in the service sector
One key question remains, whether the demand situation has weakened sufficiently for companies to reduce their margins and not pass on higher labour costs fully to consumer prices.
Productivity developments are naturally also important, though quite difficult to measure especially in the short term. The ECB has warned that the strong unit labour cost development poses an upside risk to the inflation outlook, but in the past, the link from unit labour costs to inflation has not been particularly strong in the short run.
Further, the recent data has been encouraging, as ECB’s Lane argues: “The contribution of unit profits to domestic price pressures continued to fall in the third quarter of 2023, suggesting that unit profits are absorbing some of the price pressures coming from rising unit labour costs.”
Our baseline remains that inflation pressures are easing for good in the Euro area, which will allow the ECB to start cutting rates later this year. Given the central bank’s need to see more data on the labour market developments and given the fact that the more comprehensive data are not in use yet in the April meeting, the June meeting remains the most likely starting point for the cuts.
April is not out of the question, but other data need to surprise more notably to the downside to bring April into play. Still, we see risks tilted towards an earlier rather than a later start to the cuts. That said, if the Q1 labour market data point to sticky wage pressures and tight labour markets, also a later start to the cuts is possible.
When demand is weak, higher labour costs are not unlikely to be passed on to final prices in full
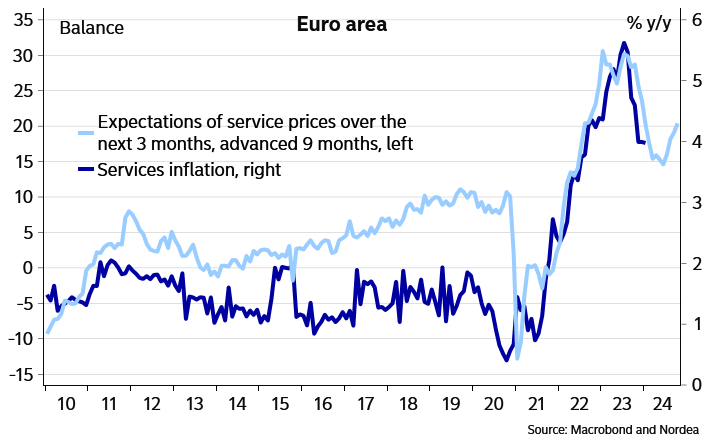
In July 2023, the PMI Prices Index pointed to inflation below 3%. The latest readings show inflation stabilizing around 2.0-2.5%.


German commercial property prices post biggest-ever drop, data shows
German commercial property prices fell 12.1% in the final three months of 2023 compared with a year earlier in their biggest-ever drop, the VDP banking association said on Monday, as the nation’s struggling property industry suffers its worst crisis in decades.
For the full year, commercial real estate prices dropped 10.2%, accelerating their decline after small drops of less than one percent in 2022 and 2021, VDP’s data showed.


A New York Rent-Control Bank Panic Investors fret about NYCB’s multi-family housing portfolio.
Regional bank share prices have tumbled since New York Community Bancorp (NYCB) reported surprisingly large losses on real-estate loans. Don’t blame this mini-bank panic only on underwater office buildings. Primary culprits are Albany’s destructive rent-control laws. (…)
But what worries investors more is the bank’s $37 billion multi-family housing portfolio, about half of which are comprised of New York rent-regulated units.
The bank flagged that 14% of its $18 billion rent-regulated loan book is at risk of default. Its eventual losses could be bigger as rent-regulated buildings have recently been selling at a 30% to 60% discount from their purchase price. The values of rent-regulated buildings have fallen by some $75 billion, according to one estimate.
NYCB acquired the failed Signature Bank’s deposits and some of its loans last spring. But the Federal Deposit Insurance Corp. struggled to find a buyer for Signature’s $15 billion in loans that were backed primarily by New York rent-regulated buildings. Last autumn the agency finally unloaded the loans at a roughly 40% discount. Why have these loans become toxic?
Blame Democrats in Albany, who in 2019 restricted landlords’ ability to raise rents to pay for renovations and “de-regulate” rent-stabilized units. These apartments account for nearly half of the city’s rental housing. Landlords used to be able to charge the market rate once the rent exceeded $2,800 a month and a tenant moved out. No longer.
One result is that landlords have removed rent-regulated apartments from the market and are leaving them vacant rather than spend on maintenance and improvements that they can’t recoup. Tighter supply has pushed up rents in the non-regulated market—one reason Manhattan’s average market-rate monthly rent has surged 30% over the last two years.
Lower anticipated future rents have also slashed property values. Loans for buildings that were issued at low-interest rates—the average coupon for NYCB’s rent-regulated portfolio is 3.85%—will also have to be refinanced in the coming years. Some underwater owners may walk away. NYCB’s rent-regulated portfolio could be a ticking time bomb. (…)
Few investors until recently appreciated the financial impact of New York’s rent-control regulations. NYCB’s troubles are a reminder that bad government policy is a source of financial instability. What other risks could be hiding in plain sight?
Canada: An increasing number of cracks are appearing in the job market
In normal times, a 37k increase in employment combined with a one-tenth drop in the unemployment rate would cause us to breathe a sigh of relief and believe in the continuation of the economic cycle. Not in these unusual times, and especially not in a month when the population aged 15 and over grew at a record pace of 125K (a six standard deviation move, past 20 years).
The 37K gain therefore remains well below the 77K jobs that would have been needed to keep the employment rate at the same level.
The sizable three-tenths drop in the participation rate over two months means that the unemployment rate probably understates the fragility of the labour market. There is a risk that the participation rate could reverse in the coming months as the pressure to find a job increases for some individuals over time.
To illustrate, if the participation rate had not fallen over this period, the unemployment rate could be 4 ticks higher than it is now.
Returning to the January data, the composition of new jobs is far from reassuring. Part-time jobs improved the overall picture, while full-time jobs fell for the second month in a row. What’s more, businesses appear to be in a hiring freeze. In fact, the public sector added 48K jobs in January, while non-public employment fell for the second month in a row.
This weakness in the business sector comes as no surprise and is consistent with data from the Bank of Canada’s Business Outlook Survey. Labour shortages are a thing of the past, with 27% of firms now reporting that they are experiencing labor shortages, a far cry from the 46% recorded at the start of the rate hikes.
What’s more, the high proportion of firms experiencing a decline in sales (40%) and the gloomy outlook could mean outright job cuts in the coming months.


EARNINGS WATCH
With 332 reports in, the beat rate is 81% and the surprise factor +6.8%, broadly distributed.
Those 332 companies reported earnings up 7.4% on a 3.7% revenue gain. Huge increase in margins.


Trailing EPS are now $222.44. Full year 2024: $243.12e. Forward EPS: $242.77.
