Jobs Report Offers Little Reason for Fed to Change Its View Steady payroll gains but few signs of accelerating wages could keep central bank rate policy on hold
(…) At the margins, the December report suggests the labor market cooled at the end of last year, though economists have expected this for some time as employment rates rise and the pool of available workers declines.
While payroll growth in December was strong enough to hold the unemployment rate at a 50-year low, wage growth decelerated. Average hourly earnings of private-sector workers rose 2.9%, down from a recent high of 3.4% in February 2019. Measures of aggregate hours worked for private-sector employees also showed slower rates of growth. (…)
We should all be focused on the U.S. consumer and its ability to sustain a decent level of growth in spending. The payrolls index (employment x hours x hourly wages) has decelerated to +3.8% YoY in December with total CPI in the 2.0% range.
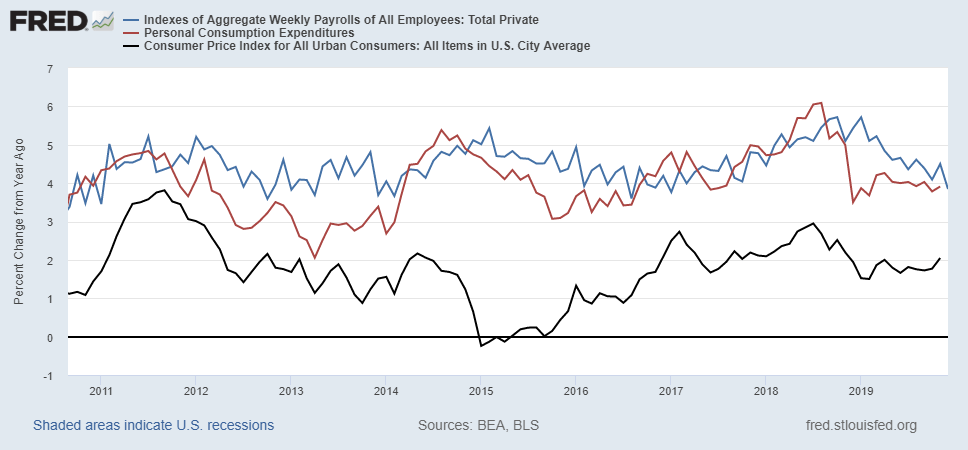
Employment growth has decelerated to +1.4% in December (2019 average = +1.6%) while hourly earnings are now rising 2.8% compared with a +3.2% 2019 average.

All the components of the payrolls index are decelerating, even weekly hours back at their 5 year low point of 34.3 hours. The curious trend, however, is in hourly earnings. On a YoY basis, hourly earnings are up 2.9%, down from 3.4% last February. For all of Q4, wages are up at a 2.8% annualized rate but December was up only 1.2% a.r..
Maybe only statistical noise but what kind of noise is this 4-month slide in Production workers’ wage growth rate from +3.6% annualized in September, to +3.0% in October, +2.0% in November and +1.0% in December. This group represents 80% of the labor force. This wage puzzle keeps getting puzzling…

Bloomberg’s John Authers today discusses this trend and its potential ramifications:
(…) The following chart, produced by Steven Blitz, chief U.S. economist of TS Lombard, compares the aggregate index of weekly payrolls (the product of average earnings, hours worked and employment) with discretionary demand. At the margin, it looks as though the current apparently booming employment market could in fact bring deflationary forces with it, and presage reduced revenues for companies. (…)

China’s U.S. trade deal commitments not changed in translation: Mnuchin China’s commitments in the Phase 1 trade deal with the United States were not changed during a lengthy translation process and will be released this week as the document is signed in Washington, U.S. Treasury Secretary Steven Mnuchin said on Sunday.
Mnuchin told Fox News Channel that the deal reached on Dec. 13 still calls for China to buy $40 billion to $50 billion worth of U.S. agricultural products annually and a total of $200 billion of U.S. goods over two years. (…)
This is a very, very extensive agreement,” he added. (…)
Asked if he still expected China to purchase $40 billion to $50 billion in U.S. farm products under the deal, Mnuchin said: “I do. Let me just say, it is $200 billion of additional products across the board over the next two years, and, specifically in agriculture, $40 billion to $50 billion.” (…)
-
U.S., China Agree to New Dialogue to Pursue Reforms, Address Disputes Washington and Beijing have agreed to semiannual talks to push for reform in both nations and resolve disputes, reviving a format from previous administrations that Trump trade officials had once derided.
NYC Housing
From the NYT:
(…) Nearly half of new condo units in Manhattan that came to market after 2015, or 3,695 of 7,727 apartments, remain unsold, according to a December analysis of both closed sales and contracts by Nancy Packes Data Services, a real estate consultancy and database provider. The report looked at buildings with about 30 or more units. (…)
In 2011, the average sale price of a new condo was $1.15 million, just a 9 percent premium over resales. By 2019, the average price of a new condo was $3.77 million, a 118 percent premium over resales, Ms. Packes said.
That disconnect has led to a glut of unsold luxury condos. Including shadow inventory — the units held off the market until conditions improve — there were 7,050 new condo units available for sale in Manhattan in January, according to a Halstead Development Marketing report. That is the equivalent of more than six years of inventory at the current pace of sales, when a balanced market typically sells out in two to three years. (…)
EARNINGS WATCH
From Refinitiv/IBES:
Through Jan. 10, 19 companies in the S&P 500 Index have reported earnings for Q4 2019. Of these companies,
84.2% reported earnings above analyst expectations and 15.8% reported earnings below analyst expectations. In a typical quarter (since 1994), 65% of companies beat estimates and 20% miss estimates. Over the past four quarters, 74% of companies beat the estimates and 19% missed estimates.In aggregate, companies are reporting earnings that are 4.2% above estimates, which compares to a long-term (since 1994) average surprise factor of 3.3% and the average surprise factor over the prior four quarters of 4.9%.
Of these companies, 68.4% reported revenue above analyst expectations and 31.6% reported revenue below analyst expectations. In a typical quarter (since 2002), 60% of companies beat estimates and 40% miss estimates. Over the past four quarters, 58% of companies beat the estimates and 42% missed estimates.
In aggregate, companies are reporting revenue that are 0.4% above estimates, which compares to a long-term (since 2002) average surprise factor of 1.5% and the average surprise factor over the prior four quarters of 1.0%.
The estimated earnings growth rate for the S&P 500 for 19Q4 is -0.6%. If the energy sector is excluded, the growth rate improves to 1.9%.
The estimated revenue growth rate for the S&P 500 for 19Q4 is 4.2%. If the energy sector is excluded, the growth rate improves to 5.4%.
What the Refinitiv account does not say is that these 19 early reporters (November year-ends) incurred a 17.2% earnings decline in Q4 on a 2.4% revenue growth rate. One year ago, the first 20 reporting companies had a 19.6% earnings jump on a 10.9% revenue growth rate. The sample comprises 12 consumer-centric companies, 5 IT and 2 Industrials.
These companies’ woes actually began in Q1’19 when earnings fell 4.6% YoY, followed by –11.2% in Q2, -17.5% in Q3’19 and now –17.2% in Q4. During that year, revenue growth slowed from +5.5% in Q1, to +2.8% in Q2, to +1.0% in Q3 and +2.4% in Q4.
The Q4’19 earnings season gets in second gear this week.
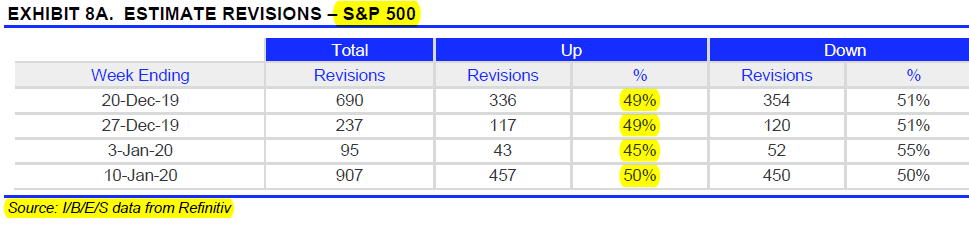
Analysts have been busier revising their estimates last week with upgrades still equal to downgrades.

 Analysts are expecting a 6.1% rebound in Q1’20 earnings, down from +8.9% on October 1. From there, growth accelerates to +7.2% in Q2, +10.1% in Q3 and +14.4% in Q4 for an estimated gain of 9.6% for the year, down from +11.2% on Oct. 1.
Consumer-centric companies are seen rebounding from a rather dismal Q4’19 period, much like IT companies.

How will revenue growth accelerate from 2.2% to 8.3% (CD companies) or from 3.5% to 7.5% (IT) is not revealed, sadly enough.
As this Fidelity chart illustrates, actual annual earnings generally finish 8.2% lower, on average, than the initial estimate (excluding 2018-tax cut) with a range of –5.1% to –14.0% since 2011. Hence the current $177 estimate for 2020 is more likely to end up between $152 and $168.

THE TAAL EQUITY MARKETS (3)
In December 2017, I posted THE TAAL EQUITY MARKETS, comparing the eerie calmness of this mountain in the Philippines as we climbed to the top of the crater to the then calmness in U.S. equity markets, confidently sporting  a 15-year high 22.4 on the Rule of 20 scale and 20.6 on the conventional P/E scale.
What to worry? The economy was strong enough to get the Fed prudently, preemptively press on the brakes while tax reform would boost profits and investments, eventually taking care of whatever excess leverage there might be out there. The market, obviously overvalued, seemed to be in a good place looking forward.
“Under most calculations and scenarios, equities seem fully valued currently with a 15-20% downside.
As legendary mountaineer Ed Viesturs wisely said, “getting to the top is optional, getting down is mandatory.” He also said:
What some people call “summit fever,” he calls “groupthink,” which is when a majority of the group, desperate to reach the top, disregards dangerous weather, route conditions, or other important factors. The least experienced climber tags along thinking if everyone else is going, then it should be just fine. It’s almost a lemming-type effect. People get swept up in it, it’s that psychological feeling of safety. No one gives any thought to the acceptable level of risk.’
When I am climbing, I listen to the mountain. All the information is there, which helps me decide what to do. Arrogance and hubris need to be put aside, and humility and thoughtfulness are essential. I truly believe that is how I survived so many expeditions into a dangerous arena.”
In a February 6, 2018 sequel, I wrote after the S&P 500 had climbed down 9.7% between its Jan. 26 high to 2587 on Feb. 6 (then to 2529 on Feb. 8 to qualify as a bona fide correction of –11.8%):
Valuations are notorious poor timing tools, but they sure are good at warning of impending danger.
That calm volcano we serenely climbed with our son and his Filipino family in late 2017 violently erupted without notice on Sunday, forcing David and his family to hurriedly leave their toxic countryside and drive 3 hours on an ash covered road, amid several scary earth tremors, to Manilla.
Investors keep serenely climbing this equity volcano as Morgan Stanley and BCA Research show (via Isabelnet):


- “This is a market looking through fundamental data, looking through corporate guidance and data points, looking through Fed guidance itself,” Lisa Shalett, the chief investment officer at Morgan Stanley Wealth Management, told Bloomberg Television. “It is a market that wants to go up in the short term. That is what makes it so profoundly dangerous.” (Bloomberg)
-
Short sales in the SPDR S&P 500 ETF Trust, known by its ticker SPY, as a percentage of shares outstanding fell to 1.1% Tuesday, according to data from IHS Markit Ltd. That’s the lowest level since January 2018, before the event known as “Volmageddon” sent stocks swooning. (Bloomberg)

TECHNICALS WATCH
Lowry’s Research says that its primary measure of Demand, the Buying Power Index, “has set new rally highs in an uptrend dating from mid-Aug. 2019. At the same time, our primary measure of Supply, the Selling Pressure Index, remains in a well-established downtrend and close to its lowest level since early April 2019. A sustained pattern of expanding Demand and contracting Supply historically represents the strongest phase of a bull market and provides a much more reliable indication of higher prices ahead than any Wall St. statistical oddity.”
But, “On a strictly short-term basis, there is some evidence that Demand is growing more selective.” The recent gains in Lowry’s Adv-Dec Lines have been dependent primarily on Large Cap stocks and “a significant percentage of Lowry stocks are in short-term downtrends.” Lowry’s also notes that “stocks recording new highs are concentrated in a handful of Sectors, primarily the Info Tech and Communication Services Sectors” warnings that a “narrowing focus to the strongest stocks in a handful of Sectors provides another example of the selective Demand that can leave the market vulnerable to a short-term pullback.”
The S&P 500 has, in effect, decoupled from its equal-weight clone…

…and even more so from the S&P 600 Index:

The S&P 500 is now more overvalued than ever, per this measure

(…) The above chart, from Ned Davis Research, shows that price relative to sales for the S&P 500 is at a record high, “well in excess of what they were in 2000 or 2007 at those peaks,” wrote Ned Davis in a Wednesday note to clients. (…)
If I showed you 2 companies, one with 5% net margins and the other one with 10% net margins, would you be willing to pay more per dollar of the more profitable sales?

This CPMS/Morningstar chart illustrates the link between P/S and Net Margins. It is true that P/S is at a historical high but so are net margins…unlike the late 1990s. And while a decline in margins would likely take P/S down, note the long-term uptrend in margins. The “mean reversion” most people have been forecasting has not happened, just yet anyway.
Like it or not, sustainable or not, desirable or not, the fact is that corporate America’s larger companies have become more profitable over time. Remember the 2018 corporate tax cut?
Another measure also popular within the bear circle is Price to Book, also reaching new highs recently, other than during the dot.com bubble. But look at ROE, the rate of return on said book equity:

The WSJ MarketWatch keeps quoting Ned Davis:
“But the S&P 500 could be overstating earnings due to buybacks and other financial engineering of profits,” Davis wrote, because corporate buybacks reduce shares in circulation, increasing earnings-per-share even if overall profits haven’t risen. Therefore, looking at the ratio of market valuations to overall profits suggests “P/E ratios are some 80% above the long-term norm,” Davis wrote.
The problem with buyback bashing is that, in reality, stocks trade on an earnings per share basis and that share buybacks do impact the per share calculation, like it or not. As it happens, S&P 500 companies’ price per share generally fluctuates roughly in line with earnings per share and this cycle is no exception (log scales don’t change the picture).
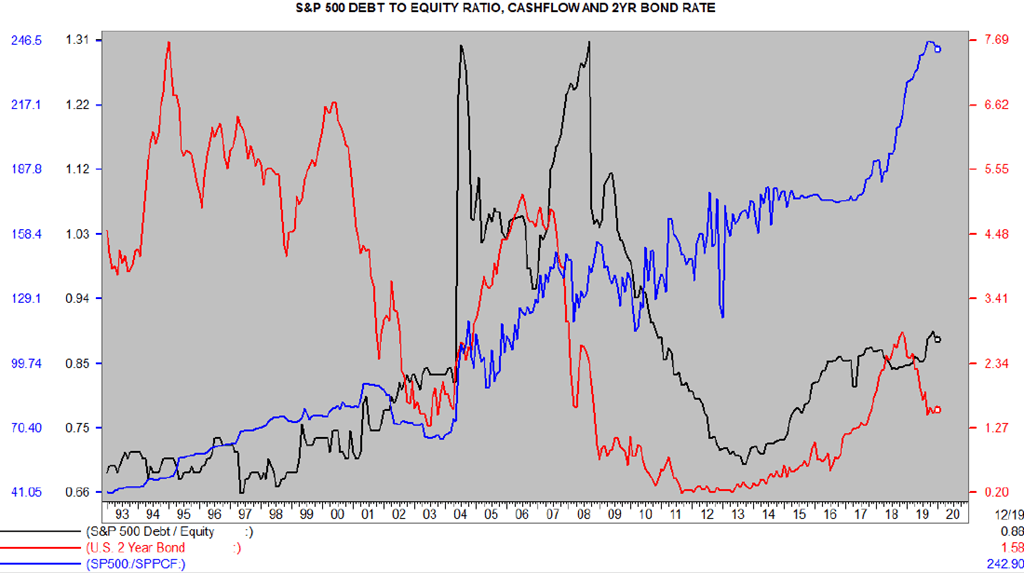
What must be watched with buybacks is whether corporate debt gets boosted beyond prudent levels as a result, which could negatively impact valuations and subsequent earnings cycles. While the S&P 500 D/E ratio has increased, it is below 1:1 and well below previous record highs. This when interest rates are historically low and corporate cashflow (blue line) is up nearly 40% in the last 2 years. Remember the 2018 corporate tax cut?
Trailing P/E ratios are currently 20.1, at the every high end of their historical 10-20 “normal” range but not “80% above the long-term norm”. If we exclude the 1974-1985 period, the “norm” was more like 12-22.

The Rule of 20 P/E, which incorporates inflation in the earnings valuation equation, displays a more stable range between 16 and 24. At its current 22.3 level, it says that the upside from valuation is 7.6% (to 24.0) while the downside from valuation is 28.3% (to 16.0). Remember that it went from 21.2 in September 2018 to 16.9 on December 24, 2018.

Also consider that the Rule of 20 Fair Value is now 2885 [(20 – inflation (2.3%) x $163.09)] and has been falling since June 2019 (2952). The correlation between the R20FV and the Index is 98% since 1957, 92% since 1997 and 96% since 2007). Higher earnings and/or lower inflation are needed soon. Higher earnings would be much more preferable than lower inflation which would make generating higher earnings more challenging.