August CPI: +0.1%, +8.3% YoY. Core CPI: +0.6%, +6.3% big surprise! Core Goods: +0.5%, +7.1%. Core Services: +0.6%, +6.1%. Peakflation not yet.
Strong job gains? Don’t count on it!
This is from Mish Shedlock, an advisor at SitkaPacific Capital Management.
I have been commenting on the jobs (Establishment Nonfarm Payrolls) vs employment (Household Survey) discrepancy for four months. The two surveys measure different things. A person is either employed or not, but someone can have multiple jobs.
Generally the numbers move in the same direction over time. The Household Survey is noisy, but 6 months is a reasonable time frame for discrepancies to resolve.
If you assume both surveys are correct, then the interpretation is that the strength in jobs since March is due to 1.6 to 2.0 million people taking extra part-time jobs.
The only other explanation is that one of the surveys is flat out wrong. (…)
A likely explanation for the divergences is boomer retirements coupled with approximately 2 million people taking extra part time jobs to make ends meet due to high inflation.
No matter what the explanation, if the Household and BLS Jobs reports are both reasonably accurate, the highly touted jobs boom is dramatically overstated in any practical sense, especially real consumer spending.
- J.P. Morgan’s job tracker also shows no jobs growth since the spring:

- Goldman Sachs’ Job Growth Tracker:

- David Rosenberg also questions the jobs data, based on Canadian data:
The consensus was shocked — shocked! — to learn that Canadian employment sank 40k in August. The consensus was closer to +15k, so a big miss. Not just that, but this represents the third decline in a row, during which employment has sagged a cumulative 113.5k or a -2.3% annual rate. In other words, the historical record suggests that recession odds have now been boosted to 90%. Even worse, full-time jobs plunged 77k, the steepest decline since April 2021, also down three straight months (-94k or 83% of the total slide). At the same time, the workweek was flat after a 0.6% contraction in July.
Something is amiss here because there is a historical 95% correlation between Canadian employment and U.S. employment. And here Canada, the 51st state but filled with nicer people (just kidding… sort of!), came in at -40k while the BLS tries to convince us that payrolls surged +315k the very same month. They both can’t be right. The two surveys don’t always have to mirror each other, but declines like this in Canada tend to coincide with a flattish payroll number. The data go back to 1966 and at no time in the past have we ever seen employment in Canada so weak in the same month that U.S. payrolls were so strong. In other words — something here is amiss.
Finally, aggregate hours worked were flat as a beavertail in August, and that came on the heels of a 0.5% decline in July. The “build-in” for Q3 is a microscopic +0.8% annual rate, which means that absent a productivity pick-up, the Canadian economy basically stagnated this quarter. Canadian dollar bearish, that is for sure. Considering that productivity has receded in six of the past seven quarters and is running at -1.6% on a YoY basis, so it is actually quite conceivable that Canadian real GDP contracted in Q3.
The correlation between GDPs is 99.77% since 1960, 99.74% since 1990 and 99.32% since 2000.

Covid-19 Illnesses Keep at Least 500,000 Workers Out of U.S. Labor Force, New Study Says The virus will weigh on the workforce if infection rates continue, authors predict.
(…) The labor force would have 500,000 more members if not for the people sickened by Covid, according to the study’s authors, economists Gopi Shah Goda of Stanford University and Evan J. Soltas, at the Massachusetts Institute of Technology. (…)
This estimate is conservative, however, in that it excludes anyone who wasn’t working at the survey’s outset but who would have become employed if not for illness, as well as those whose absences fell outside of the week during which the Census conducted its monthly survey. Accounting for these, the economists estimate the labor-force decrease would be around 750,000 people, equal to a reduction in participation of about 0.3 percentage point. The study also didn’t analyze outcomes for those missing work to care for family members sickened by Covid, nor those who missed less than a week of work due to health, nor those who died of Covid. (…)
“Excess retirement” is estimated at ~2M. Add 500-750k and you get the “missing workers”.
Thousands of Minnesota Nurses Go on Strike Over Retention, Staffing, Pay The strike is believed to be the largest-ever work stoppage by private-sector nurses in the U.S., according to the Minnesota Nurses Association
(…) The strike includes [15,000] nurses from 16 different hospitals and seven different hospital systems. (…) The nurses are requesting a 27% pay bump over three years, the union said. Essentia said it is offering a 10% wage increase over three years and an immediate 1% bonus. (…)
Employees at more than 1,400 workplaces filed petitions with the National Labor Relations Board to form unions in the first half of 2022. That rose 69% year over year and was the highest since 2015.
So far this year through August, 15 major strikes have begun, according to data from the BLS, which counts major work stoppages of at least 1,000 workers. By comparison, there were 16 major strikes last year.
- Over the weekend, negotiations continued between the country’s largest freight railroad companies — including Berkshire Hathaway’s BNSF, Union Pacific and CSX — and the majority of the unions representing around 115,000 workers. They’re racing to meet a Friday deadline when a “cooling off period” runs out and workers could strike.
- Meanwhile, port workers on the West Coast have been negotiating a new contract; the last one expired in June.
Holiday Sales Growth to Slow to 4% to 6% This Year, Deloitte Says
(…) “Retail sales are likely to be further affected by declining demand for durable consumer goods, which had been the centerpiece of pandemic spending,” Daniel Bachman, Deloitte’s US economic forecaster, said in a statement. “However, we anticipate more spending on consumer services, such as restaurants, as the effects of the pandemic continue to wane.” (…)
This year’s projected growth in dollar value is in-line with pre-pandemic trends, though at a reduced volume due to rising prices. (…)
- Mastercard: Holiday shoppers are expected to spend 7.1% more this year than they did in 2021, which would fall short of last year’s 8.5% increase. (…) “This holiday retail season is bound to be far more promotional than the last,” said Steve Sadove, senior adviser for Mastercard and former CEO of Saks, in a statement.
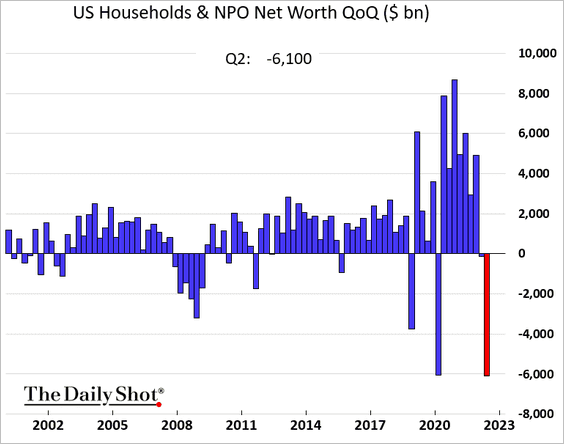
- How about the wealth effect?
JPMorgan Team Says Soft Landing Is More Likely Than Recession
Recent data pointing to moderating inflation and wage pressures, rebounding growth and stabilizing consumer confidence suggest the world will avoid a recession, a team including Marko Kolanovic and Nikolaos Panigirtzoglou wrote on Monday. Markets can benefit from fiscal stimulus in China, energy support plans in Europe and very low investor sentiment, they said.
“Economic data and investor positioning are more important factors for risky asset performance than central bank rhetoric,” the strategists wrote. “We maintain a pro-risk stance.” (…)
“We maintain that inflation will resolve on its own as distortions fade and that the Fed has over-reacted with 75bps hike,” the team wrote. “We will likely see a Fed pivot, which is positive for cyclical assets.” (…)
- Fiera Capital’s excellent team of strategists ditched its low odds soft landing scenario last July. Fiera now sees 50% probability of a “Deep U.S. Recession” (-2.0% GDP), 30% for a “Shallow Recession” (-1.0%) and 20% for “Stagflation” (+1.0% with 5.0% headline inflation).
- Goldman Sachs’ Current Activity Indicator:
")
Despite improvement in factory sector production during July, weakness in the Industrial Materials Price Index from the Foundation for International Business and Economic Research (FIBER) has persisted through early this month. The price index fell 5.0% during the last four weeks and stood 5.6% below its level last year.
Price declines in the Metals group led the weakness during the last four weeks with an 8.5% decline, and they’re off 17.6% y/y. Zinc prices fell 10.8% in four weeks, but they have risen 5.7% y/y. Zinc is used in the manufacture of batteries. Aluminum prices weakened 8.4% in four weeks and fell 18.4% y/y. Steel scrap prices declined 6.6% in four weeks (-17.6% y/y) and copper scrap weakened 2.5% (-17.0% y/y). Tin prices fell 11.7% in four weeks, down by more than one-third this past year. Lead prices declined 12.3% in four weeks and have weakened 19.5% y/y.
Prices in the Crude Oil & Benzene group fell 8.0% during the last four weeks but have risen 6.6% y/y. The cost of West Texas crude oil fell 6.7% in four weeks to $85.01 per barrel, but remained roughly one-quarter higher y/y. Prices for the petro-chemical benzene declined 25.6% in four weeks and declined 7.9% y/y. The FIBER price index excluding crude oil fell 4.9% during the last four weeks and was 7.1% lower y/y.
In the Miscellaneous group, prices weakened 4.2% (-6.6% y/y) during the last four weeks, led by a 12.5% decline in framing lumber prices. They have fallen 20.9% during the last year. Natural rubber prices weakened 11.7% in four weeks and were down 6.5% y/y. Hide prices held steady over four weeks, but fell by roughly one-quarter y/y.
Textile group prices slipped 0.3% in the last four weeks, but remained 2.7% higher y/y. Cotton prices eased 0.7% in four weeks but rose 18.9% y/y. The cost of burlap, used for sacks, bags and gardening, fell 1.4% in the last four weeks and slipped 0.7% y/y.

- China’s tumbling PPI will help ease global price pressures.
 Pantheon Macroeconomics via The Daily Shot
- Europe’s energy squeeze (BlackRock)
The European Union is now spending nearly 12% of its GDP on energy, making the crisis worse than the 1970s oil shocks. That’s not the case for the U.S, a net energy exporter. It’s hard to see any relief for Europe in the next couple of years, with rationing on the horizon, in our view. (…)
Energy burden as a share of GDP, 1970-2022
Sources: BlackRock Investment Institute and BP Statistical Review of World Energy 2021, with data from Haver Analytics. September 2022. Notes: The chart shows the cost of oil, gas and coal consumption in the European Union and U.S. as a share of GDP. We use regional energy prices and divide by GDP in U.S. dollars. Data for 2022 are based on IMF’s latest GDP forecasts and the year-to-date average of daily commodities prices.
The ECB is set to make things worse: Like the Federal Reserve, the ECB hasn’t acknowledged the damage it must do to growth to fight this inflation, even after it hiked a record 0.75% last week. The ECB is instead responding to the politics of energy-driven headline inflation, we think. Its new forecast for modest growth next year is already stale by not accounting for recent events like Russia cutting off gas supply. We see the ECB’s downside scenario of a -0.9% contraction as more likely. The euro sliding to 20-year lows against the U.S. dollar reflects deteriorating growth and terms of trade from higher energy prices, in our view.

-
Yes, 5.3% is much better than 11.7%. But it is still worse than 2-4%.
- Global coal prices (Axios)

Data: FactSet; Chart: Axios Visuals
Finance Chiefs Struggle to Set Guidance as Economy Flashes Mixed Signals Dozens of large U.S. companies have revised their annual forecasts recently, citing rising inflation, the possibility of recession and international factors like the energy crisis in Europe
Finance chiefs are finding it harder to peg yearly guidance as they struggle for visibility on the direction of the economy, leading them to broaden their annual revenue ranges and revise spending plans more frequently. (…) Chief financial officers are adapting by factoring into their outlooks events once considered unlikely, widening the ranges for their revenue forecasts and revisiting spending plans more often.
In the second quarter, 129 S&P 500 companies revised their annual revenue or earnings per share forecasts, 50% more than did so in the same period last year, according to Calcbench Inc., a data provider. Fifty-six of those companies revised guidance up, fewer than the 63 that did so in the same period last year, while the remaining 73 either cut guidance, narrowed the range or provided mixed updates by revising revenue in one direction and EPS in the other. (…)
In recent months, other companies have revised their guidance downward. In the second quarter, 40 S&P 500 companies trimmed their outlooks, more than double the number in the prior-year period, Calcbench said. (…)
Dynatrace Inc., a Waltham, Mass., software-intelligence company, also trimmed its guidance. (…)
In the weeks leading up to its Aug. 3 earnings release, it became apparent that guidance for the fiscal year ending in March would have to be clipped as the company was struggling to bring in new customers, Mr. Burns said.
In a “handful of instances,” existing clients—which include retailers and financial services and travel companies—put a hold on plans to expand contracts into new areas. Dynatrace was also seeing a decline in new customers, down to around 135 from the 150 to 160 new accounts it had planned for in the quarter ended June 30, according to Mr. Burns. (…)
“This is the first time in the history of Dynatrace that we’ve actually had to reduce guidance,” Mr. Burns said. “But given the macro pressures, we definitely brought it down.”