Traveling in Peru, posting is more limited.
EARNINGS WATCH
From Refinitiv:
Through Apr. 12, 29 companies in the S&P 500 Index have reported earnings for Q1 2019. Of these companies, 79.3% reported earnings above analyst expectations and 17.2% reported earnings below analyst expectations. In a typical quarter (since 1994), 65% of companies beat estimates and 21% miss estimates. Over the past four quarters, 76% of companies beat the estimates and 17% missed estimates.
In aggregate, companies are reporting earnings that are 4.9% above estimates, which compares to a long-term (since 1994) average surprise factor of 3.2% and the average surprise factor over the prior four quarters of 5.4%.
Of these companies, 48.3% reported revenues above analyst expectations and 51.7% reported revenues below analyst expectations. In a typical quarter (since 2002), 60% of companies beat estimates and 40% miss estimates. Over the past four quarters, 67% of companies beat the estimates and 33% missed estimates.
In aggregate, companies are reporting earnings that are 0.5% below estimates, which compares to a long-term (since 2002) average surprise factor of 1.5% and the average surprise factor over the prior four quarters of 1.1%.
The estimated earnings growth rate for the S&P 500 for 19Q1 is -2.3%. If the energy sector is excluded, the growth rate improves to -1.3%. The estimated revenue growth rate for the S&P 500 for 19Q1 is 4.9%. If the energy sector is excluded, the growth rate improves to 5.5%.
The estimated earnings growth rate for the S&P 500 for 19Q2 is 2.3%. If the energy sector is excluded, the growth rate improves to 2.6%.
Three months ago, the 27 S&P 500 companies that had reported Q4’18 results had a beat rate of 85% but a surprise factor of 0.0%, primarily because the 4 Financials that had reported surprised with earnings and revenues 3.4% and 1.7% below estimates respectively. This quarter, the 5 Financials having reported so far surprised by 4.9% on earnings and +3.4% on revenues.
Investors were relieved.
However, the sum of the facts are not quite as positive as last week’s equity trends suggest:
- Trailing EPS have declined almost one dollar to $161.97.
- Q1 estimates have slipped from –2.0% to –2.3%.
- Q2 estimates have slipped from –2.3% to –2.8% .
- Full year 2019 estimates have slipped from +3.3% to +2.9%.
Analysts keep revising downward, pretty much across the board:
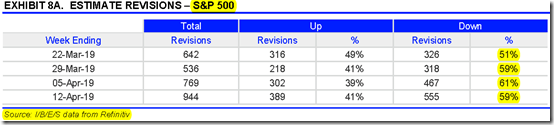
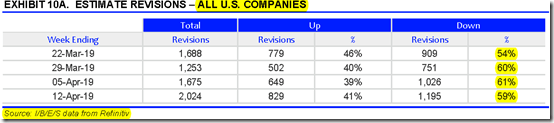
The Rule of 20 P/E is now 19.95 at Friday’s close of 2907. Rule of 20 Fair Value is now 2915 with the most recent trailing EPS and core CPI, the latter down from 2.1% to 2.0% last week, offsetting the drop in trailing EPS.

RULE OF 20 STRATEGY
The Rule of 20 Strategy went from zero equity throughout 2018 to zero cash on December 24 at 2374 at a Rule of 20 P/E of 16.9. The S&P 500 is up 22.4% since to a Rule of 20 P/E of 19.95, just 0.3% below the Rule of 20 Fair Value of 2915.
Unless trailing EPS rise along with the Index, the Rule of 20 Strategy would raise some cash at 2915.
TECHNICALS WATCH
Lowry’s Research says that “as of April 8th, Selling Pressure reached a new low in its intermediate-term downtrend dating from the Dec. 24th 2018 market bottom and also set a new low for the entire bull market dating from 2009. After a dynamic expansion from late Dec. 2018 to early Feb. 2019, Buying Power has been in a generally sideways trend suggesting a more tempered pace in Demand. Nonetheless, Buying Power did set a new rally high (at 180) on April 8th. Most importantly, the balance of Supply and Demand has continued to improve, as the percent spread between Buying Power and Selling Pressure reached a new high on April 8th (at 36.36%) for the entire bull market.”
Lowry’s sums it up: “In brief, a strong balance of Supply and Demand, expanding breadth and Upside Volume continue to support the rally.” The only weak area remains small caps.
The S&P 600 Index is still in a downtrend.

So is the Russell 2000:

Global Markets Rally Defies Dimming Outlook Many investors are trying to square their big returns with the fact that they have arrived while the global economic outlook has grown progressively dimmer, leaving some to wonder how much longer the rally can last.
(…) About 6.2 billion shares a day changed hands last week on NYSE and Nasdaq exchanges, the lowest weekly average volume figure since the end of August, according to Dow Jones Market Data. It marked just the second time since the start of September that the weekly average came in below 6.5 billion shares. (…)
In another similar sign, billions of dollars continue to flow out of stock mutual and exchange-traded funds, according to data from fund tracker EPFR Global. (…)
Investors Still Embrace Fixed Income Funds in Uncertain Times
Year-to-date through the Lipper fund-flows week ended April 10, 2019, equity funds (including ETFs) handed back some $2.8 billion despite the average equity fund posting a 14.94% return. Meanwhile, taxable fixed income funds took in a net $97.5 billion, with the average taxable fixed income fund returning 3.91%.

4 thoughts on “THE DAILY EDGE: 15 APRIL 2019: Fair Value”
The economy consolidated into one simple FRED chart:
https://fred.stlouisfed.org/graph/?g=nFSW
Here’s The Easter 2019 Fair Value Chart of the day ….
Taking the Wilshire 5000 Total Market Index (WILL5000IND)
dividing by and then looking at percent change
National income: Corporate profits before tax (without IVA and CCAdj) (A053RC1Q027SBEA)
https://fred.stlouisfed.org/graph/?g=nFSH
Probably nothing (again): GDP/30 year mortgage rate. Seems as if GDP will slow a bit and rates going nowhere. May even be good for housing mkt, but as people in general don’t increase their wages, how likely is it that this game will be sustainable?
https://fred.stlouisfed.org/graph/?g=nFLq
Little FRED chart on corp profit growth, before and after the boom:
https://fred.stlouisfed.org/graph/?g=nFEs
Comments are closed.