Consumer Watch: Higher-income pullback
From the moderation seen last month, there were further signs of a slowdown in consumer spending in April. Bank of America aggregated credit and debit card spending per household slowed further to -1.2% year-over-year (YoY) in April, the first negative monthly YoY reading since February 2021.
Most noteworthy is a softening in spending on services to just +0.9% YoY. Until recently, services had been driving overall spending growth. The moderation last month, however, was broad based led by spending on airlines dropping by 4.5 percentage points to +0.9% YoY in April.
Despite the weak YoY growth rate, sequentially, total spending actually increased by 0.3% month-over-month (MoM) seasonally-adjusted (SA). Two factors to keep in mind are that spending was strong last April, an unfavorable base effect for this year’s YoY comparison, and the timing of Easter may also have been impactful. Easter Sunday was April 9th this year, compared to April 17th in 2022. Nonetheless, daily spending data following Easter looks softer.


The BofA analysis sees signs that the changing labor environment is having an impact on spending. Recall that recent data on unemployment claims through May 6 now exceed pre-pandemic levels:

We identified households receiving unemployment benefits through direct deposit and detected changes in trends across income cohorts. The number of unemployment benefits recipients among higher-income households increased over 40% in April from the fairly low levels a year ago. This was the fastest increase among all cohorts and five times more than the %YoY increase for lower-income recipients.
(…) The signs of weakness in the higher-income cohort claiming unemployment benefits is paralleled by a softening in wages and salaries data in this cohort as well. Exhibit 5 shows higher-income households saw after-tax wages contract by 1.3% YoY in April 2023 on a three-month rolling basis, the second consecutive month of negative growth.
Note that our wage data seems to be weaker than the average hourly earnings (AHE) from the Bureau of Labor Statistics’ nonfarm payrolls report. Besides sample differences, one possible explanation is that workers may not be experiencing the magnitude of wage inflation suggested by AHE because their work hours are also lower than a year ago.
Another factor is that our wage data includes bonuses, which could be driving the %YoY comparison for higher-income households lower as bonuses tend to see bigger fluctuations than base pay.

This weakening in the higher-income labor market, both in jobs and pay growth, appears to be driving some divergence in spending patterns across income groups. Exhibit 6, which shows the % change for discretionary spending per household on credit and debit cards relative to October 2022 and March 2023, confirms that higher-income household discretionary spending has remained below lower- and middle-income households. Moreover, higher-income households spent less in April compared with one year ago.
Why does this matter? The highest 40% of the households by income account for over 60% of overall consumer spending. So, a labor market slowdown driven by the higher end of the income scale could have an outsized impact on the overall economy.
As of now, the labor market is beginning to soften from a very buoyant initial position, so it will likely take quite some time before the full impact on consumer spending comes through.
Against the backdrop of softer spending, one positive for consumers is that their deposit balances remain elevated. Bank of America internal data on household savings and checking balances shows the median balance remains 40 to 70% higher than the average in 2019 across all income cohorts (Exhibit 8). (…)


Note that inflation has eroded savings’ purchasing power by 17% since 2019, 19% when only considering “essentials” (food, energy and shelter), which proportionately impact lower income households more.

The “good news” is that the gap between inflation on CPI-Essentials and core inflation is closing. The bad news is that core inflation has not fallen much.
BANKING WATCH
Crescat Capital warns:
Commercial and industrial loans just had one of their worst 2-month contractions in history. The only other times we have experienced a similar problem was during the three last economic recessions. While the annual growth of business loans remains positive, it’s crucial to emphasize the short-term changes given the developments of the recent banking crisis.
At a time when corporate fundamentals are weakening and the risk of a recession is looming, financial institutions are being compelled to tighten their lending conditions.

However:
- bank loans declined post SVB but are up since mid-April through last Friday, even at small banks. Deposits have also stabilized:


- “corporate fundamentals” seem to have stopped weakening per their earnings trends.
EARNINGS WATCH
Through May. 12, 457 companies in the S&P 500 Index have reported earnings for Q1 2023. Of these companies, 76.6% reported earnings above analyst expectations and 18.6% reported earnings below analyst expectations. In a typical quarter (since 1994), 66% of companies beat estimates and 20% miss estimates. Over the past four quarters, 74% of companies beat the estimates and 22% missed estimates.
In aggregate, companies are reporting earnings that are 7.0% above estimates, which compares to a long-term (since 1994) average surprise factor of 4.1% and the average surprise factor over the prior four quarters of 4.2%.
Of these companies, 74.1% reported revenue above analyst expectations and 25.9% reported revenue below analyst expectations. In a typical quarter (since 2002), 62% of companies beat estimates and 38% miss estimates. Over the past four quarters, 71% of companies beat the estimates and 29% missed estimates.
In aggregate, companies are reporting revenues that are 2.4% above estimates, which compares to a long-term (since 2002) average surprise factor of 1.3% and the average surprise factor over the prior four quarters of 2.3%.
The estimated earnings growth rate for the S&P 500 for 23Q1 is -0.6%. If the energy sector is excluded, the growth rate declines to -2.2%.
The estimated earnings growth rate for the S&P 500 for 23Q2 is -5.6%. If the energy sector is excluded, the growth rate improves to -0.3%.
Trailing EPS are now $219.77. Full year 2023: $220.09e ($220.87 last week). Forward EPS: $224.61e ($226.28).
Significantly, guidance has been very strong:

If analysts are right, the “earnings recession” will end next in Q2, having lasted 3 quarters and shaved S&P 500 EPS 8.0% in total, a little longer and a little worse for ex-Energy earnings.

More from Refinitiv:
Q1 saw a ‘semi-v’ shaped pattern in aggregate earnings over the last three months, which saw earnings growth reach a trough of -5.2% at the start of earnings season and has since dramatically improved to -0.7%. If the remaining companies report an aggregate earnings surprise of at least 5.6%, the Q1 growth rate will turn into positive territory. If this happens, it will be the first time since 2020 Q4 where the index went from a negative growth rate at the start of earnings season and ended in the green.
Exhibit 3 displays Q1 earnings growth in terms of earnings growth contribution, which provides a clearer way to understand which sectors were driving earnings growth this quarter.
Heading into the quarter, only four sectors were expected to deliver positive earnings growth contribution which was offset by Health Care and Information Technology – this can be seen in the blue bars.
The black bars (current values) show that all sectors except for Utilities delivered stronger earnings growth this quarter. Information Technology saw the largest relative increase, followed by Consumer Discretionary and Health Care.
Exhibit 3: S&P 500 Earnings Contribution
On an absolute basis, we also show a list of the individual companies that had the largest positive (negative) earnings growth contribution this quarter (Exhibit 4).
Exhibit 4: Earnings Growth Contribution by Individual Company
Net profit margins peaked in 2021 Q2 (12.9%) and declined for six consecutive quarters to 10.7% last quarter.
The 2023 Q1 blended net profit margin (combining estimates and actuals) is currently forecasted at 11.1%, a slight tick-up from the 10.8% estimate at the start of earnings season (Exhibit 6).
Materials saw the largest increase in profit margin expectations this quarter (150 bps), followed by Information Technology (90 bps), and Consumer Discretionary (70 bps). Utilities was the only sector to see its margin decline vs. the start of earnings season (-330 bps).
At an Industry Group, Banks (180 bps) saw the largest increase this quarter, followed by Materials (150 bps), Automobile & Components (120 bps), Software & Services (120 bps), and Consumer Services (110 bps).
Utilities (-330 bps) saw the largest decrease this quarter, followed by Insurance (-130 bps), and Financial Services (-40 bps) (Exhibit 7).
Full-year 2023 expectations have remained stable since April at 11.2%, while the forward four-quarter margin has modestly improved by 10 bps to 11.3%.
From a breadth perspective, we calculate the following datapoints (of the 419 constituents that have reported earnings):
- 48.9% of constituents saw their net margin increase vs. the prior quarter.
- 13.1% of constituents saw their net margin increase for two consecutive quarters.
- 3.6% of constituents saw their net margin increase for three consecutive quarters.
- 50.6% of constituents saw their net margin decrease vs. the prior quarter.
- 26.0% of constituents saw their net margin decrease for two consecutive quarters.
- 11.2% of constituents saw their net margin decrease for three consecutive quarters.
- 4.1% of constituents saw their net margin decrease for four consecutive quarters. (…)
Exhibit 6: S&P 500 Net Profit Margin


- Positive earnings surprises of this magnitude are rarely seen when you enter a recession. (The Market Ear)
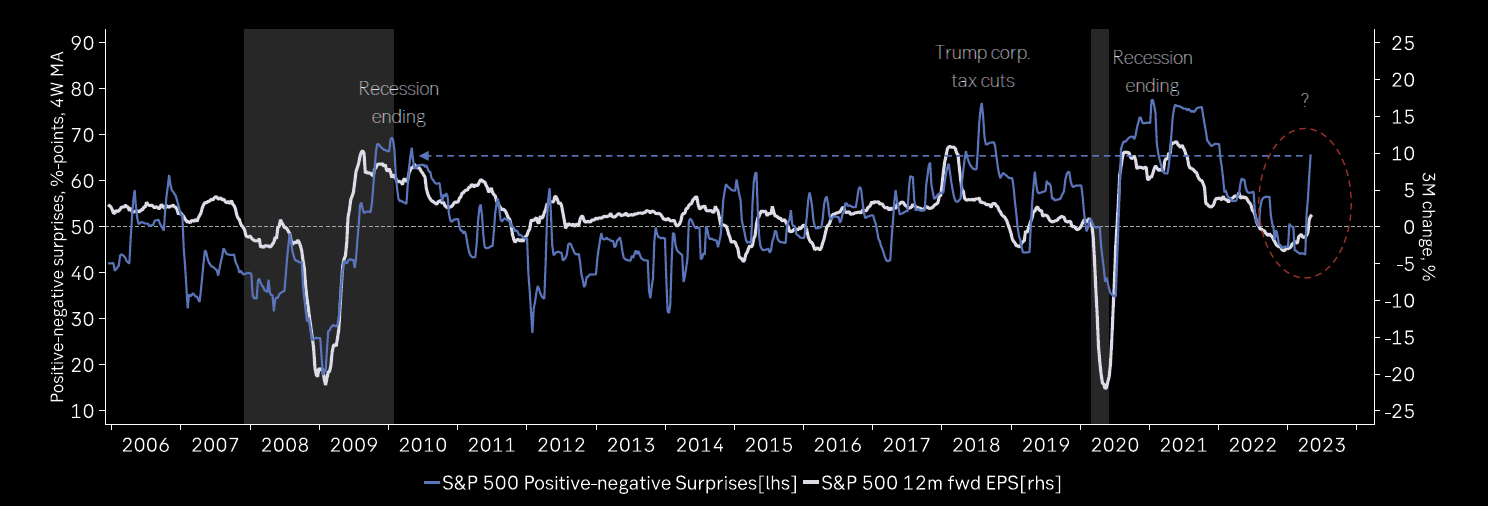
Macrobond
TECHNICALS WATCH
- The 13-34-week EMA trend:

- The 200d moving average is now rising and its 50dma has risen above it. Ned Davis Research data says that, since 1929, the S&P 500 averaged +7.35% per annum when the 200dma was rising and +2.66% when it was falling. When the 50dma is above the 200dma, the average annual gain is 8.77% vs +0.16% when it is below.

- However, the equal-weighted S&P 500 (RSP) is not showing quite the same trends:

- Since March 8 (SVB) through Friday’s close, the S&P 500 is up 3.3% while the equal-weighted index is down 3.4%.
- The Russell-to-NASDAQ 100 ratio is back to COVID crash lows

@Mayhem4Markets
-
Another area of weakness/vulnerability (in contrast to the big tech stocks — which have driven $QQQ up almost 23% YTD), has been the smallest part of the market: micro cap stocks. Basically another sign that outside of the big tech passive-flow perma-strength, all is not well. (Callum Thomas)
 Source: @TimmerFidelity
POLITICAL PARALYSIS
In his recent Thoughts from the Frontline, John Mauldin wrote:
If I had to summarize US politics and policy in one word, it would be “paralyzed.” (…) This paralysis is a function of our divided opinions, or perhaps our inability to make up our collective minds. To some degree this has always been the case, but to us it seems worse. (…)
Here’s an illustration Bruce Mehlman shared at SIC. The circles are election years since 1960 in which voters handed the House, Senate, and/or White House to a different party.
Source: Bruce Mehlman
In the 20 election years from 1960‒1998, the same party kept control of all three branches in all but 7 times. But in this century, at least one branch changed control in all but two.
Constantly changing leadership means constantly changing plans and priorities. It’s no wonder nothing is getting done, but also a problem because we have important challenges. Failure to address them means they get worse, making people even more dissatisfied. This leads nowhere good.

Using real GDP per capita, we see that the growth rate of the U.S. economy resumed its previous pace after every recessionary setback since 1960 except after the GFC. Is it just a coincidence that 9 of the last 11 elections resulted in a change in management, 7 of the last 8?

True, the 2008-09 recession was worse than the 1974-75 recession, -5.1% vs -4.2% from peak to trough, but the monetary and fiscal responses were much stronger after the GFC, which should have allowed for a swift and powerful recovery.
Some may argue that the medicine was ill-conceived, inappropriate and actually counter productive, but Mehlman’s point of a lack of vision and direction due to constant management changes is certainly not without merit, is it?
Every American is directly and personally impacted: real GDP per capita, which measures the wealth of the average citizen, has grown 1.7% per year between 2010 and 2019, 26% slower than the 2.3% consistent CAGR achieved between 1960 and 2007.
Were USA Inc. a listed stock, its P/E would merit a discount.
Per Gallup, only 16% of Americans currently approve the way Congress is handling its job, down from 47% at the trough of the 1974 recession.
To another question, “How much trust and confidence do you have at this time in the legislative branch, consisting of the U.S. Senate and House of Representatives — a great deal, a fair amount, not very much or none at all?”, 62% answered “not very much” (39%) or “none at all” (23%). That compares with 35% at the trough of the 2001 recession.
The American public knows there is a problem…but can’t seem to effectively deal with.
- Howard Marks: “Now, we are faced with the possibility of having an election where the majority of Democrats don’t want Biden, the majority of the Republicans don’t want Trump, and the majority of Americans don’t want a Biden-Trump election.”