U.S. Retail Sales Fell 1.1% in July Sales are well above pre-pandemic levels, but spending on goods retreated over the month.
Excluding autos—a category where supply-chain issues have limited available inventory—sales declined 0.4%. (…)
Restaurants and bars were a bright spot, with sales rising 1.7% over the month, while sales at nonstore retailers—a proxy for online retail sales—fell 3.1%. (…)
Sales in July were about $91.9 billion, or 17.5%, higher than in February 2020, just before the pandemic’s onset in the U.S. (…)
Note that June’s 0.7% gain was revised from +0.6% and May’s 1.4% decline was revised from -1.7%.
From Haver Analytics:
Sales in the retail control group, which excludes autos, gas stations, building materials and food services, fell 1.0% in July (+10.2% y/y) after rising 1.4% during June, revised from 1.1%.
Motor vehicle purchases declined 3.9% (+15.7% y/y) after falling 2.2% in June, revised from -2.0%. The weakening compares to a 4.5% drop (+0.3% y/y) in unit sales of light vehicles.
Here’s the Control Sales chart indexed at February 2020 = 100 against total sales, up 18.3% and 18.7% from Feb. 2020 respectively. Sales are levelling off but at a very high level.

The same chart but including Food Services (restaurants and bars) show that sales are 16.5% above Feb. 2020 and still up-trending (+3.7% a.r. in last 3 months):

Chase’s spending tracker (through Aug. 13) suggests that August sales are improving from July:


- Walmart Earnings Show Sales Rose as Shoppers Returned to Stores The retail giant logged another quarter of rising U.S. sales even as its online growth slowed, at a time when retailers are navigating rising costs, supply chain snarls and an uptick in Covid-19 cases in many parts of the country.
Comparable sales, those from U.S. stores and digital channels operating for at least 12 months, rose 5.2% in the quarter ended July 30 compared with the same period last year. U.S. e-commerce sales rose 6% from a year ago, when Covid restrictions kept many people home.
(…) Sales increased each month through the quarter, with July the strongest month, Walmart said.
The recent rise of the Delta variant hasn’t left “any meaningful impact” nationally on the business, said Walmart Chief Financial Officer Brett Biggs, in an interview. In some regions shoppers are wearing masks more often in stores, but overall stores remain busy with back-to-school shopping, he said. (…)
At Walmart, the latest quarterly sales and profits exceeded Wall Street’s estimates. For its fiscal year, Walmart forecast continued sales gains for the back-to-school and holiday shopping seasons. U.S. comparable sales will rise 5% to 6% for the year, Walmart said. (…)
The retailer is dealing with “a bit more cost inflation than normal,” Mr. Biggs said on a conference call Tuesday. “Our merchants are working with suppliers and monitoring price gaps to keep prices low while managing margins,” he said. It’s also working to navigate supply chain challenges by “adding extra lead time to orders and chartering vessels specifically for Walmart goods,” he said. Still, some items continue to be hard to find on shelves, he said. (…)

Average gasoline prices across the country are $3.17 per gallon, up 45.7% since last year and are currently at a 7-year high.
Even with oil prices hovering around $70 per barrel, demand for gasoline has also recovered from pre-pandemic levels. According to the EIA, gasoline demand is approximately 9.1 million barrels per day (bpd), up from 5.8 bpd in May 2020.
Last week, The White House recommended that OPEC increase oil production to curb gasoline prices for consumers. OPEC has already announced a series of production increases in July which will increase production by 400k bpd starting in August.
Using Refinitiv Datastream, we can go one step further to assess how much spare capacity OPEC currently has today. Looking at Exhibit 1, OPEC oil production capacity in August is 33.5m bpd. However, of that capacity, only 27.8m bpd is currently being produced, which results in approximately 5.7 million bpd that is currently offline.

U.S. Home Builders Index Moves Lower in August
The Composite Housing Market Index from the National Association of Home Builders-Wells Fargo declined 6.3% (-3.8% y/y) during August to 75 from 80 in July. An unchanged level of 80 was expected in the INFORMA Global Markets survey. The seasonally-adjusted index was 16.7% below the record high reached in November 2020. Over the past 15 years, there has been a 65% correlation between the y/y change in the home builders index and the y/y change in new plus existing home sales.
Performance amongst the composite index’s three sub-series was mixed this month. The index of present sales conditions fell 5.8% (-3.6% y/y) to 81 from 86 in July. The level was 15.6% below last November’s record high of 96. The index of expected sales over the next six months held steady (+3.8% y/y) at 81. The index measuring traffic of prospective buyers weakened 7.7% (-6.3% y/y) to 60, the lowest level since July of last year. The index was 22.1% below the cycle high of 77 in November 2020.
Performance within the four regions of the country was mixed this month. The index for the Northeast rose 4.1% and was unchanged y/y. That followed five straight monthly declines. The index for the West improved 1.2% (-3.4% y/y), the first increase in four months. The index for the South dropped 7.2% (-2.5% y/y) and was 14.4% below the November high. For the Midwest, the index fell 8.6% (-7.2% y/y) after holding steady in July. These regional series begin in December 2004.
It seems that many builders are restricting sales because of supply bottlenecks but traffic has declined below pre and post-pandemic trends. Not good.

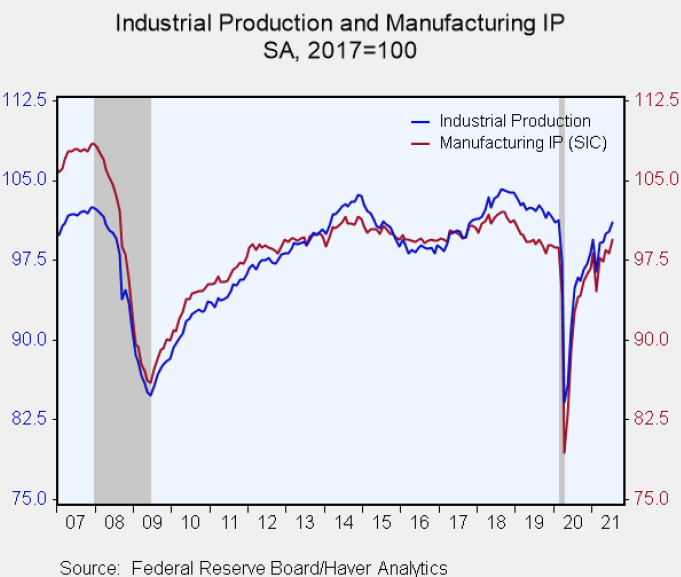
U.S. Industrial Production Has Broad-based Advance
Industrial production rose 0.9% (6.6% y/y) in July after increasing 0.2% in June, which was revised from 0.4%. The Action Economics Forecast Survey consensus looked for 0.5% in July.
Manufacturing output advanced 1.4% (+7.4% y/y) last month following a 0.3% decline in June, which was revised from -0.1%. Motor vehicle production rebounded 11.2% (-6.9% y/y) after a 5.9% decline in June, revised from -6.6%. Shortages of semiconductors continued to limit motor vehicle production, but the July production increase reflected fewer motor vehicle plant closings then than are typical in July. Excluding the motor vehicle sector, factory output rose 0.4% (+7.4% y/y) after a 0.5% rise. In other durable goods industries, production of electrical equipment, appliance & component surged 2.3% in July (+7.7% y/y), more than reversing June’s 1.8% decline. Machinery output increased 1.9% after being unchanged in June.
In the nondurable goods sector, production rose 0.3% last month (7.3% y/y) following a 0.1% decline in June; that was revised from a 0.2% increase. (…)
Utilities production decreased 2.1% (-3.8% y/y) in July, reversing June’s 3.1% increase. Electric power output fell 2.7% (-4.0% y/y) while natural gas distribution rose 1.2% (-2.6% y/y. Mining output increased 1.2% (12.1% y/y) after a 0.5% rise in June.
Capacity utilization rose to 76.1% in July from 75.4% in June. July’s number was again the highest since 76.3% in February 2020. The Action Economics Forecast Survey expected 75.7%. In manufacturing, utilization rebounded to 76.6% in July from 75.5% in June. Factory sector capacity rose 0.1% y/y.

ING:
(…) while costs have certainly gone up, there is growing evidence that manufacturers are able to pass them onto customers given strong order books and the knowledge that their customers have record low inventory levels. While good news for profitability, it is a key factor that could keep inflation higher for longer.
")
N.Y. Fed’s Business Leaders Survey
Business activity continued to increase significantly in the region’s service sector, according to firms responding to the Federal Reserve Bank of New York’s August 2021 Business Leaders Survey. The survey’s headline business
activity index fell fourteen points to 27.8, pointing to a slower pace of growth than the record-setting pace of the prior few months. (…) Employment levels and wages continued to rise at a solid clip. Both the prices paid and prices received indexes remained elevated. Capital spending increased slightly, and firms expected to increase capital spending significantly in the coming months.Looking ahead, firms remained optimistic that conditions would improve, with the index for future employment holding near its record high, though optimism was
lower than last month. (…)The employment index moved up four points to 20.3, pointing to a moderate increase in employment levels. The wages index climbed five points to 47.2, signaling a pickup in wage growth.
Price indexes remained elevated: the prices paid index rose five points to 73.1, and the prices received index was little changed at 31.0. (…)
Wages and prices were expected to continue to rise significantly, and capital spending plans remained solid.
Expectations six months ahead:


In a supplemental question,
Businesses were also queried on changes in the flow of job applicants since May. Considerably more respondents have seen a decrease than an increase in the flow of applicants per job, especially among manufacturers.

Cargo Ships Are Again Idling Off Jammed Southern California Ports Dozens of container ships are anchored off the ports of Los Angeles and Long Beach. A crush of advance orders from U.S. manufacturers and retailers is contributing to the bottlenecks.
(…) Just a couple of months ago, the number of container ships at anchor in the two ports, which together handle more than a third of all U.S. seaborne imports, had dwindled to nine. In normal times, the number is one, or none. (…)
The crush of imports is overwhelming Southern California warehouses, driving up rents and making space harder to find. (…)
Jerome Powell Says It’s Unclear What Covid-19 Surge Means for Economy ‘The Covid pandemic is still casting a shadow on economic activity,’ the Fed chairman says
Housing Market Tightens in Canada After 4th Monthly Sales Drop
Transactions fell 3.5% in July, with new listings dropping 8.8%, according to data released Monday from the Canadian Real Estate Association. That caused the national average home price to rise 0.3% to around C$669,200 ($532,600), while the ratio of sales to new listings, a measure of market tightness, rose to 74% from 70% the previous month. (…)
The decline in listings was seen across Canada’s major cities, including Toronto, Montreal and Vancouver, with new supply down in about three quarters of the country’s markets, the data show. But despite this tightening, and the resulting drop in activity from the previous month, July home sales were still well above the average from the last 10 years.

TECHNICALS WATCH
Yesterday was not good for most of the technical indicators that I follow, particularly selling vs buying volume. Defense is the better strategy at this time.
Despite new highs in many of the major U.S. equity indexes, the old school NYSE Advance/Decline Line hadn’t made a fresh high for over two months.
It’s worse on the Nasdaq.
On Monday, the Nasdaq Composite closed within 1% of a 52-week high, and yet two long-term measures of breadth on that exchange fell to very low levels. The McClellan Summation Index closed below -350, and the New High / New Low Ratio was below 30%. Those are the worst figures in history, dating back to 1986, for a day when the Composite was so near a high.
This internal tumult has been triggering some technical warning signs, such as the Hindenburg Omen and Titanic Syndrome for the Nasdaq exchange.
Over the past 30 sessions, a combined 13 signals have been triggered, the most in six years.
When there has been such a cluster of signals with the Composite within spitting distance of a new high, trouble was brewing most of the time. The Nasdaq escaped any damage in 1996, 1999 (for a while), and 2016 but otherwise witnessed high volatility and negative returns.
After the speculative blow-off in late January – early February of this year, we’ve been on the lookout for major deterioration under the surface of the indexes. There have been periodic bouts of that since then, and the indexes have almost immediately recovered. We’ll have to see if this is yet another episode.

China Eyes Wealth Redistribution in Push for ‘Common Prosperity’
President Xi Jinping put China’s wealthiest citizens on notice Tuesday, offering an outline for “common prosperity” that includes income regulation and redistribution, according to state media reports.
Since Xi took office in 2012, the ruling party has made it a priority to end poverty and build a moderately prosperous society, goals that the party sees as central to promoting well-being and strengthening its governance. Income inequality in the country is wide — the richest 20% earn more than 10 times poorest 20% — and hasn’t budged since 2015. (…)
Officials vowed to “strengthen the regulation and adjustment of high income, protect legal income, reasonably adjust excessive income, and encourage high-income groups and enterprises to give back to society more,” according to a summary of the meeting published by state media Xinhua. (…)
It also reaffirmed Deng Xiaoping’s famous words, to “let some people get rich first,” adding that an environment will be created where more people have the opportunity to become wealthy.
Economists say the moves suggest Beijing may be moving closer toward introducing taxes on property and inheritance. Authorities have long talked about a property tax and have tested taxing residential property in Shanghai and Chongqing since 2011. A high-level meeting in May indicated officials may be making a renewed push to implement it. (…)
(…) Only a minority of Americans holds assets beyond homes, cars and retirement savings. About 15% of households own stocks and 13% hold business equity or other residential property, according to Fed data. (…)
Fed officials, economists and central bankers have convened annually at Jackson Hole [the country’s wealthiest county] in August since the 1980s to discuss economic policy. The topic of this year’s gathering is “Macroeconomic Policy in an Uneven Economy,” as the Fed has focused more during the pandemic on the issues of economic inequality.

- American CEOs make 351 times more than workers. In 1965 it was 15 to one Rather than address stagnant wages for hourly workers and yawning inequality, corporations are blaming a ‘labor shortage’ (The Guardian)