The Bond Market Is Sending a Worrying Message About the Economy Fixed-income investors don’t think the Fed can rein in inflation without stalling the recovery.
(…) The biggest market action has been a surge in two-year U.S. Treasury yields, which have more than doubled this year, from 0.7% to just over 1.5%. Longer-term rates are going up, too, but much less dramatically, with the 10-year Treasury yield climbing above 2% this month for the first time since well before the Covid-19 lockdowns. (…)
The pattern we’re seeing now of short-term yields up sharply while longer-term yields remain fairly low—a flattening yield curve, in bond parlance—suggests a cooling economy in the years ahead. If the trend continued and short-term rates rose above the longer-term ones, creating what’s known as an inverted yield curve, that would be a strong signal of an impending recession. (…)
Treasuries are in the red so far in 2022, creating a risk for the first back-to-back annual losses since at least the early 1970s, according to Bloomberg’s U.S. Treasury index. And there could be more losses ahead. In the last tightening cycle, the Fed lifted its key rate to 2.5% before calling it quits. Some bond managers think that might not be high enough this time around. (…)
Some Wall Street strategists think inflation is so embedded in the economy that the Fed will have trouble hitting its goal without causing serious pain. The Fed “might not have the option of being measured in their tightening,” says Bob Miller, head of Americas fundamental fixed income at BlackRock Inc. “The question we are asking is: Can they execute a soft landing and extend the cycle? The concern is that they are sufficiently late in tightening and should have begun six months ago.” (…)
- Bullard Says Fed May Need to Raise Rates Above 2% to Curb Prices Federal Reserve Bank of St. Louis President James Bullard said bringing down inflation may require the central bank to overshoot a neutral target interest rate, which he sees as about 2%.
- Can Jay Powell build consensus at a divided Federal Reserve? After a united front during the pandemic, officials are split over how aggressively to raise rates
Bloomberg: “Trend-wise, we’re still in a bull market for Treasuries.”

- Trend-wise, the bull market on core inflation might also have ended…

- Combining both charts, we get unusually negative real 10Y yields:

Only seen in 1975 and 1980 when QEs and QTs did not exist.

U.S. Jobless Claims Edge Up but Remain Low in Tight Labor Market Economists expect employers to continue holding on to workers
Initial jobless claims, a proxy for layoffs, increased to a seasonally adjusted 248,000 last week from 225,000 a week earlier, the Labor Department said Thursday. The four-week moving average, which smooths volatility, fell slightly to 243,250. (…)
Continuing claims, a proxy for the total number of people receiving unemployment benefits through regular state programs, declined to 1.59 million for the week ended Feb. 5 from 1.62 million a week earlier. Continuing claims are reported with a one-week lag. (…)
U.S. Housing Starts Decline in January
Housing starts declined 4.1% (+0.8% y/y) during January to 1.638 million (SAAR) from 1.708 million in December, revised from 1.702 million. It was the lowest level of starts in three months. The Action Economics Forecast Survey expected 1.700 million starts during January. Data for 2021 were revised.
Starts of single-family units declined 5.6% (-2.4% y/y) in January to 1.116 million from 1.182 million in December. It also was the lowest level since October. Multi-family housing starts eased 0.8% (+8.3% y/y) to 522,000 from 526,000. The latest level remained near the highest since February 2020.
By region, housing starts in the Northeast rose 2.6% (-41.2% y/y) in January to 120,000. Starts in the Midwest fell 37.7% (-4.3% y/y) to 200,000. In the South, housing starts eased 2.0% (+8.5% y/y) to 880,000. Starts in the West increased 17.7% (9.2% y/y) to a near record 438,000.
Building permits edged 0.7% higher (0.8% y/y) to 1.899 million from 1.885 million in December. It was the highest level of permits since May 2006. Permits to build single-family homes gained 6.8% (-5.0% y/y) in January to 1.205 million units. Permits to build multi-family homes fell 8.3% (+12.8% y/y) to 694,000.


- Currently there are 785 thousand single family units under construction (SA). This is the highest level since December 2006. Currently there are 758 thousand multi-family units under construction. This is the highest level since July 1974! For multi-family, construction delays are probably also a factor. The completion of these units should help with rent pressure. Combined, there are 1.543 million units under construction. This is the most since September 1973. (CalculatedRisk)
Mortgage Rates Close In on 4%, Making Home Affordability Tougher The average rate for a 30-year fixed-rate loan was 3.92% for the week ended Thursday, the highest since May 2019.
Philly Fed Manufacturing Survey (collected from February 7 to February 14)
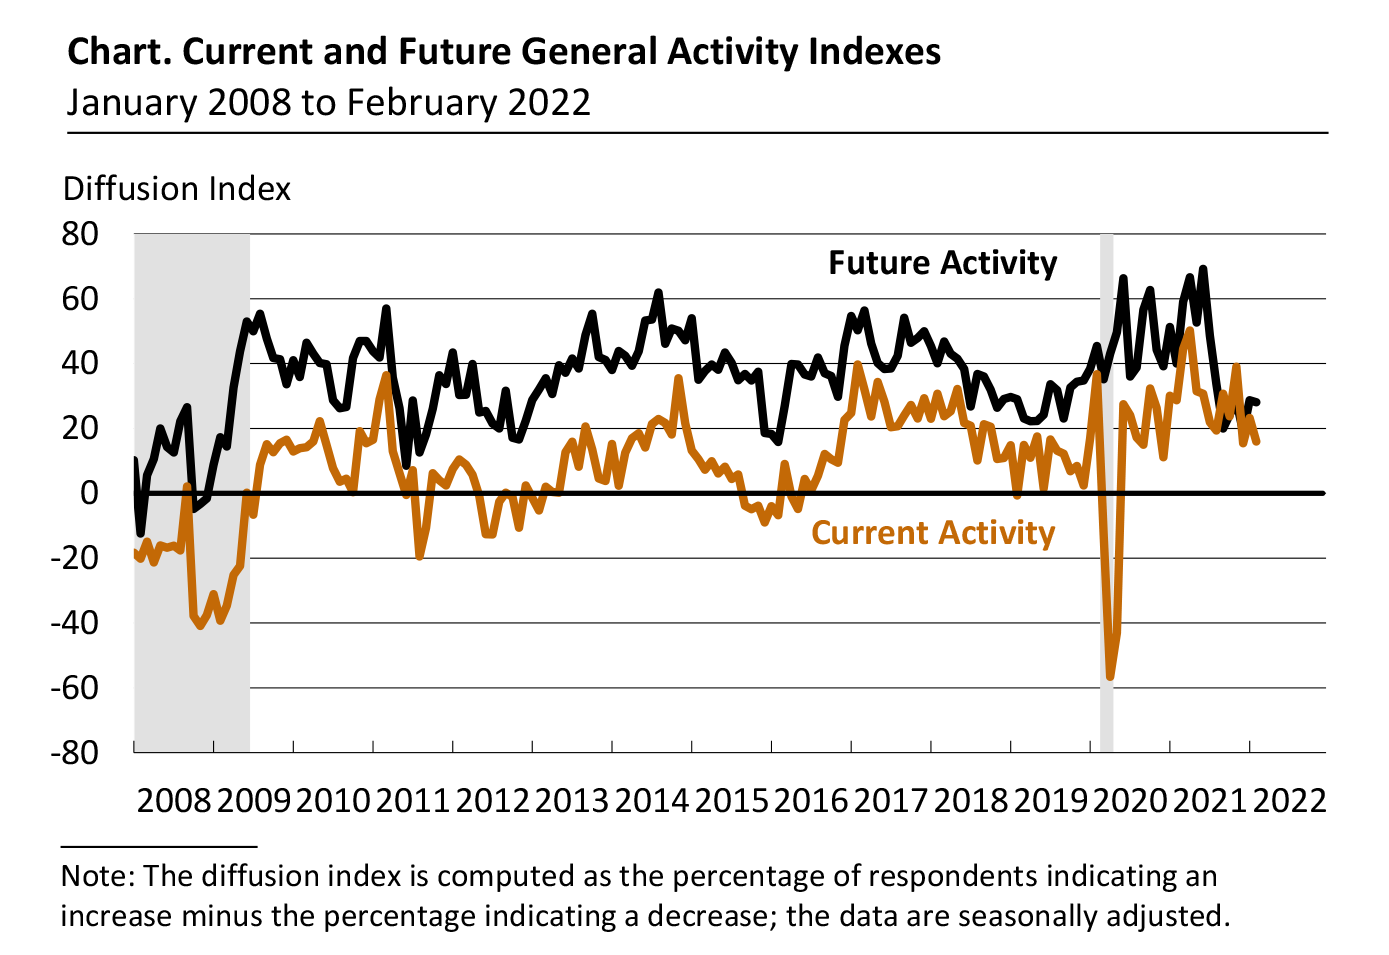
(…) The firms continued to report increases in prices for inputs and their own goods. The prices paid diffusion index edged down 3 points to 69.3. Nearly 74 percent of the firms reported increases in input prices, while 5 percent reported decreases. The current prices received index increased 3 points to 49.8. More than 54 percent of the firms reported increases in prices of their own manufactured goods, while 4 percent reported decreases.
In this month’s special questions, the firms were asked to forecast the changes in prices of their own products and for U.S. consumers over the next four quarters. Regarding their own prices, the firms’ median forecast was for an increase of 5.0 percent, down slightly from 5.3 percent when the question was last asked in November. The firms’ reported own price change over the past year was 5.0 percent.
The firms expect their employee compensation costs (wages plus benefits on a per employee basis) to rise 5.0 percent over the next four quarters, a slight increase from 4.8 percent in November. When asked about the rate of inflation for U.S. consumers over the next year, the firms’ median forecast was 5.0 percent, the same as in November. The firms’ median forecast for the long-run (10-year average) inflation rate was 3.0 percent, a decrease from 3.5 percent in November.

There’s More Than Ukraine. How About a China Pivot? While we’re all nervous about this crisis, we still need to keep an eye on issues that are likely to outlast it.
(…) The case for a more lenient policy is bolstered, in the mind of many investors, by the ongoing problems for real estate finance. The difficulties of China Evergrande Group have left the headlines of late, for good reason. But real estate-backed high yield bonds are falling again. Their collapse, following a decade of liquidity-fueled expansion, has been spectacular:
[But] actions to date don’t suggest an actual pivot. Mike Howell of CrossBorder Capital in London, who I cited earlier this week, points out that there is no sign as yet of any new liquidity, once you look through the usual distortions in Chinese data caused by the Lunar New Year celebrations:


TECHNICALS WATCH
Yesterday, selling was intense and broad-based, accelerating during the day.
At yesterday’s close, all S&P 500 stocks are down from their 52-week high, average decline: -15.1%, median decline: -13.4%. The ten largest stocks, 31% of the index, are down 15.8% on average, -9.4% YtD.
By comparison, the Russell 2000 is down 17.7% from its 52-w high and 9.6% YtD.
This is now a broad correction from which nobody can really hide.
All major indices are trading below their 200-d m.a. with only the larger cap indices still showing rising 200dmas.
The S&P 500 Large Cap Index – 13/34–Week EMA Trend is threatening more damages:

So is the NDX:

This is when high margin debt could kick in…
Jill Mislinski at Advisor Perspectives has this chart showing margin debt and the S&P 500 in real terms — adjusted for inflation to today’s dollar using the Consumer Price Index as the deflator. The latest debt level is down 8.8% month-over-month.

Lance Roberts explains the nasty dynamics when margin calls arrive:
The issue with margin debt, in particular, is that the unwinding of leverage is NOT at the investor’s discretion. It is at the discretion of the broker-dealers that extended that leverage in the first place. (In other words, if you don’t sell to cover, the broker-dealer will do it for you.) When lenders fear they may not recoup their credit-lines, they force the borrower to either put in more cash or sell assets to cover the debt. The problem is that “margin calls” generally happen all at once, as falling asset prices impact all lenders simultaneously.
Margin debt is NOT an issue – until it is. (…)
We have seen margin liquidation events twice in the last 15-years. The first was during the 2008 financial-crisis that forced Lehman into bankruptcy.
The second time was in March of 2020.


 More supply problems via Bloomberg:
Anybody order a Porsche? About 1,000 of them are estimated to be among some 4,000 vehicles left adrift on a burning cargo ship. The massive Felicity Ace was carrying thousands of Volkswagen cars when it caught fire near the Azores islands in the Atlantic Ocean. The 22 crewmembers were evacuated. But the cargo may be lost.
