 Travelling day. Actually, they will all be travelling days for a few weeks. Will post when possible.
THE MANUFACTURING PMIs
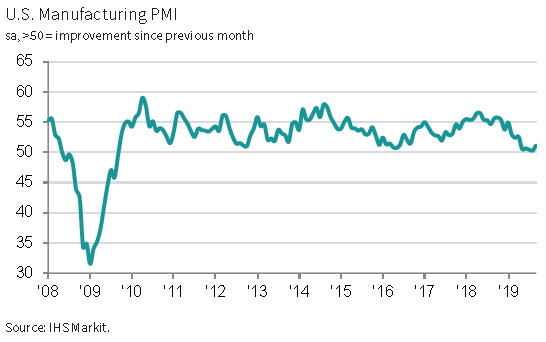
September PMI data indicated a marginally faster rate of improvement in the health of U.S manufacturing, though the overall picture remained one of a struggling goods producing sector that has suffered its worst quarter since 2009. Expansions in production and new orders remained only modest, meaning firms were encouraged to increase their workforce numbers only tentatively. Business confidence remained relatively gloomy due to muted demand conditions. Although rates of both input cost and selling price inflation quickened, they remained historically subdued following a drop in demand for inputs and widespread efforts to stay competitive.
The seasonally adjusted IHS Markit final U.S. Manufacturing Purchasing Managers’ Index™ (PMI™) posted 51.1 in September, broadly in line with the earlier flash reading of 51.0, and up from 50.3 in August to signal a slightly stronger end to the third quarter for the U.S manufacturing sector. That said, the quarterly average indicated the worst performance across the sector since the same period in 2009. Moreover, the latest data signalled only a slight improvement in operating conditions across the sector.
Driving the headline PMI figure higher was a quicker rise in production in September. The modest upturn was the fastest since April following reports of slightly stronger client demand and efforts to clear backlogs. Nonetheless, the rate of expansion was below the series trend.
The upturn in new business accelerated from August’s recent low. New order growth was attributed to an increase in domestic client demand and efforts to price competitively. That said, the upturn was only moderate as a fall in foreign client demand weighed on total sales. The decline in export sales was the second-fastest for nearly five years. Ongoing trade wars also reportedly exacerbated difficult external demand conditions.
Subsequently, firms increased employment marginally in response to greater production requirements. The rise in staffing levels also came alongside a faster fall in backlogs of work. Although tentative towards their output expectations for the coming 12 months, firms expressed a greater degree of confidence in September. The level of optimism reached a three-month high but remained relatively subdued overall.
Meanwhile, cost burdens increased moderately. The faster pace of inflation was linked to the impact of tariffs, although a drop in demand for inputs kept cost rises relatively muted. Similarly, output charges rose modestly, as firms sought to pass on higher costs, whilst maintaining efforts to be competitive.
In line with subdued demand conditions, input buying fell for a third month running. Firms also stated that weak demand had led to greater efforts to run down stocks. Despite a decline in purchasing, supplier performance deteriorated further as firms increasingly reported a change to domestic suppliers, due to tariffs, with vendors struggling to deliver goods to manufacturers amid capacity issues.
The US ISM survey was more downbeat and totally spooked investors:
The September PMI® registered 47.8 percent, a decrease of 1.3 percentage points from the August reading of 49.1 percent. The New Orders Index registered 47.3 percent, an increase of 0.1 percentage point from the August reading of 47.2 percent. The Production Index registered 47.3 percent, a 2.2-percentage point decrease compared to the August reading of 49.5 percent. The Employment Index registered 46.3 percent, a decrease of 1.1 percentage points from the August reading of 47.4 percent. The Supplier Deliveries Index registered 51.1 percent, a 0.3-percentage point decrease from the August reading of 51.4 percent. The Inventories Index registered 46.9 percent, a decrease of 3 percentage points from the August reading of 49.9 percent. The Prices Index registered 49.7 percent, a 3.7-percentage point increase from the August reading of 46 percent. The New Export Orders Index registered 41 percent, a 2.3-percentage point decrease from the August reading of 43.3 percent. The Imports Index registered 48.1 percent, a 2.1-percentage point increase from the August reading of 46 percent. (…)
Of the 18 manufacturing industries, three reported growth in September: Miscellaneous Manufacturing; Food, Beverage & Tobacco Products; and Chemical Products. The 15 industries reporting contraction in September — in the following order — are: Apparel, Leather & Allied Products; Printing & Related Support Activities; Wood Products; Electrical Equipment, Appliances & Components; Textile Mills; Paper Products; Fabricated Metal Products; Plastics & Rubber Products; Petroleum & Coal Products; Primary Metals; Transportation Equipment; Nonmetallic Mineral Products; Machinery; Furniture & Related Products; and Computer & Electronic Products.
National Bank Financial:
(…) The last time the ISM manufacturing sank that low, outside of a recession, was in 2003. While we acknowledge the ongoing trade war is wreaking havoc and weighing significantly on factories worldwide, we advise caution in interpreting September’s U.S. ISM manufacturing index. Note that another survey released this morning, Markit’s purchasing managers index, suggested that U.S. manufacturing was not only in expansion in September but also growing at the fastest pace in five months! Why are those two surveys saying different things? For starters, they have different panel sizes, with Markit surveying more companies than the ISM. The ISM index also tends to cover larger companies and would therefore have been more impacted than Markit’s measure by the strike at General Motors during September, a temporary event in any case. But even assuming manufacturing is as bad as the ISM is suggesting, that would not necessarily mean the U.S. economy as a whole is in recession. As today’s Hot Chart shows, we’re still well above the 42.9 mark which even the ISM says “generally indicates an expansion of the overall economy”. So, while manufacturing woes are not good news, they do not preclude continued expansion of the U.S. economy.

Markit vs ISM: the former is generally a better reflection of actual trends.

Picture source: Renaissance Macro (via Isabelnet)
-
China PMI signals modest improvement in operating conditions
China’s manufacturing sector saw a modest improvement in overall operating conditions during September. Production and total new orders both expanded at quicker rates than in August, despite a further reduction in new export business. Staffing levels were broadly unchanged, however, leading to a stronger increase in backlogs of work. At the same time, firms expanded their buying activity and inventories, albeit at marginal rates. Currency movements meanwhile contributed to a renewed rise in average input costs, while prices charged were broadly stable after a two-month sequence of discounting.
Chinese goods producers continued to express a relatively subdued level of confidence towards future output, as worries persisted over the outcome of the ongoing China-US trade negotiations.
The headline seasonally adjusted Purchasing Managers’ Index™ (PMI™) posted 51.4 in September, up from 50.4 in August, to signal an improvement in the health of the sector for the second month running. Though modest overall, the pace of improvement was the quickest seen since February 2018.
The increase in the headline figure was partly driven by a faster rise in overall new work. The latest upturn in new orders, though modest, was the quickest since March 2018. Underlying data continued to signal that the increase was supported by firmer domestic demand, as new work from abroad continued to decline. That said, the latest reduction in new export orders was only slight. Companies often commented that the ongoing China-US trade dispute had continued to dampen foreign sales.Higher volumes of total new work led firms to expand production again in September. The rate of growth was the fastest seen since August 2018.
Employment across China’s manufacturing sector was broadly unchanged for the second month running. Stagnant payrolls and rising orders contributed to a further increase in the amount of outstanding business at Chinese goods producers. Notably, the rate of accumulation was the steepest seen since the start of 2018.
Latest data indicated that firms were relatively cautious towards buying activity and inventories. Although input buying rose for the third month running, the rate of growth remained marginal overall. As a result, stocks of purchased items also expanded only slightly. Stocks of finished goods rose marginally for the second month running.
After declining in August, average input costs rose at the end of the third quarter. The rate of increase was modest overall, with a number of panel members blaming the rise on unfavourable exchange rate movements and higher raw material costs. Output charges were meanwhile broadly unchanged compared to the previous month.
Optimism towards the one-year outlook for output remained relatively weak in September, with concerns over future trade conditions commonly cited by panel members.

(…) China’s official manufacturing purchasing managers index rose to 49.8 in September from 49.5 in August, the National Bureau of Statistics said Monday. This is the fifth straight month that the index has stayed below the 50-mark, indicating a contraction in activity. (…)
A subindex measuring total new orders rose above the 50-mark for the first time since May as domestic demand increased. New export orders improved, but remained in contraction territory. (…)
Meanwhile, a pullback in China’s property sector appears to be under way, with construction activity cooling sharply in September. China’s official nonmanufacturing PMI edged down to 53.7 in September from 53.8 in August, the National Bureau of Statistics said Monday. Its subindex measuring construction activity fell sharply to 57.6 in September from 61.2 in August, while the service subindex held up well.
The property sector, including home sales and investment, has been a lone bright spot in the economy. But it has come under pressure after Chinese leaders said they wouldn’t resort to property easing as a stimulus measure. Financial regulators in recent months also have tightened financing for both property developers and home buyers to rein in speculation. (…)
-
Japan PMI finishes third quarter at a seven-month low
This is Markit’s summary. Full pdf from the headline.
PMI data suggest that the Japanese manufacturing sector ended the third quarter on a negative footing, with the headline index at its lowest mark since February. Crucially, the stronger deterioration comes ahead of the consumption tax hike, and suggests that manufacturing and exports are both likely to have been drags on third quarter GDP.
Japan continues to suffer from the trade-led global growth slowdown. While new product launches, particularly in the tech and capital goods space, provide some mild reason for optimism, concern of trade frictions being drawn out further are underpinning a cautious approach.
Strength in the trade-weighted yen so far this year has also meant that the currency has not been able to mitigate the impact of the global trade slowdown. To that end, the service sector’s ability to weather the sales tax hike in the fourth quarter will be crucial to keeping the economy afloat into the year-end.

Global Manufacturing PMI signals further deterioration in September
The global manufacturing sector deteriorated further in September, but edged closer to stabilisation. This was signalled by the J.P.Morgan Global Manufacturing PMI™ – a composite index produced by J.P.Morgan and IHS Markit in association with ISM and IFPSM – rising for the second month running to 49.7. Although still below the neutral mark of 50.0 that separates improvement from deterioration, it was the highest reading since May.
Downturns continued in the intermediate and investment goods sub-industries during September, with both seeing contractions in production and new order intakes. The consumer goods industry fared better, as output and new business both moved higher.
National PMI data signalled deteriorations in overall business conditions in 15 of the countries covered. Among the larger industrial regions, growth was registered in both the US and China. In contrast, Japan saw further contraction while the downturn in the euro area deepened. The rate of decline in the eurozone was the fastest in almost seven years, mainly due to a sharp deterioration in the performance of Germany.
Global manufacturing production was broadly stagnant in September, as reduced intakes of new business discouraged any meaningful expansion of output volumes. The trend in international trade flows also remained weak, as new export orders declined for the thirteenth consecutive month. The US, China, Germany and Japan were among the many nations to report a decrease in new export business.
September saw a further mild decrease in global manufacturing employment. Job losses have now been registered for five successive months. Reductions in the intermediate and investment goods sectors more than offset marginal jobs growth at consumer goods producers.
Price pressures remained broadly contained in the global manufacturing sector during September. Although input costs rose at a faster pace, the rate of inflation remained below its long-run survey average for the ninth successive month. Average selling prices were unchanged, following a mild decrease in August.
Business optimism was unchanged from August’s series record low in September. Consumer goods producers were the most optimistic about the future, followed by the intermediate goods category. Positive sentiment was lowest in the investment goods industry.


Deere to lay off 163 U.S. workers as U.S.-China trade war dents equipment demand
UAW rejects new GM offer as strike forces 6,000 Mexico layoffs The United Auto Workers union said on Tuesday it rejected a new comprehensive offer from General Motors Co to end a two-week-old strike, saying the automaker came up short on several fronts including wages, healthcare and temporary workers.
Manhattan apartment price slump worsens Third quarter decline was worst in almost a decade, with luxury market hit hardest
 U.S. Light Vehicle Sales Remain Healthy
The Autodata Corporation reported that sales of light vehicles during September improved 0.9% (-0.6% y/y) to 17.23 million units (SAAR) from 17.07 million during August. The increase left the average level of sales during Q3’19 at 17.06 million units. That equaled Q2 but remained below the Q3’15 peak of 17.96 million units.
Sales of light truck sales rose 1.1% last month (4.0% y/y) to 12.43 million units. (…) Auto sales edged 0.2% higher (-11.0% y/y) to 4.79 million. (…)
Trucks’ share of the U.S. light vehicle market increased to a record 72.1%, up from a low of 48.8% during all of 2012.
Imports’ share of the U.S. vehicle market declined to 21.7%, the lowest since December. Imports’ share of the passenger car market fell sharply to 28.2%. Imports share of the light truck market eased to 19.3%, but remained up from the 12.1% low in April 2014.
(…) About a third of auto loans for new vehicles taken in the first half of 2019 had terms of longer than six years, according to credit-reporting firm Experian PLC. A decade ago, that number was less than 10%. (…)
For many Americans, the availability of loans with longer terms has created an illusion of affordability. It has helped fuel car purchases that would have been out of reach with three-, five- or even six-year loans. (…)
Just 18% of U.S. households had enough liquid assets to cover the cost of a new car, according to a Wall Street Journal analysis of 2016 data from the Fed’s triennial Survey of Consumer Finances, a proportion that hasn’t changed much in recent years.
Even a conservative car loan often won’t do it. The median-income U.S. household with a four-year loan, 20% down and a payment under 10% of gross income—a standard budget—could afford a car worth $18,390, excluding taxes, according to an analysis by personal-finance website Bankrate.com.
But the size of the average auto loan has grown by about a third over the past decade to $32,119 for a new car, according to Experian. To keep payments manageable, the car industry has taken to adding more months to the end of the loan.
The average loan stretches for roughly 69 months, a record. Some last much longer. In the first half of the year, 1.5% of auto loans for new vehicles had terms of 85 months or longer, according to Experian. Five years ago, these eight- and nine-year loans were practically nonexistent. (…)
EARNINGS WATCH
I/B/E/S data from Refinitiv:
S&P 600:
S&P 600 earnings are expected to decrease 58.1% from 18Q2. Excluding the energy sector, the expected growth rate for the index is -54.8%. Excluding Frontier Communications (FTR.O), the expected growth rate is -10.0%.
Of the 581 companies in the S&P 600 that have reported earnings to date for 19Q2, 62.5% have reported earnings above analyst expectations.
19Q2 revenue is expected to increase 3.2% from 18Q2. Excluding the energy sector, the expected growth rate for the index is 3.0%. Excluding Frontier Communications (FTR.O), the expected growth rate is 3.3%.
51.4% of companies have reported 19Q2 revenue above analyst expectations.

S&P 400:
Second quarter earnings are expected to decrease 6.2% from 18Q2. Excluding the energy sector, the expected growth rate for the index is -3.4%.
Of the 395 companies in the S&P 400 that have reported earnings to date for 19Q2, 61.3% have reported earnings above analyst expectations.
The 19Q2 blended revenue growth estimate is 1.5%. Excluding the energy sector, the revenue growth estimate is 2.1%.
52.4% of companies have reported 19Q2 revenue above analyst expectations.
2 thoughts on “THE DAILY EDGE: 2 OCTOBER 2019”
Wow, every blog and news story shows BAD readings and edgeand odds suggest things are fine? There are stories at Calculatedrisk and every major news site, so kinda weird to get that distortion here?
For a diffusion index, the latest reading of 47.8 is its second consecutive month of contraction. What sort of correlation does that have with the months before the start of recessions? Check out the red dots in the chart above.
https://www.advisorperspectives.com/dshort/updates/2019/10/01/ism-manufacturing-index-down-in-september
I never suggested “things are fine”. I presented all the facts and reminded readers that Markit’s surveys have generally been more accurate than the ISM, particularly, as I have pointed out several times, in 2018-19 when the ISM proved, wrongly, much more upbeat than Markit. I have been saying for a while that the U.S. manufacturing industry was in recession which even Trump now acknowledges and blames the “stupid Fed” for that.
The ISM survey, vey widely followed in North America, was indeed very BAD but Markit’s, which is wider in scope, suggests that things may not be “that BAD”. As Trump says, we’ll see what happens.
Comments are closed.