Surprise Bank of Japan Move Sparks Global Bond Selloff Global stocks and U.S. futures wobbled after the BOJ surprised investors by raising the cap on benchmark 10-year government bond yields.
Even the Bank of Japan, the last proponent of ultraloose monetary policy, is becoming fractionally more hawkish.
The Japanese central bank surprised nearly everyone in the market on Tuesday by raising its effective cap on 10-year government bond yields to 0.5% from 0.25%. Under its yield curve control policy, the BOJ has long intervened to keep bond yields within a specified target range near zero. This latest tweak effectively raised the interest rate for this tenor: 10-year yields shot up to 0.41% from around 0.25%.
After the BOJ said it would now allow benchmark bond yields to trade as high as 0.5%, the yen and bank shares surged, while the local equity market sold off.
BOJ Gov. Haruhiko Kuroda said the move isn’t tightening per se—rather it is aimed at improving the functioning of the government bond market since yields on different maturities had gotten out of whack. A 10-year yield cap of 0.25% made sense when the rest of the yield curve was very near zero too, but less so when rates at both longer and shorter tenors had risen significantly in line with the global trend this year. Ten-year Japanese government bond yields were indeed looking artificially low. Japan’s 15-year bonds were yielding 0.84% before Tuesday’s move while the nine-year bond yield was at 0.31%—both significantly higher than the 10-year yield.
But the market will still question if this is just a one-off tweak or a taste of a much broader shift down the road. The change comes at an interesting time: Local media recently reported that the Japanese government intends to revise its accord with the BOJ to give the central bank more leeway to adjust its ultralow interest-rate policy. A top government official denied the report. (…)
At the press conference, Kuroda tried his best to minimise market expectations for further policy changes. He stressed repeatedly that today’s move is not the first step towards an exit and a further widening of the yield band is not needed. We think today’s decision has undermined the BoJ’s credibility on future policy guidance. From the remarks made today, we are unable to answer our question, why now?.
Economists Place 70% Chance for US Recession in 2023
The probability of a downturn in 2023 climbed from 65% odds in November and is more than double what it was six months ago, according to the latest Bloomberg monthly survey of economists. The poll was conducted Dec. 12-16, with 38 economists responding about the chance of a recession.
The median estimates see gross domestic product averaging a paltry 0.3% next year, including an annualized 0.7% decline in the second quarter and flat readings in the first and third quarters. Consumer spending, which accounts for about two-thirds of GDP, is projected to barely grow in the middle half of the year. (…)
Economists expect payrolls to decline in the second and third quarters, and by the first quarter of 2024 the jobless rate is expected to peak at an average 4.9%.
And after firmer growth in the first half of the year, average hourly earnings are forecast to cool.
Inflation as measured by the Fed’s preferred gauges is seen softening [to 3.0% in Q4] but still running well above the central bank’s 2% goal. (…)
David Rosenberg:
The Fed seems to be ignoring the news, or perhaps is not convinced it is going to last, but in both October and November, we saw declines in two critical segments of the CPI: core goods (ex-food and energy) and services ex-rent dipped back-to-back. This has happened twice in the past (data back to 1985) — and both in recessionary/deflationary episodes: April-May 2020 and October-November 2008. This is a 1-in-200 event and received scant attention.
The Fed seems consumed with an allegedly hot labor market, but the numbers it focuses on, like job openings and the unemployment rate, are classic lagging indicators. Concern over wages as price momentum recedes is nonsensical. Wages are set on inflation expectations, and they are coming down discernibly.
Indeed, as this NY Fed survey released yesterday shows. Inflation anchoring looks solid:

There were 374 worker strikes started in 2022 — a 39% increase over 2021, according to a database run by Cornell. (…)
According to Cornell, approximately 78,000 workers walked off the job in the first half of 2022, compared with 26,500 in the first half of 2021.
Strikes were on the rise, even before the pandemic — hitting a 17-year high in 2019, when 25 major work stoppages occurred, per BLS data, which only counts stoppages of 1,000 workers or more. (Cornell’s tracker, started in late 2020, covers all collective actions.) (…)
Sounds like a strong wave…until you link to the BLS data…

- Also from the NY Fed yesterday: rank and file workers’ expectations have peaked, even with rising inflation:
 Data: SCE Labor Market Survey. Chart: Erin Davis/Axios Visuals
From the IMF:
How often have wage-price spirals occurred, and what has happened in their aftermath? We investigate this by creating a database of past wage-price spirals among a wide set of advanced economies going back to the 1960s. We define a wage-price spiral as an episode where at least three out of four consecutive quarters saw accelerating consumer prices and rising nominal wages.
Perhaps surprisingly, only a small minority of such episodes were followed by sustained acceleration in wages and prices.
Instead, inflation and nominal wage growth tended to stabilize, leaving real wage growth broadly unchanged.
When focusing on episodes that mimic the recent pattern of falling real wages and tightening labor markets, declining inflation and nominal wage growth increases tended to follow – thus allowing real wages to catch up.
We conclude that an acceleration of nominal wages should not necessarily be seen as a sign that a wage-price spiral is taking hold.
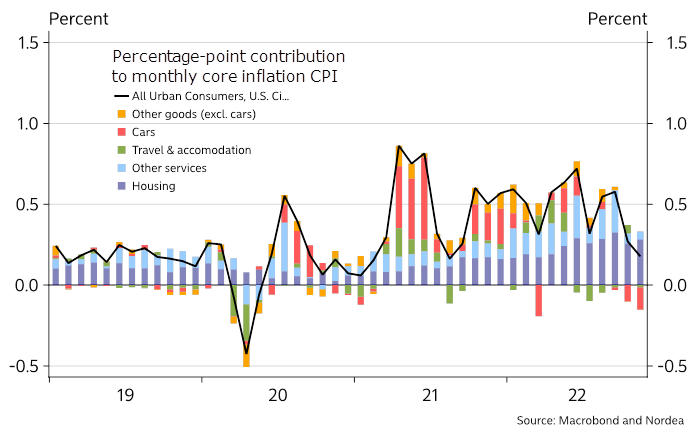
This Nordea chart merits attention, particularly the light blue bar. CPI-Services less rent of shelter (36% of core CPI and 50% of core services) was down 0.1% in October and zero in November. This is mainly fueled by wages and energy. It might also reflect lost pricing power for service providers.
Rosie adds:
(…) the Fed publishes its own uncertainty index for all the economic projections it makes in the SEP (excluding the funds rate). Participants are asked to assess how their uncertainty surrounding the outlook has changed since the last set of estimates, responding “higher,” “lower,” or “broadly similar.”
The aggregate amount of those responding “higher” uncertainty less those saying “lower,” divided by the total number of participants, results in the creation of a diffusion index over time. (…) doubt among the FOMC members’ outlook is at, or near, max levels — something not witnessed since the ’08-’09 Global Financial Crisis.
Maybe the BOJ is the first central bank to surprise markets…