EARNINGS WATCH
From Refinitiv/IBES:
Through Feb. 17, 405 companies in the S&P 500 Index have reported earnings for Q4 2022. Of these companies, 67.4% reported earnings above analyst expectations and 27.4% reported earnings below analyst expectations. In a typical quarter (since 1994), 66% of companies beat estimates and 20% miss estimates. Over the past four quarters, 76% of companies beat the estimates and 21% missed estimates.
In aggregate, companies are reporting earnings that are 1.6% above estimates, which compares to a long-term (since 1994) average surprise factor of 4.1% and the average surprise factor over the prior four quarters of 5.3%.
Of these companies, 68.1% reported revenue above analyst expectations and 31.9% reported revenue below analyst expectations. In a typical quarter (since 2002), 62% of companies beat estimates and 38% miss estimates. Over the past four quarters, 73% of companies beat the estimates and 27% missed estimates.
In aggregate, companies are reporting revenues that are 1.5% above estimates, which compares to a long-term (since 2002) average surprise factor of 1.3% and the average surprise factor over the prior four quarters of 2.5%.
The estimated earnings growth rate for the S&P 500 for 22Q4 is -2.8%. If the energy sector is excluded, the growth rate declines to -7.0%.
The estimated revenue growth rate for the S&P 500 for 22Q4 is 5.3%. If the energy sector is excluded, the growth rate declines to 4.5%.
The estimated earnings growth rate for the S&P 500 for 23Q1 is -3.9%. If the energy sector is excluded, the growth rate declines to -5.8%.
The positive surprises cannot hide the rather difficult earnings season for 8 of the 11 sectors (Industrials’ strong earnings growth comes from Airlines swinging from losses to profits):

Ex-Energy, Q4 earnings are down 7.0% YoY. Total S&P 500 EPS are down 0.7% YoY but -7.0% since Q2’22.
If current Q1’23 estimates verify (-3.9% total, -5.8% ex-E), total EPS will have dropped 11% form their Q2’22 peak.
Guidance remains negative:

Goldman’s tally of EPS revisions is “consistent with prior recessions”…
")
Source: Goldman Sachs Global Investment Research
… even tracking below 2008 …")
Source: FactSet, Goldman Sachs Global Investment Research
… when U.S equity valuations are historically very rich:
(GS)
Rich valuations are concentrated in Consumer Discretionary, IT and Utes.

(GS)
Per Ed Yardeni’s calculations, tech stocks (23.7% of the Index) are currently selling at 23.2x forward EPS and the S&P 500 ex-techs is at 17.0x.
The 4 largest weights in the S&P 500 index (AAPL, MSFT, AMZN, GOOG) account for 18% of the index. Their forward P/E averages 33.4x (AMZN = 62.2). Goldman reckons that these 4 stocks are selling at 5x revenues leaving the other 496 stocks at 2x revenues which is below the 3.0x median since 2006.

(GS)
On a Price/Sales basis, the S&P 500 is at 2.4x, down from 3.2x in December 2021. Incidentally, the previous peak P/S ratio was 2.4x in December 1999. But net margins were 9% then, they are now 13%, down somewhat from 14% in mid-2021.
This chart from Ed Yardeni plots economy-wide margins and costs. The pandemic has clearly helped stop the erosion in corporate margins between 2013 and 2019 and boost them back to previous heights.

Where margins are heading now may have something to do with where inflation goes…or is it the other way around?

The S&P 500 index is essentially a “goods” index. This is clearly illustrated by this chart from Ed Yardeni…

… and this other one matching the YoY changes in business sales and nominal personal expenditures on goods:

S&P 500 revenues were up 11.9% in Q3’22 and 5.3%e in Q4’22. PCE-Goods inflation was 8.7% YoY in Q3’22 and 5.9% in Q4 so real revenue growth slowed from +3.2% in Q3 to -0.6% in Q4, largely explaining the poor earnings season.
The problem is that goods prices have been slipping every month since last June after having jumped 17.2% between May 2020 and June 2022. The positive base effect is quickly disappearing and possibly turning negative in 2023. At the index December level, goods inflation would be +2.7% YoY in Q1’23 and flat for the rest of the year.
Meanwhile, labor and many other operating costs are continuing to rise 4-6% YoY, putting pressures on operating margins, even more so if real goods demand keeps falling like in Q3 (-0.2% YoY) and Q4 (-0.5%) of 2023.
Analysts currently project S&P 500 revenues to rise 8.1% in 2023 even after allowing for a 6.9% decline in Energy revenues. Combined revenues for Consumer Discretionary and Staples companies (23% of the total) are seen up 11.0%! In a zero goods inflation environment, that’s a lot of volume!
The stage thus seems set for
- continued deflation on goods, at least during the first half of the year;
- tepid nominal growth in S&P 500 revenues, at least during the first half of the year;
- operating costs rising 4-5%, at least during the first half of the year;
- margins compressions, at least during the first half of the year.
The only alternative scenarios that would protect margins are one of strong real consumer demand or (and) one of strong goods inflation. In each case, the Fed would likely go higher for longer, simply delaying an eventual, but likely stronger recession.
US Leading Economic Index Falls for a 10th Straight Month
The Conference Board’s measure of the economic outlook for the next three to six months decreased 0.3% in January following a 0.8% decline a month earlier, the New York-based research group said Friday. The gauge is down 3.6% over the last six months.
Six of the 10 indicators of the composite gauge, led by a deteriorating outlook for bookings at manufacturers, weaker consumer views of the business environment and worsening credit conditions. Those declines more than offset robust indicators of the job market. (…)
The Conference Board’s coincident economic index, a measure of current economic activity, rose 0.2%. The measure is determined by metrics including industrial production, sales, payrolls and incomes — the indicators used by the National Bureau of Economic Research to determine the beginning and end of US business cycles.
The best LEI charts from Advisor Perspectives/VettaFi:
- The LEI has never been so weak outside of recessions:


- The 12-m m.a. of the 12-m RoC was the last holdout but the latest 12-month moving average just turned negative:

Late Auto Payments Expose Cracks in Consumer Credit Borrowers with low credit scores are falling behind on the their car payments in numbers unseen since 2010.
Some 9.3% of auto loans extended to people with low credit scores were 30 or more days behind on payments at the end of last year, the highest share since 2010, according to an analysis by Moody’s Analytics. (…)
Stress in the auto-loan market is concentrated among borrowers with credit scores below 660 and is especially high among people with bottom of the barrel credit. (…)
Borrowers who took out big loans at the height of the boom owe far more than their vehicles are worth. Those buyers are sticking lenders with bigger losses when they fall behind.
Ally Financial Inc., which operates a large auto-lending business, said in January that the loans it extended between mid-2021 and mid-2022 are experiencing bigger early losses than its other loans. In the fourth quarter, the percentage of its car loans that were more than 60 days past due rose above prepandemic levels for the first time. (…)
Similar trend on credit card loans with problem loans concentrated at smaller banks. (Data series end Sept. 2022).

It goes beyond consumers as Almost Daily Grant’s relates:
(…) A Wednesday dispatch from PitchBook relays that so-called weakest links, or domestic loans featuring a credit rating of single-B-minus or below along with a negative outlook from S&P Global Ratings, accounted for 11% of the 1,300 sample size as of year-end, up from 7% in June and the highest share in an even two years.
Helping drive that trend: an unwelcome acceleration in negative ratings actions. Downgrades outpaced upgrades at a 2.8:1 clip during the fourth quarter by LCD’s count, the worst such proportion since September 2020, after that ratio stood at 1:1 over the three months through May. Similarly, Moody’s Investors Service downgraded 44 loans in December after rendering 43 such verdicts a month earlier. Upgrades over that stretch totaled seven.
“The loan downgrade wave has started in earnest and is likely to extend over multiple quarters,” strategists at Morgan Stanley warned late last month. “Both agencies have stepped up scrutiny of rates-sensitive balance sheets.” (…)
Analysts at S&P Global predicted yesterday that broad U.S. speculative-grade corporate defaults will accelerate to a 4% clip over the 12-months through December, more than double the 1.75% rate seen in 2022. Under a pessimistic scenario featuring a pronounced economic slowdown or lasting inflationary pressure, defaults could reach 6%, matching that seen during the peak of the pandemic.
BTW: Bankruptcies on the rise (@MikeZaccardi)

Fed’s Barkin Supports Measured Pace of Interest-Rate Increases The central bank’s quarter-point rate-rise path gives greater flexibility, says Richmond Fed president.
(…) “That means I’m comfortable raising rates potentially more often to a higher level if inflation were to come in hot, and I’m comfortable backing off if inflation were to not,” he said. “I think it’s what best balances the inherent uncertainty (in the economy) and one’s desire to do a sufficient amount to control inflation, but not to needlessly overshoot.” (…)
Mr. Barkin said economic figures over the last two weeks had shown surprising resilience in spendingand hiring in January. But he added he wasn’t ready to substantially revise his outlook because of the potential for unusual seasonal volatility, including a longer holiday spending season in the fourth quarter, warmer weather and changes in how employers are managing the size of their workforce given recent difficulties hiring workers. (…)
(…) On the one hand, “the Fed’s been trying to put the brakes on, and it doesn’t look like the brakes are getting much traction,” Summers said. But on the other, there’s the potential for a sudden stop in the economy, when companies reckon with a build-up of inventories and headcount on their payrolls, and consumers deplete their savings.
“There are more possibilities open at this point,” said Summers, a Harvard University professor and paid contributor to Bloomberg Television. “The risk is that we’re going to hit the brakes very, very hard,” and that could happen just as the economy turns down — producing a “dangerous drop-off,” he said. (…)
The median component of consumer prices is now climbing at a pace “close to 7%,” Summers calculated — the fastest in four decades. “That has got to cause real concern about inflation.” (…)

(…) “that’s because 2% is not the right target.” (…)
Calling the Fed “too data dependent,” El-Erian said supply-side developments, including an energy transition, the change in supply chains during the pandemic, a tight labor market and shifting geopolitical issues, necessitate the higher target inflation rate.
“It’s right to take data into account but you’ve got to have a view of where you’re going,” he said.
The problem now, El-Erian said, is that the Fed is stuck chasing an elusive 2% goal. (…)
(…) The case for higher interest rates has strengthened. Triangulating across economic data, the reality is, that the US economy is still in a state of strong nominal growth and inflation, with activity data coming in above consensus estimates. This supports the Fed’s base case of keeping interest rates higher for a longer period, but perhaps more importantly, it also increases the probability that the Fed will have to rethink what level of interest rates will be sufficiently restrictive.
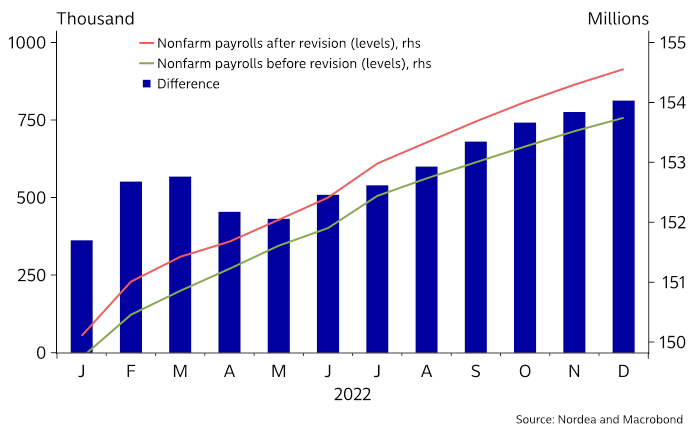
The labour market is still in an inflationary state. The January job report marked a consecutive 11-month period of job gains surpassing expectations. Even more impressive, is the fact, that revisions in the job report showed hiring was much more robust than we had anticipated at the end of last year. In total, revisions pulled up nonfarm employment by 813 thousand and pulled down the unemployment rate to 3.4%.
In addition, benchmark revisions pulled up the level of payrolls to 568 thousand in March 2022, which coupled with changes in seasonal adjustments, mean that nonfarm payrolls increased by 517 thousand in January up from an upwardly revised 260 thousand in December.
Said differently, the labour market remains in a state of accelerating inflation, one that is unlikely to induce the downwards pressure on wage and spending growth necessary to pull down inflation to the Fed’s 2% inflation goal on a sustained basis.
Employment was stronger than expected
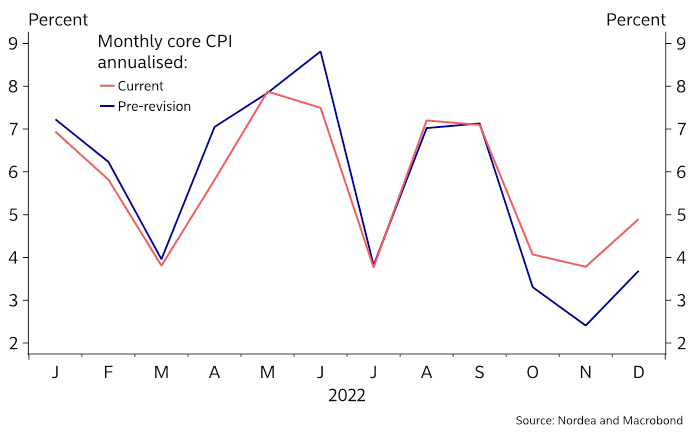
Inflation is running at a faster pace than we thought. As if the revisions in the job report were not enough, the Bureau of Labor Statistics changed the seasonal adjustment factors that it uses for computing inflation. The revisions show us, that the inflationary impulse in the last quarter was significantly higher than we had thought. For comparison, the quarterly annualised Core CPI run rate in December was revised up to 4.3% from 3.1%. And a lot of the undoing here, shows disinflation in the core goods sector was substantially smaller than we thought.
Inflation was higher than expected
The disinflationary impulse is diminishing quickly. In January headline CPI ran at a 6.2% annualised rate, as the two largest disinflationary impulses, energy and core goods, ran out of steam, while service inflation continued to rise at a brisk pace, showing little signs of slowing down.
Looking ahead, it is clear, that the disinflationary impulse, we have all enjoyed, is diminishing. In core CPI, the car category, which has been the largest disinflationary impulse in the prior months, is forecasted to stabilise and rise, reflecting the price trend in more timely private measures – like the Manheim used vehicle price index.
In addition to this, the price increases in January by other core goods – such as household furnishing and apparel – indicate, that inventory and supply are well aligned with demand, and unlikely to be a disinflationary impulse.
All of this means, that core CPI is running significantly faster than we thought, and is likely to run at a much too high rate going forward, unless service inflation starts to slow down quickly, which is highly unlikely to happen anytime soon.
There has been a lot of CPI watchers arguing to strip out certain categories to prove inflation is higher or lower. A more neutral view to strip out volatility, and gauge underlying inflation, argues looking at the median and trimmed mean CPI, which ran an extraordinary pace of 7.1% and 6.2% annualised in January, respectively. (…)
Last year, activity clearly slowed in the most interest rate sensitive and cyclical sectors, construction, manufacturing, and retail, but in contrary to common cycles, employment has held up in these sectors, supporting overall household income. Looking ahead, these sectors seem to be stabilising and some seem to be reaccelerating from lows.
Some payback may be due in February, but overall, January’s stronger economic data indicate that the economy is at least stabilising. This is most clear in the homebuilding and goods sector. (…)
Putting all of this together, it seems that the economic drag from the Fed’s monetary policy tightening has not been enough and the effect is starting to diminish. The former is evident in the still too high wage growth and inflation, as well as the historically low unemployment rate, while the latter is underscored by the most recent stabilisation and reacceleration in sectors most vulnerable to policy tightening.
This heavily supports the Fed’s base case of keeping interest rates higher for a longer period, but it also increases the odds that the Fed will have to raise rates to a higher level than anticipated. It cannot be ruled out that the fed funds rate will eventually have to be brought even higher than we thought, with levels as high as 6% not out of the question.
Fund managers came into the year with an overweight of bonds and an underweight of equities betting on a recession and sharp falling inflation. This was clearly wrong, and since then, equities have outperformed bonds. So far, the unwinding of the recession trade indicates equities are embracing stronger economic growth, and is yet to fully accept the reality that the Fed might have to raise interest rates even higher than we thought.
- Goldman Sachs analysts of Q4 earnings calls: “References to labor shortages in Russell 3000 earnings calls fell to the lowest level of the pandemic recovery, at 4.9% of Q4 earnings calls compared to 16.5% for 3Q21. Our more detailed review of Dow Jones and large-cap consumer company transcripts was even more encouraging: Two thirds of references pointed to increased labor availability, and no companies cited labor shortages worsening.” (@NickTimiraos)
Amazon Corporate Workers Face Pay Reduction After Shares Slip The company’s falling share price and stock-heavy compensation plan mean employees are getting paid 15% to 50% below targets.
(…) Amazon has historically given less base-pay compensation to employees than its big-tech peers but made up the difference with stock awards that vest over several years. Employees say the longer an Amazon employee stays with the company, the more their compensation can depend on stock awards, with stocks making up 50% or more of total income for some.
Over the past year, Amazon’s shares have declined more than 35% amid a broader technology slowdown and slower growth on Amazon’s retail side of the business. When Amazon issues restricted stock units to employees, it is predicated on the longstanding assumption shared in compensation conversations that Amazon’s shares would appreciate at least 15% each year, the people said. (…)
Because of the decline, Amazon’s human-resources team recently sent training documents to managers about how to communicate what effectively amounts to a pay cut to its employees, according to training materials reviewed by The Wall Street Journal. According to the materials, managers should focus on employees being invested in the long-term performance of the company and hold on to the restricted stock longer until there is a recovery in the company’s stock price. (…)
Last year, amid a war for talent and a slumping stock price, Amazon raised the cap for the cash component of Amazon salaries from $160,000 to $350,000. This year, the company plans on issuing raises from 1% to 4%, according to some of the people. The company won’t issue more restricted stock to employees to help them meet their target compensation for this year, some of the people said. (…)
AMZN’s forward P/E is 62.2x, the 18th highest among S&P 500 companies. Revenues are $514 billion. Compnsation will be an ongoing challenge…
China’s Angry Pensioners Are Symptomatic of Deeper Problems The nation’s fiscal position—and ability to fund other priorities—will increasingly be threatened by rising healthcare costs
(…) The immediate trigger for the flare-up was revisions pushed through by some local governments, including the city of Wuhan, which will cut reimbursements for medical care. Some money from individual accounts contributed under a compulsory savings plan will be pooled with a public insurance fund. The move would use some of the surplus in these so-called personal accounts to meet increasing public medical needs—but elderly protesters feel like the government has taken away their savings. (…)
Fiscal discipline is all well and good, but alienating the nation’s growing army of elderly pensioners, on top of homeowners, isn’t a good look—particularly when both foreign and domestic businesses are banking on a consumption boom and a return to some semblance of normalcy.
- China’s State-Owned Firms Are Sitting Out the Property Rescue Beijing has encouraged state-owned property companies to step in and take over their ailing private peers’ projects and assets, but the call has gone largely unheeded.
(…) State-backed property companies have considered and ultimately decided against acquiring a great number of projects started by private developers. They have also largely shunned a “merger and acquisition” bond program intended to help them fund these deals, although some have used the program to pay off their own debt.
That is undermining the government’s hope for an orderly recovery in the property sector—driven by market forces rather than government bailouts—and adding to home buyers’ uncertainty. Without a market solution, the burden of completing stalled projects could further fall on Chinese local governments, which are already financially stretched after three years of combating the pandemic. (…)
Many state-owned developers have analyzed hundreds of projects from private developers and found very few that met their standards, industry analysts said. (…)
Since the start of last year, just four of the 28 largest private-sector developers—as ranked by 2021 sales—have reported selling projects to state-owned developers. (…)
“This is a dead end” [said Jizhou Dong, lead China property analyst at Nomura].
(…) Instead of fending off bidders for land, local governments are stepping up auctions to lure new buyers and shore up their coffers ahead of a record 3.65 trillion yuan ($530 billion) in bonds maturing this year, and central authorities aren’t standing in their way. (…)
The coming years will be particularly challenging for local governments’ finances. Bonds worth almost 15 trillion yuan — more than 40% of their outstanding debt — are due in the next five years. (…)

SENTIMENT WATCH
- While recent data suggest the economy might be able to dodge a recession, they’ve also taken the possibility of a Federal Reserve pivot off the table, according to a team led by Michael Wilson. That doesn’t bode well for stocks as the sharp rally this year has left them the most expensive since 2007 by the measure of equity risk premium, which has entered a level known as the “death zone,” the strategist said. The risk-reward for equities is now “very poor,” especially as the Fed is far from ending its monetary tightening, rates remain higher across the curve and earnings expectations are still 10% to 20% too high, Wilson wrote in a note.

- It’s unwise to underestimate the importance of the retail cohort. Last month, #retail investors poured on average $1.51bn/day into the #US markets, the highest amount on record. They’ve continued driving US market swings with institutional investors remaining bearish on #stocks.

@vandaresearch
Here’s a snapshot of the past year, with buy-high, sell-low trends culminating in heavy tax-loss selling in December followed by January’s huge inflows.

(ZeroHedge)
In China, Worries About a Weakened Russia Prompt a Rethink Concern that a Russian setback in Ukraine would cripple China’s partner against the West helps drive Beijing’s push for an end to the war.
Ukraine’s robust battlefield resistance has prompted a rethink in Beijing, making it more inclined to push for a cease-fire to prevent further Russian setbacks—or even a larger-scale defeat, according to people close to Chinese decision-making. (…)
Unclear is how this will translate into any changes in Beijing’s restraint so far from providing Moscow with military support—a possibility highlighted by Secretary of State Antony Blinken’s remarks this weekend that Washington had information that Beijing was weighing providing lethal support to Moscow. (…)
In Turkey on Monday, Mr. Blinken said, “I think China understands what’s at risk were it to proceed with providing material support of that kind to Russia.” (…)
Mr. Xi has little interest in seeing Moscow and his counterpart, Vladimir Putin, emerge from the war severely crippled.
To that end, Beijing is pressing for a more active role in trying to end the conflict. Its top foreign-affairs official, Wang Yi, said at the Munich Security Conference this past weekend that Beijing would unveil details of a Chinese peace initiative on Feb. 24, a year after Russia invaded Ukraine. Mr. Wang was scheduled to arrive in Moscow on Monday, and possibly meet with Mr. Putin, to discuss Beijing’s ideas for resolving the Ukraine crisis. (…)
@C_Barraud

- US Treasury Warns Chinese Companies On Tech Supplies to Russia Officials will be “going directly to Chinese companies or financial institutions, and making clear to them that we were prepared to put sanctions in place if they were to provide material support to Russia,” Adeyemo told a briefing.
- EU countries mull curbing Russia sanctions dodging via trade tools, access to EU market
- Putin Vows to Push War in Ukraine, Restates Missile Warning
(…) “We will fulfill the tasks set step-by-step, carefully and consistently,” because Russia is fighting for its “historic lands” in Ukraine, Putin told the Russian parliament and top officials in Moscow on Tuesday. “One thing should be clear to everyone – the more long-range Western systems arrive in Ukraine, the further we will be forced to move the threat away from our borders. It’s obvious.” (…)
FYI
Chatbots trigger next misinformation nightmare Generative AI programs like ChatGPT don’t have a clear sense of the boundary between fact and fiction. They’re also prone to making things up as they try to satisfy human users’ inquiries.
FYI
