U.S. Manufacturers Ramp Up Production Despite Flagging Exports Factory production surged at the end of last year amid broad-based gains in output, signaling U.S. consumer demand may be making up for a pullback in exports.
Industrial production, a measure of overall factory, mining and utility output, increased a seasonally adjusted 0.3% in December from the prior month, the Federal Reserve said Friday. Output at U.S. factories, which accounts for the bulk of the nation’s total industrial output, grew 1.1% last month, the biggest gain since February 2018.
Manufacturers in a variety of categories produced more last month, with vehicle and car-parts makers leading the way. Production of appliances, clothing, and paper items also ramped up.
Mining output picked up despite recent energy-price volatility, while utility production declined a stark 6.3% from November, largely due to “warmer-than-usual temperatures,” which lowered the demand for heating, according to the Fed’s report. (…)
From a year earlier, overall industrial production rose 4% in December, while capacity utilization, which reflects how much industries are producing compared with what they could potentially produce, rose by 0.1 percentage point to 78.7% in December. This was the highest reading in about four years. (…)
Manufacturing output has ben fairly steady quarter to quarter…

…with a strong finish:

- The number of manufacturing sub-sectors that were contracting was the lowest since 2010. (The Daily Shot)

Source: @GregDaco
Markit’s December U.S. Manufacturing PMI was reasonable strong with still solid new orders:
Following a slight pick up in November, new order growth eased in December. Though strong, the pace of expansion was the weakest since September 2017. Although some firms stated that the upturn was driven by new order inflows from newly acquired clients, others cited concerns surrounding a drop in client demand compared to earlier in the year.
Conversely, new export business grew at an accelerated pace in December. New orders from abroad increased for the fifth successive month and at the fastest rate since January amid stronger foreign client demand.
Markit will release its flash PMI Thursday.
From Haver Analytics’ table, we see that Manufacturing of consumer goods has stalled in Q4. Probably a good thing, to keep inventories in shape. But Biz equipment and construction supplies have been very strong, also a good sign going into the first half of 2019 amid all this political uncertainty. Mining as well in spite of lower oil prices.

Government Shutdown, Trade Tensions Weigh on U.S. Households The latest University of Michigan index is a sign that Americans could pull back on discretionary spending
An index of U.S. consumer sentiment fell to its lowest level in more than two years in January, the University of Michigan said Friday. (…) The consumer sentiment index also fell the last time the government shut down in 2013 but recovered once the government reopened, said Jim O’Sullivan, chief U.S. economist at High Frequency Economics. (…)
Consumer sentiment are coincident indicators but because the U.S. economy is currently crucially in need of steady consumer spending, let’s spend time on this latest survey thanks to The Daily Shot:
- This index hasn’t experienced such a sharp decline in years.

- The expectations component tumbled.
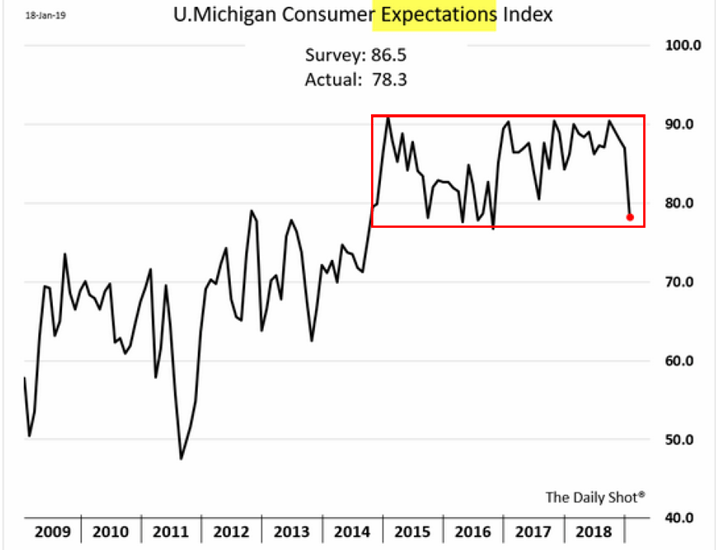
“Tumbled” sounds overly negative for such a volatile series. For better perspective of the tumbling, here’s a 50 year chart:
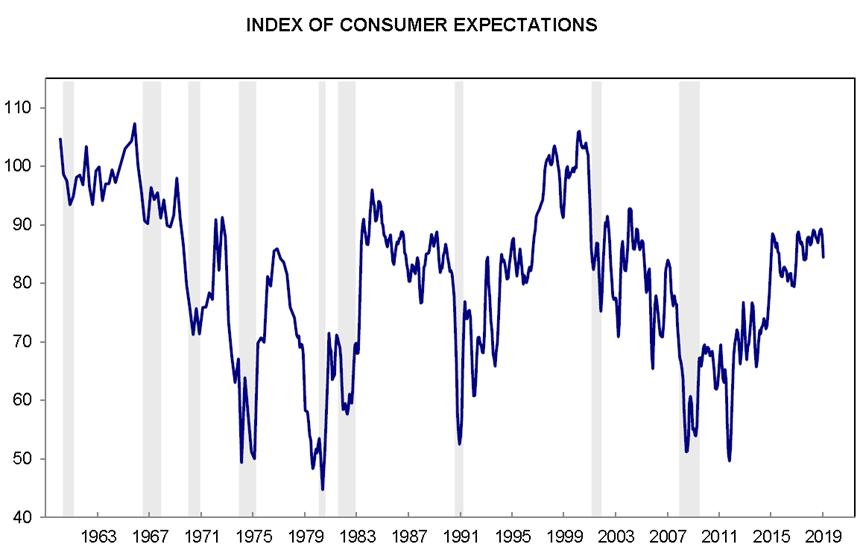
These are the two scary charts, but we knew that already:


In spite of the above, the consumer has continued to consume…

 This is the scary chart: were Americans to decide to save again, income growth would not support spending growth. Confidence is at work here.

China’s growth slowed by service, farm sectors, despite construction rebound Weakness in the service and farm sectors slowed China’s economic growth in the fourth quarter, despite a strong pickup in construction activity, official data showed on Tuesday.
Services grew 7.4 percent from a year earlier, slowing from 7.9 percent in the third quarter, while growth in agriculture slowed to 3.5 percent from 3.6 percent, the National Bureau of Statistics (NBS) said. (…)
The services sector accounted for almost half of gross domestic product in the quarter by value as China continued to transition towards a service-oriented economy, while agriculture contributed about 10 percent, according to Reuters’ calculations based on the latest data.
Growth in real estate services slowed to 2 percent year-on-year in the fourth quarter from 4.1 percent a quarter earlier, as government tightening measures to curb speculation and skyrocketing prices subdued overall demand. The sector contributed 6.4 percent to GDP in the quarter.
The retail and wholesale sector slowed to 5.5 percent from 6.2 percent as consumption of physical goods lost momentum. Auto sales in the world’s biggest car market shrank for the first time in 2018 since the 1990s.
Though retail sales growth picked up marginally in December to 8.2 percent, the consumer strength gauge is around the weakest in 15 years. (…)
Having been a stellar performer benefiting from supportive policies, the tech sector still grew at double-digit rate but growth slowed to 29.1 percent in the fourth quarter compared with 32.8 percent in the third. It accounted for about 3 percent of GDP in the fourth quarter. (…)
The [construction] sector – accounting for 8 percent of the economy – grew 6.1 percent in the fourth quarter, accelerating from the previous quarter’s 2.5 percent growth.
But in a surprising remark, Fang Xinghai, vice-chairman of China’s Securities Regulatory Commission, told a seminar in Davos that he expected economic growth to slow to 6 percent this year from 6.6 percent in 2018, stressing China’s slowdown won’t be a “disaster”.
China’s Xi Warns Party of ‘Serious Dangers’ as Risks Mount
(…) The meeting was held on the same day that China reported its slowest quarterly economic growth since the depths of the global financial crisis in 2009. The data underscored concerns that the decades-long economic expansion that helped the ruling party outlast most other communist regimes may be running out of steam. (…)
IMF Lowers 2019 Global Growth Forecast New projection largely reflects poor economic performance out of Europe
The IMF cut its forecasts for world economic growth in 2019 to 3.5%, down from 3.7% forecast in October and 3.9% expected in July.
In its earlier predictions, the IMF had characterized growth as “plateauing” but now has conceded that the “global expansion has weakened.”
A global recession isn’t around the corner, the IMF’s Managing Director Christine Lagarde told reporters at the World Economic Forum’s annual meeting in Switzerland on Monday. “But the risk of a sharper decline in global growth has certainly increased.”
She cited in particular the threat of higher tariffs, which have already weakened financial markets globally. (…)
Germany’s growth forecast for 2019 was cut 0.6 percentage points due to weak consumption and industrial production data; Italy was cut by 0.4 points due to weak domestic demand and high government borrowing costs and France was cut by 0.1 points due to the impact of ongoing street protests. (…)
The forecast was unchanged for the world’s two largest economies, the U.S. and China. But the IMF had previously forecast that both economies would slow—each by 0.4 points—in 2019 compared with the previous year. (…)
Forecasts were raised slightly for two major economies, India and Japan, and many of the sources of concern are self-inflicted wounds from political dysfunction, such as trade tensions between the U.S. and its trading partners, the U.S. shutdown, the U.K.’s Brexit and Europe’s domestic strife.
“The main shared policy priority is for countries to resolve cooperatively and quickly their trade disagreements,” the IMF said.
The IMF assumes Britain will leave the European Union with a deal that smooths the transition. A “no deal Brexit” is a “major risk” to the outlook, Ms. Gopinath said.
The fund also assumes the U.S. will impose further tariffs on China. If it doesn’t, following the negotiations under way between the countries, that would represent a positive risk to the outlook, Ms. Gopinath said.
Central Banks Struggle With Policy Settings ECB outlook reflects a global shift in central banking
(…) “The narrow window in which the ECB could have lifted its key interest rate from emergency, negative levels, has closed,” said Simon Wells, an economist with HSBC in London. (…)
The ECB outlook reflects a global shift in central banking. Federal Reserve officials—unsettled by market turbulence and slowing global growth—have said they would be patient before moving rates up again, meaning they’ll pause after a series of rate increases last year and before.
The Bank of Canada has also made a notable about-face. In early December, the Canadian central bank pointed to a weaker-than-anticipated housing market and the rapid decline in oil prices in signaling a pause in rate rises.
“We have to do our work in order to understand the shock better and what its magnitude actually is,“ Governor Stephen Poloz said last month. “We need some time.”
ECB President Mario Draghi is expected to acknowledge the darkening outlook after the bank’s policy meeting Thursday. Speaking at the European Parliament in Strasbourg earlier this month, Mr. Draghi admitted that recent data had been weaker than expected, although he argued that the eurozone probably would avoid recession. (…)
Much of the turnaround is due to weaker demand for eurozone exports. There are problems closer to home as well. Holdups at Germany’s key automobile factories pushed Europe’s largest economy to the brink of recession in the final six months of last year. Italy may not have avoided that fate, following a jump in borrowing costs as investors fretted over the government’s plans to add to an already large debt load.
In France, President Emmanuel Macron is wrestling with rolling mass protests aimed at derailing his economic reform plans. And the U.K.’s Parliament is deeply divided over how to manage the country’s planned divorce from the European Union, barely two months before it is due to depart. (…)
Figures released Thursday show the core inflation rate—which excludes volatile prices such as those charged for energy and food—was unchanged at 1% in December.
ECB officials are mindful of the bank’s past tendency to raise interest rates at the wrong time. It increased key rates in 2008 and then again in 2011. In both cases those moves were followed by recession. (…)
“The uncomfortable truth is that there may not be a whole lot the ECB can do to offset a moderate slowdown,” said Mr. Wells.
EARNINGS WATCH
From Factset:
Overall, 11% of the companies in the S&P 500 have reported earnings to date for the fourth quarter. Of these companies, 76% have reported actual EPS above the mean EPS estimate, 2% have reported actual EPS equal to the mean EPS estimate, and 22% have reported actual EPS below the mean EPS estimate. The percentage of companies reporting EPS above the mean EPS estimate is below the 1-year (77%) average but above the 5-year (71%) average.
In aggregate, companies are reporting earnings that are 3.2% above expectations. This surprise percentage is below the 1-year (+6.0%) average and below the 5-year (+4.8%) average.
In terms of revenues, 56% of companies have reported actual sales above estimated sales and 44% have reported actual sales below estimated sales. The percentage of companies reporting sales above estimates is below the 1-year average (72%) and below the 5-year average (60%).
In aggregate, companies are reporting revenues that are equal (0.0%) to expectations. This surprise percentage is below the 1-year (+1.4%) average and below the 5-year (+0.7%) average.
The blended, year-over-year earnings growth rate for the fourth quarter is 10.6% today, which is slightly above the earnings growth rate of 10.5% last week. The blended, year-over-year revenue growth rate for the fourth quarter is 6.0% today, which is slightly above the revenue growth rate of 5.8% last week.
Refinitiv reports that the 55 companies having reported so far showed 21.0% earnings growth. The blended growth rate for Q4 stands at 14.2% from Refinitiv’s lower than Factset’s base. Capital IQ’s even lower base allows them to expect a 19.1% YoY growth rate in Q4. Pick your base ‘cause they all end up at the same earnings level.
Factset continues:
At this point in time, 6 companies in the index have issued EPS guidance for Q1 2019. Of these 6 companies, 6 have issued negative EPS guidance and 0 have issued positive EPS guidance.
Analysts continue to trim estimates for 2019, particularly for the first quarter:

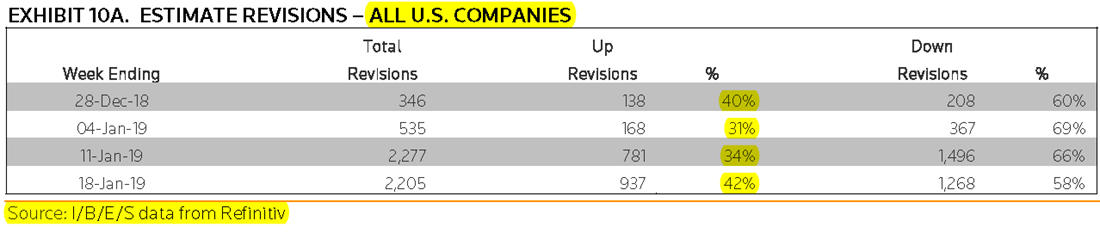
Q1 earnings are now expected up 3.0% (3.3% ex-Energy), down from 5.3% on Jan.1 with only 3 sectors sporting comfortable growth rates. Compared with 3 months ago, the revisions are very significant in Consumers, Energy, Materials and Technology. These sectors were expected to grow Q1’19 earnings 12.9% on average last Oct. 1 (+6.7% ex-E). Now: zero (+1.1% ex-E)!
Half the sectors get little or no earnings lift during the next several months, making them more susceptible to sentiment swings. In effect, while equities are cheap in aggregate, fundamental support is waning for 5 of the 11 sectors. Furthermore, all S&P 500 sectors but one (Utes) currently have a negative earnings revisions index and a negative revenues revisions index according to Ed Yardeni. The same is true for S&P 600 sectors (all sectors have negative NERI) and S&P 400 sectors.
The numerous uncertainties surrounding trade, the shutdown, Brexit and China are obviously influencing analysts to be more cautious. So far, their cautiousness is concentrated in Q1 as Q2 earnings are seen up 4.9% (6.5% on Jan. 1) and the full year is at +6.0% (from 7.3%) thanks to the hopeful Q4 expected at +11.3%, barely down from 11.5% on Jan. 1.  Talk about tail end risk!
Trailing EPS are now $162.06 per Refinitiv’s calculations and the Rule of 20 P/E is 18.64, down from 23.6 one year ago but up from 16.6 last December 26. The Rule of 20 Fair Value (yellow line in chart) is still rising (2885 currently) and if analysts estimates for the full year ($171.34) materialize, it will rise 5.7% to 3050 one year from now. Equity markets are generally better sustained when fundamentals (earnings and inflation) are rising.

Needless to say, navigating the current environment is more like rafting than yachting!
SENTIMENT WATCH
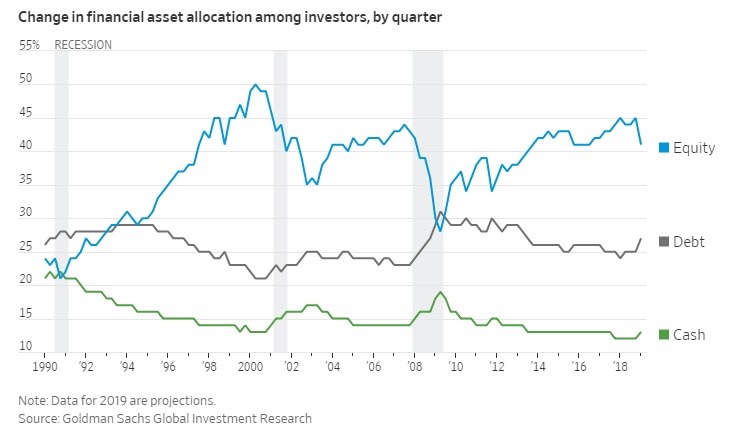
Investors’ Cash Dash Adds to Stock Market’s Vulnerability Investors are increasing their cash holdings at the fastest pace in a decade, highlighting doubts about the durability of the stock market’s rebound.
(…) An estimated 13% of investment portfolios now include cash, up from 12% for 2018, which was one of the lowest figures in the Goldman data. Besides pressuring stock returns, a rush toward cash could also signal a looming economic downturn, Goldman data show, as allocations tend to rise continuously in the 12 to 15 months preceding a recession. (…)
Silicon Valley’s Optimism Turns Into ‘Shame of Being Suckered’ Startup investors and company founders warn that the unchecked growth of the past several years could be hitting a limit. A rout of publicly traded tech companies is fostering newfound restraint.
“The unbridled optimism that inhabits our world,” said startup investor Sunny Dhillon, “is getting a shot of realism.” (…)
Yet a worrying sign is the shrinking of so-called seed deals, essentially the earliest investments in startups. The number of these deals has fallen steadily, dropping to 882 in the fourth quarter from more than 1,500 three years earlier, PitchBook says.
(…) U.S. venture-backed companies raised a record $131 billion last year, topping the previous high of $105 billion set in 2000, according to researcher PitchBook. The influx of money from investors at home and abroad has cushioned startups with shaky business models. (…)
3 thoughts on “THE DAILY EDGE: 22 JANUARY 2019: Tail End Earnings Risk”
RE: “two scary charts” (Buying Conditions for cars/homes)
See: Psychology and Macroeconomics:
Fifty Years of the Surveys of Consumers (2000)
Richard T. Curtin
Director, Surveys of Consumers
University of Michigan
“As Thomas (1999:141-142) summarizes the most recent findings “…consensus household inflation forecasts do surprisingly well relative to those of the presumably better-informed professional economists.” Indeed, the median consumer forecasts of year-ahead inflation rates “…outperformed all other forecasts in the 1981-1997 period on simple tests of accuracy as well as on tests for unbiasedness.”16 While these results do not vindicate either position, they do challenge the underlying assumptions of both views about the process governing the formation of expectations.”
“Cochrane suggests that the source of the (economic) shocks must reflect information about future economic conditions that are known to consumers but unobserved by economic models. Economists typically assume that consumers base their economic expectations on the public information releases of governmental agencies — that is, on the same sources of information used by economists.”
https://data.sca.isr.umich.edu/fetchdoc.php?docid=24782
Thanks very much for that and the link. Interesting reading. I note this conclusion:
I appreciate your reply and I’m glad you enjoyed the link! The two scary charts in your post caught my attention — and as I looked deeper, I spent time reading the report attached to those charts. I was drawn in further and further, as I read:
Subject: Impact of Interest Rates on Home and Vehicle Purchases
November 30, 2018
“Some observers may be surprised by the reactions of consumers
to the relatively low levels of current inflation and interest
rates. Consumers do not use an absolute standard, but utilize a
relative standard to make their judgements. Those standards
have been shaped by the aftermath of the Great Recession. While
credit risks in the past were reflected in the level of interest
rates, consumers now anticipate that lenders will vary credit standards, not solely interest rates, to control the flow of credit — a practice that was common in the 1950’s.”
https://data.sca.isr.umich.edu/fetchdoc.php?docid=61637
==> I became interested in what was meant by the 1950’s standards and “Consumers do not use an absolute standard, but utilize a
relative standard …”. I’m still working on what that implies — and was told to read Consumer Credit and the American Economy by Thomas Durkin. in the meantime, I ran across another interesting concept related to interest rates:
WORKING PAPER NO. 16-05
CONSUMER RISK APPETITE, THE CREDIT CYCLE, AND
THE HOUSING BUBBLE
Joseph L. Breeden
Prescient Models LLC
José J. Canals-Cerdá
Supervision, Regulation, and Credit
Federal Reserve Bank of Philadelphia
February 2016
Further investigation of the SLOOS-reported changes in demand showed that both demand and the vintage fixed effects correlate strongly to long-term changes in interest rates. This suggests that declining interest rates drive increased demand from a broad spectrum of consumers, including the important low-risk borrowers. When interest rates are rising, the low-risk consumers no longer want mortgages, so the resulting vintages are lower in volume but much higher in risk.
Cheers, always enjoy dropping by to see your nice work!
Comments are closed.