China Prepares for Evergrande Demise Beijing, reluctant to bail out the country’s most heavily indebted property developer, is asking local officials across the country to prepare for a “possible storm.”
(…) The officials characterized the actions being ordered as “getting ready for the possible storm,” saying that local-level government agencies and state-owned enterprises have been instructed to step in only at the last minute should Evergrande fail to manage its affairs in an orderly fashion.
They said that local governments have been tasked with preventing unrest and mitigating the ripple effect on home buyers and the broader economy, for example by limiting job losses—scenarios that have grown in likelihood as Evergrande’s situation has worsened. (…)
Local governments have been ordered to assemble groups of accountants and legal experts to examine the finances around Evergrande’s operations in their respective regions, talk to local state-owned and private property developers to prepare to take over local real-estate projects and set up law-enforcement teams to monitor public anger and so-called “mass incidents,” a euphemism for protests, according to the people.
- China Pumps $17 Billion Into System Amid Evergrande Concerns China’s central bank net-injected the most short-term liquidity in eight months into the financial system

- Chinese property debt issuers face ‘Evergrande premium’ as worries mount
- Evergrande deadline sends chills through $400bn Asian debt market Corporate dollar bonds hit as crisis at sprawling Chinese property developer escalates
- Evergrande fallout could be worse than Lehman for China, warns Jim Chanos
Nordea: How bad is the situation in Chinese Real Estate?
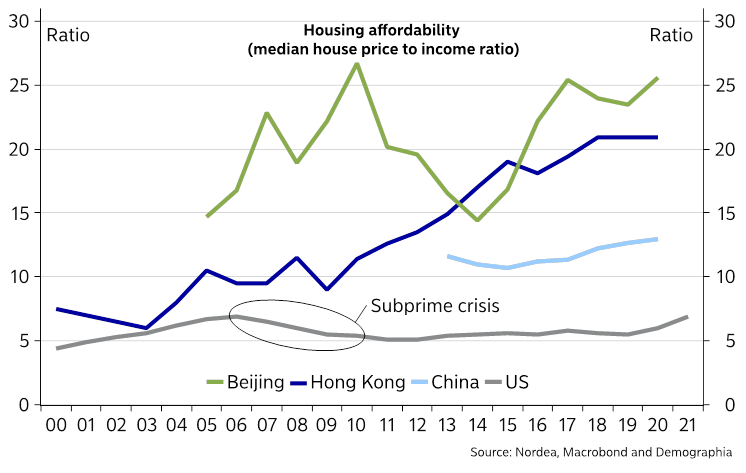
(…) Housing affordability is accordingly bad in China, with price-to-income ratios in extreme bubble territory (at least by Western standards). Price to income ratios in Beijing have exceeded 25, while also Shanghai looks stretched. The national average is also far above price-to-income ratios seen anywhere in the West, and while some of it may be explained away by either taxation differences or different development stages, we would still argue that these numbers are frightening from a fundamental perspective.
The subprime crisis in the US was “triggered” by median house price to income ratios of 7-8, which is even below the current national average in China. This means that a potential ugly latent crisis could unfold unless Chinese authorities manage to cage in Evergrande contagion risks. Other large developers such as Country Garden have substantially less gearing than Evergrande, but we would be surprised not to see intra-sector contagion to other smaller but geared Real Estate developers.
The big difference from China to the West is obviously that the Chinese authorities hold a much larger possibility of de facto controlling price developments, which is arguable THE reason why China sceptics have been wrongly calling for a bursting housing bubble for years already. Evergrande could the proof that authorities deliberately try to bring down leverage in the sector and accordingly also house prices in a contained way.
Housing affordability in China versus the West
It is therefore not out of this world to think of the following modus operandi in China over the coming weeks. Evergrande will not pay dues on international/offshore debt, which leaves bond/equity holders at high risk of being wiped out. The CCP will try to contain the domestic risks by “bailing out” local lenders and contractors by slowly but surely transferring Evergrandes assets to a quasi-public entity over the coming years. This will ensure that the local supply chain steers mostly clear of contagion as the publicly backed quasi-fund will ensure that contractors will get paid (albeit possibly with a delay and/or a palatable discount of 30-40%).
If we are right, all projects will likely be concluded and the roughly $150bn debt/risk on contractors/suppliers will be decently contained. As soon as the potential managed default is “known”, PBoC may start easing policy to contain the downside pressure on the rest of the economy. Expect both a rate cut and more cuts to the reserve requirements of commercial banks from October/November. This is likely to take USD/CNY higher (and EUR/USD lower) before New Year’s.
We expect the spill over effects on an already slowing housing market to be the largest contagion risk in an Evergrande restructuring / default scenario. Recent daily averages of sales volumes in Chinese Real Estate markets were already seasonally low before Evergrande turned into global breaking news, and we are clearly watching whether the volumes will rebound significantly post the moon festival.
China was already slowing clearly before Evergrande hit the wires, and this story will likely only emphasize the direction with further negative repercussions for global growth. This is likely to take the steam out of the cyclical part of the global economy, which may warrant asset allocation trend shifts away from cyclical assets (Global: How to position for a (clearly) weaker credit impulse?)
Goldman Sachs:
The median dots showed 0.5 hikes in 2022, 3 more hikes in 2023, and 3 more hikes in 2024, more hawkish than our expectation of 0, 2, and 3. But we see the overall message as a bit less hawkish, both because the split vote on a 2022 hike came alongside a high median core inflation forecast of 2.3% in 2022, and because our best guess is that Chair Powell’s own projections show 0 hikes in 2022, 2 in 2023, and 2 in 2024, a more dovish path than implied by the median.
Fed Tees Up Taper and Signals Rate Rises Possible Next Year Central bank officials prepare to reverse pandemic stimulus programs as soon as November; new projections showed half of 18 officials expect to raise interest rates by the end of 2022
(…) “The purpose of that language is to put notice out that that could come as soon as the next meeting,” Fed Chairman Jerome Powell said at a press conference.
Mr. Powell said officials hadn’t made a formal decision on how quickly to reduce purchases, but most agreed that a gradual process “that concludes around the middle of next year is likely to be appropriate.” (…)
To conclude those purchases by the middle of next year, officials could pare those holdings by $10 billion and $5 billion a month, respectively, if they begin the process next month. That would be a somewhat faster timetable—around eight months—than during a previous taper experience that was announced in late 2013 and lasted over 10 months in 2014.
“I think this will be a shorter period,” Mr. Powell said. “The economy’s much farther along than it was when we tapered in 2013.” (…)
For the labor-market goal, “I guess my own view would be that the test…is all but met,” said Mr. Powell, reinforcing the prospect that a taper would likely begin in November. (…)
“The test is all but met”:
- Total employment is 5.3 million (3.5%) short of its Feb. 2020 level.
- Employment has been increasing by 653k per month in the last 6 months, 750k in the last 3. At these rates, we are between 7 and 11 months from the Feb. 2020 level.
- The unemployment rate is at 5.2% from 3.5% in Feb. 2020.
- The participation rate is 61.7% and has not increased during the past 12 months. It was 63.3% in Feb. 2020.
- The unemployment rate for African-Americans is 8.8% vs 6.0% in Feb. 2020.
- The unemployment rate for “no college” is 6.0% vs 3.5% in Feb. 2020.
“It may just be that it’s going to take more time,” said Mr. Powell. “These are people who were largely working in February of 2020. They’ll get back to work…It may just take a longer time.” (…)
Looking ahead, FOMC participants project the labor market to continue to improve, with the median projection for the unemployment rate standing at 4.8 percent at the end of this year and 3.5 percent in 2023 and ’24.
At Powell’s presser, just so we’re all clear on what is “substantial progress” (my emphasis):
So the question is really on the maximum-employment test. So if you look at a good number of indicators, you will see that, since last December, when we articulated the test and the readings today, in many cases more than half of the distance, for example, between the unemployment rate in December of 2020 and typical estimates of the natural rate, 50 or 60 percent of that road has been traveled. So that could be substantial further progress.
So much for a data-dependent Fed…
BTW, last August 27, Powell said (my emphasis):
The unemployment rate has declined to 5.4 percent, a post-pandemic low, but is still much too high, and the reported rate understates the amount of labor market slack. Long-term unemployment remains elevated, and the recovery in labor force participation has lagged well behind the rest of the labor market, as it has in past recoveries. We have much ground to cover to reach maximum employment (…)
FYI: “Maximum employment is the highest level of employment or lowest level of unemployment that the economy can sustain while maintaining a stable inflation rate. Over the past few decades, experience has shown that it is possible to keep unemployment low and the jobs market strong without leading to an unwanted increase in inflation. In recent years, it has become increasingly clear that low unemployment can be sustained without leading to an unwanted increase in inflation.”
- Fed Officials See ‘Transitory’ Inflation Lasting Quite a While The outlook from central-bank policy makers is speeding up plans to raise interest rates.
Grep Ip:
(…) Last September, long before the supply bottlenecks emerged, the median forecast by Fed officials was for core inflation (which excludes food and energy) in 2022 of 1.8%. Every few months since then they have nudged that up, and in the forecasts released Wednesday they see core inflation next year at 2.3%.
(…) next year’s projected 2.3% is the highest next-year core inflation forecast since projections were first published in 2007, according to Derek Tang of Monetary Policy Analytics. (…)
On Wednesday, the Fed signaled it would likely start tapering those bond purchases in November, which means the process would be over by mid-2022, clearing the way for a rate increase. Half of Fed officials think rates will start rising by late next year. Just last March, a majority of officials didn’t see that happening until 2024.
What changed? It isn’t because the economic outlook is stronger. In fact, officials now see slower growth and higher unemployment than they did in March. (…)
A 2.3% inflation rate isn’t a big deal. Indeed, it would conform pretty closely to the Fed’s new goal of letting inflation run above 2% for a while to compensate for the many years it ran below 2%. Yet if officials are wrong, they are likely to have proved too low in their forecasts. With unemployment expected to fall to 3.8% by next year and 3.5% by 2023, the economy will be operating with little or no spare capacity, conditions that typically cause inflation to rise.
Fed officials think inflation risks are to the upside; a majority said so Wednesday. Six of 18 Federal Open Market Committee participants think core inflation will be 2.5% or higher next year.
If the Fed is more worried about inflation, investors aren’t. Long-term bond yields dropped a bit Wednesday, and bond-implied future inflation rates haven’t changed much since May. The market might have more faith in the Fed’s “transitory” story than the Fed itself.
Or the Fed’s own activity is keeping bond-implied future inflation rates lower than Mr. Market would on its own…
More on inflation from Powell’s presser:
As the reopening continues, bottlenecks, hiring difficulties, and other constraints could again prove to be greater and longer-lasting than anticipated, posing upside risks to inflation.
(…) the bottlenecks and shortages that are being—that we’re seeing in the economy have really not begun to abate in a meaningful way yet.
So those seem to be going to be with us at least for a few more months and perhaps into next year. So that suggests that inflation is going to be higher this year and a number—you know, I guess, the inflation rates for next year and 2023 were also marked up but just by a couple of tenths.
Those are very modest overshoots. You’re looking at 2.2 and 2.1, you know, two years—two years and three years out. These are very, very—I don’t think that households are going to, you know, notice a couple of tenths of an overshoot. That just happens to be people’s forecasts.
But earlier in the same press conference, he referred to 2.3% inflation and the dot plot reveals the 6 of the 18 participants see inflation at 2.5%. BTW, last seen core CPI was 4.0% and core PCE 3.6%. But nobody really notices…
How about a new “transitory CPI”?
- Investors Bet Environmental Fears Will Crunch Commodity Supply, Lifting Prices Wagers on environmentally driven supply shortages are pushing up everything from natural gas to aluminum, increasing costs for consumers and businesses.
(…) With producers such as Exxon Mobil Corp. and Chevron Corp. under pressure from investors to minimize environmental damage, many are limiting spending on new output. The caution comes after years of declining investments in production that were driven by lackluster commodity prices and a focus on returning money to shareholders, analysts say. (…)
Even with prices for metals like copper also at their highest levels in years, annual spending by mining companies is projected to remain about 30% or more below a 2012 peak each of the next five years, according to data compiled by investment bank Jefferies. (…)
In recent weeks, aluminum has soared, buoyed by limits on how much power aluminum smelters in China can consume. (…)
One reason some investors are particularly bullish on metals like copper, aluminum and lithium—a key component of the rechargeable batteries that power electric cars—is that demand for these materials from green-energy projects is expected to surge even as environmental concerns limit supply. (…)
“Most of the limiting factors on supply are now related to environmental issues.”
- Norway raises interest rates in first increase by a G10 central bank Norges Bank says more rises to come as economy rebounds and financial imbalances grow
Eurozone flash PMI points to slower growth as bottlenecks curb activity and input price gauge hits 21-year high
Eurozone business activity grew at a markedly reduced rate in September, reflecting the peaking of demand in the second quarter, supply chain bottlenecks and concerns over the ongoing pandemic. Business expectations for the coming year were also knocked by rising worries over the impact of the Delta variant on demand and supply chains, contributing to a further moderation in the rate of job creation from July’s 21-year peak.
Firms’ costs meanwhile rose at the fastest rate in 21 years as demand again outstripped supply, with price rises increasingly feeding through from manufacturing to services. The headline IHS Markit Eurozone Composite PMI® fell sharply in September, dropping from 59.0 in August to 56.1 to indicate a further cooling of the rate of expansion from July’s 15-year high, according to the ‘flash’ reading*. The latest increase in business activity was the smallest since April, albeit still well above the survey’s pre-pandemic long-run trend to signal another month of above-average strong growth.
Robust but slowing growth was recorded across both manufacturing and services, with the latter outperforming modestly. Whereas the service sector merely saw growth slip to the weakest since May, manufacturers reported the smallest production gain since January.
Slower production growth in manufacturing was primarily linked to supply chain constraints, which also affected some service providers. The ongoing pandemic was meanwhile again also often widely blamed for subdued demand growth, notably in curbing service sector exports.
Measured overall, inflows of new orders rose at the slowest pace since April, with demand growing at reduced rates in both manufacturing and services after exceptionally strong gains seen in prior months.
New export order growth likewise waned, dropping to the lowest since February. The pace of expansion cooled sharply in manufacturing, while new business from abroad increased only modestly in services.
Backlogs of uncompleted orders meanwhile rose sharply again, most notably in manufacturing, commonly reflecting supply constraints.
Suppliers’ delivery times, a key gauge of supply chain delays in the manufacturing sector, lengthened at an increased rate in September, continuing to extend to a degree greatly exceeding anything seen prior to the pandemic.
Shortages once again fed through to a steep rise in firms’ input costs. Across manufacturing and services, input costs rose at the sharpest rate since September 2000. Service sector input cost inflation hit the highest since July 2008 while input price inflation in manufacturing remained close to all-time highs.
Higher costs were commonly passed on to customers. Measured overall, selling price inflation accelerated in September, rising to the third-highest rate seen over the past two decades, exceeded only by the increases seen in June and July.
Employment growth meanwhile slipped to a four-month low, moderating in both manufacturing and services amid some concerns over the resilience of future demand and supply, yet remained historically strong – among the highest seen over the past two decades – as companies continued to rebuild or expand capacity.
Similarly, future sentiment moderated for a third month running to the lowest since January, linked to concerns over the ongoing pandemic, notably in the service sector.
Within the eurozone, growth slowed especially sharply in Germany, down to its lowest since February, with marked coolings seen in both manufacturing and services, the former in particular hit by supply constraints.
Growth also moderated in France, slipping further from June’s peak to the lowest since April. The service sector showed more resilience than manufacturing, the latter seeing output increase only modestly as shortages continued to bite.
Growth in the rest of the eurozone as a whole outpaced that seen in Germany and France, though eased to the slowest since April, led by a softer services expansion and some waning of growth in manufacturing.


U.S. Existing Home Sales Fell in August
The National Association of Realtors (NAR) reported that sales of existing homes fell 2.0% m/m (-1.5% y/y) in August to 5.880 million units at an annual rate. The 5.990 million sales pace initially reported for July was revised up to 6.000 million. The Action Economics Forecast Survey expected sales of 5.870 million units in August. These data are compiled when existing home sales close.
Sales fell in each major region in August. Sales in the Northeast declined 1.4% m/m (-2.7% y/y) to 730,000 units. Midwest sales also fell 1.4% m/m (-2.1% y/y) in August to 1.370 million units, the first monthly decline in five months. Sales in the South decreased 3.0% m/m (-0.8% y/y) to 2.550 million units. And sales in the West slipped 0.8% m/m (-1.6% y/y) to 1.230 million units.
The median price of an existing home edged down 0.8% m/m (+14.9% y/y) to $356,700 in August with the median sales price declining in each of the four major regions. This was the second consecutive monthly decline for the national figure. The monthly decline was largest in the Northeast (-0.83% m/m, +16.8% y/y)) and smallest in the West (-0.08%, +11.4% y/y)). The price data are not seasonally adjusted
The supply of houses for sale continued to be a restraint on sales. The number of existing homes on the market fell 1.5% m/m (NSA) in August to 1.290 million units and was 13.4% lower than a year ago. These figures date back to January 1999. The supply of homes on the market held at 2.6 months of the current sales pace, but remained well below its recent high of 4.6 months in May of last year and was marginally above it all-time low of 1.9 months reached last December.
Sales of existing single-family homes fell 1.9% m/m (-2.8% y/y) in August to 5.190 million units (SAAR) after rising 2.9% m/m in July. Sales of condos and co-ops fell 2.8% (+9.5% y/y) to 690,000.

COVID-19
 (
(
Data: The N.Y. Times. Chart: Kavya Beheraj/Axios