SENTIMENT WATCH
-
Global markets take fright on slowdown fears Stocks lose almost 2%, Bunds turn negative and US Treasury yield curve goes inverted
-
One by One, Global Bond Markets Are Flashing the Same Warning
Wherever you look in developed markets, sovereign bond yields are at their lowest levels in years as traders ratchet up bets that major central banks will be easing. (…)
Money markets are pricing around a 90 percent chance that the Federal Reserve will cut rates by 25 basis points by December, followed by another reduction in September 2020. This comes after the central bank projected no hikes this year at its policy meeting last week. (…)
(…) But there’s an alternative prognosis: that we’re witnessing a reinstatement of the friendly low-rate environment that sent equities to records in the first place. (…)
In the past 35 years, such a signal [curve inversion] has preceded the three U.S. recessions by an average lead time of more than 15 months, while producing one false positive, according to data compiled by Bloomberg. (…)
-
Positive German data tempers equity selloff, lifts bond yields
World stocks hit a 12-day trough on Monday as fears for economic growth sent investors dashing for safe-haven assets, but the selloff lost some momentum after better-than-expected data from Germany.
The Ifo Institute’s March business climate index unexpectedly rose, soothing nerves after Friday’s dismal German manufacturing data, which helped spark a global selloff that hammered stock markets and pushed key benchmark bond yields below zero. (…)
-
Former Fed chair Yellen says yield curve may signal need to cut rates, not a recession
 Freaking Out Over Inverted Yield Curve In this video podcast, Ed Yardeni discusses why the stock market is freaking out over the inversion of the yield curve.
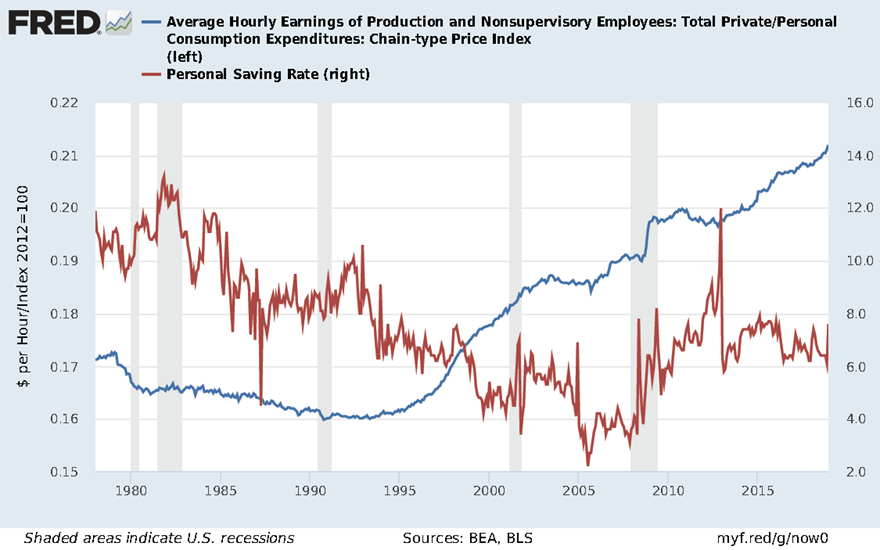
As far as the U.S. is concerned, the real income side of the consumer is pretty strong.
U.S. CEOs don’t seem overly concerned, just yet anyway:

European manufacturing is clearly in bad shape:

But Services are not distressed as in 2012-13:

So the composite PMI has not cratered  :
:

(Markit)
-
Fathom Consulting: Fathom’s aggregate euro area Economic Sentiment Indicator (ESI) ― which distils the information from numerous business and consumer surveys into a single composite indicator ― ticked up to 0.5% in February, after having declined by 0.9 percentage points in 2018.

Fathom’s view is that growth is likely to remain close to its current pace of 0.2% per quarter, with the economy likely to expand by 1.2% over the year as a whole. While this rate may not immediately appear impressive compared to historical norms, it remains slightly above Fathom’s central estimate of the currency bloc’s post-crisis trend rate of growth. (…)
Today:
Germany’s leading indicator, the Ifo index, increased in March, finally providing some evidence of a rebound. The Ifo index now stands at 99.6, up from 98.5 in February – the highest level this year. Both the expectations and the current assessment component increased. Particularly, the sharp improvement in the expectations component to 95.6, from 93.8, provides moderate optimism. (ING)
U.S. Existing Home Sales Jumped 11.8% in February
That was the second-strongest monthly gain in home sales ever.
Nonetheless, sales volume was 1.8% below where it was one year ago, indicating the market is recovering but to a lower level than 2017 and early 2018. Other continued signs of softness include higher inventory levels and an increase in the days homes are spending on the market. (…)
The region seeing biggest increase in February home sales was the West, where volume rose 16% from January. The increase was 14.9% in the South and 9.5% in the Midwest. Sales were flat in the Northeast.
The National Association of Realtors said there were 1.63 million existing homes available for sale at the end of February, up 3.2% from a year earlier and representing a 3.5-month supply at the current sales pace.
Some jump! Right back at the 2017 average.

Everywhere in the U.S. except the Northeast. (?)

February is a very slow month in housing and seasonal adjustments can be tricky. Non seasonally adjusted sales were down 2.2% YoY. Let’s see March/April numbers before concluding anything.
U.S. Budget Deficit Grew 39% in First Five Months of Fiscal 2019 Tax revenues little changed so far in fiscal 2019
The government ran a $544 billion deficit from October through February, the Treasury Department said Friday, compared with $391 billion during the same period a year earlier. Federal outlays rose 9%, to $1.8 trillion, while revenues declined less than 1%, to $1.28 trillion.
Part of the increase in the deficit was attributable to a shift in the timing of certain payments, which made the deficit appear larger. If not for those timing shifts, the deficit would have risen 25% from the same period in fiscal year 2018. (…)
On a 12-month basis, revenues declined 0.7% and outlays rose 5%. For the 12 months ended February, the deficit totaled $932.2 billion, or 4.5% as a share of gross domestic product, the highest since May 2013.
EARNINGS WATCH
The Q4’18 earnings season is now essentially over (497 companies in). Earnings growth was 16.8% thanks to a +3.4% surprise factor. The big disappointment was from Financials: earnings rose 15.6% but the beat rate was only 64% and the surprise factor a low +0.3%. Ex-Energy, earnings grew 14.2%.
Analyst revisions improved a little last week:
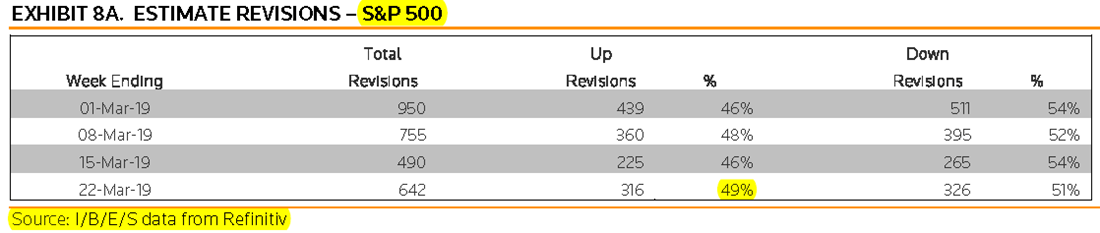

Here’s the quarterly trend seen by IBES:


-
Doubts increase that first quarter will be earnings low point
As Wall Street braces for what may be the first U.S. profit decline since 2016, investors say the first quarter may not mark the low point for 2019 earnings.
(…) Since the start of the year, the forecast for second-quarter profit growth has fallen to 3.0 percent from 6.4 percent, while estimated growth for the third quarter has dropped to 2.7 percent from 4.9 percent, based on Refinitiv’s data. The fourth-quarter growth estimate has come down as well, though it is still relatively strong, at 9.1 percent.
Those numbers could keep falling, while the first-quarter forecast is likely to improve from here. Since 1994, earnings have surprised to the upside on average by 3.2 percent, according to Refinitiv data, which suggests S&P 500 companies will post an earnings gain for the first quarter. (…)
Joe Zidle, BlackRock’s CHIEF INVESTMENT STRATEGIST:
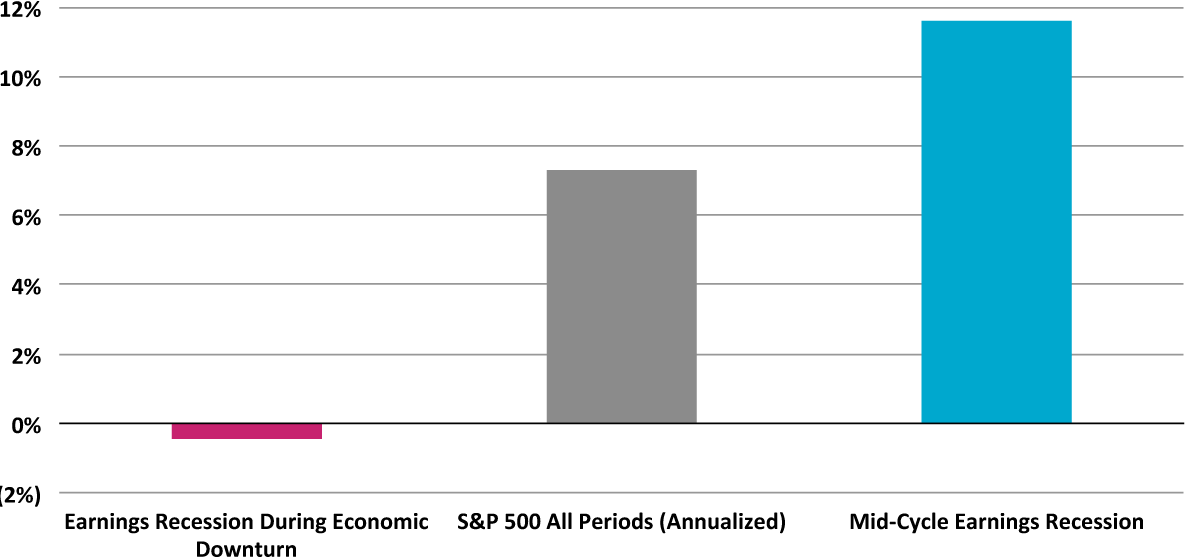
Not all profits recessions are bad There have been 14 earnings recessions since World War II, i.e., two consecutive quarters of negative earnings growth. Six of those earning recessions can be characterized as mid-cycle, meaning they did not coincide with an economic recession.4 In the eight earnings downturns that coincided with broader economic slowdowns, stock performance 12 months later was negative with an average return of -0.4%.5 Conversely, the market was up nearly 12% on average a year after earnings recessions that did not overlap with an economic recession. For reference, the broader market has returned an annualized 7.3% since 1945.
Next Twelve Months Stock Performance (1945-2018)
IHS Markit US PMI signals greatest pressure on corporate earnings since 2016
The surveys indicate that growth has moderated since the robust gains seen this time a year ago, especially in the goods-producing sector. The ‘composite’ index, which pulls together the data from the manufacturing and service sector PMIs and acts as an accurate ‘nowcast’ tool for GDP, correctly indicated that the pace of economic growth slowed in the fourth quarter (our model from the survey indicated 2.5% growth against an initial official estimate of 2.6%). The index has since shown no re-acceleration in the first quarter (see fig 1).
Businesses in fact reported that output growth eased to the second-lowest seen over the last year, according to the flash PMI results for March. Although the headline PMI remains encouragingly resilient, indicative of the economy growing at an annualised rate in excess of 2% (suggesting some potential upside to many current growth forecasts), signs of the business environment becoming tougher have intensified in recent months, especially in manufacturing, where the survey is consistent with falling factory output and order books (see fig 2).
Growth is also likely to cool further, according to the survey’s sub-indices, and companies may soon seek to reduce capacity. Whereas new orders were growing at a faster rate than companies could boost output throughout much of last year, the surveys are now showing signs that demand is insufficient to sustain current output levels. Similarly, in manufacturing, the forward-looking new orders to inventory ratio hit a 18-month low in March and suppliers’ delivery delays (a key indicator of capacity utilisation) indicated the fewest delays for 16 months in March.
At the same time, business optimism about the outlook has also cooled to the lowest since mid-2016 amid worries over the impact of tariffs, trade wars, higher prices and rising interest rates.
The headwinds to business indicated by the surveys bode ill for corporate earnings growth, a deeper insight into which can be gleaned from analysis of other survey sub-indices against historical earnings growth. In this respect, the surveys indicate that earnings have been under their greatest pressure for three years in recent months.
To estimate the trend in earnings growth we have compiled an indicator based on five components, all derived from IHS Markit’s US PMI surveys, which provide insights into sales growth, pricing power and profitability:
- Total order book situation: a blended index of the composite new orders and backlogs of orders questions providing an overall indication of sales growth (weight 1.3)
- Output prices: based on the composite PMI average prices charged index, providing an indication of pricing power among goods producers and service providers (weight 0.7)
- Backlogs of work: the composite survey index covering work received but not yet completed, which helps indicate the extent to which demand is running ahead of capacity and therefore acts as a further guide to both sales and pricing power (weight 0.7).
- Productivity: the ratio between composite PMI output and employment indicators which provides an insight into labour productivity, itself a key determinant of profitability (weight 0.2)
- Suppliers’ delivery times: a key gauge of capacity constraints and pricing power (weight 0.3)
The above components are calculated by first comparing the current month’s value to the trailing six-month average. The components are charted here against earnings growth (note that in these charts we use three-month averages to illustrate the trends). We compare the components against the reported earnings per share in S&P500 companies over the prior 12 months, as measured by Case Shiller, and specifically the current month’s EPS value against the prior six-month trailing average.
Individual components are then weighted together to form a composite earnings momentum gauge (see fig 3). The resulting index exhibits a correlation of 75% against this measure of earnings growth with an advanced lead of four months, which rises to 83% if a moving average is used to reduce some of the indicator’s volatility.
The average earnings growth momentum signalled by the indicator in the first quarter is the lowest recorded since the first quarter of 2016, a time when earnings were falling at an annual rate of 12.9%.
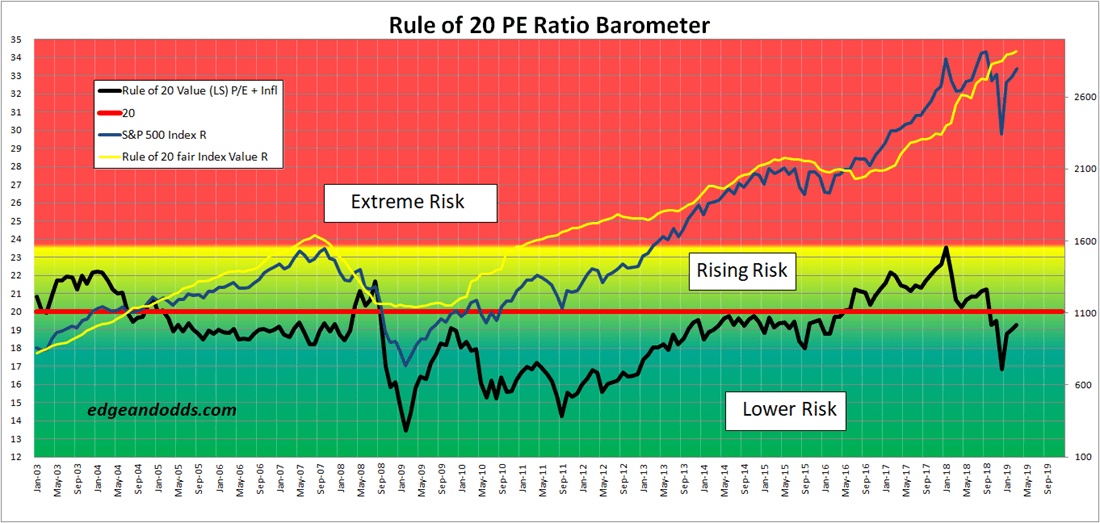
Friday’s setback brought the S&P 500 Index back to the 2800 resistance level and 1.4% above the rising 200-day m.a.:

THE MOTHER OF ALL DISGUSTING CORPORATE BEHAVIOR
Philip Morris says Canadian unit RBH granted creditor protection
Philip Morris International Inc on Friday said its Canadian unit, Rothmans, Benson & Hedges Inc (RBH), was granted creditor protection, following a tobacco class action ruling in Quebec this month.
The company said it would deconsolidate RBH from its financial statements, and it cut its full-year 2019 diluted earnings per share forecast to at least $4.90 at prevailing exchange rates, from at least $5.28 in the forecast it made on March 4, shortly after the ruling in Quebec.
The Court of Appeal of Quebec upheld the bulk of a 2015 decision that awarded about C$15 billion ($11.19 billion) to smokers in the Canadian province, a blow to several big tobacco companies, including RBH.
Some observers criticized the creditor protection calling it an attempt to avoid making payments. (…)
The creditor protection process, granted by the Ontario Superior Court of Justice, will allow RBH to carry on its business in the ordinary course, Philip Morris added.
U.S. Vessels Sail Through Taiwan Strait, Defying China The Pentagon sent two vessels through the Taiwan Strait on Sunday, a show of U.S. support for Taiwan likely to fuel concerns in Beijing that Washington is aligning increasingly with Taipei.
China Warns the U.S. After Navy Sails Through Taiwan Strait
(…) The U.S. has over the past year increased its naval transits through the 180-kilometer (110 mile) wide strait that separates Taiwan from the Chinese mainland. Sail-bys in January and February also drew protests from China, which considers the island a province.
On Monday, China urged the U.S. to avoid undermining ties between the world’s two biggest economies and support peace and stability in the strait, Geng said. (…)
EU to drop threat of Huawei ban but wants 5G risks monitored – sources
The European Commission will next week urge EU countries to share more data to tackle cybersecurity risks related to 5G networks but will ignore U.S. calls to ban Huawei Technologies, four people familiar with the matter said on Friday. (…)
Ansip will tell EU countries to use tools set out under the EU directive on security of network and information systems, or NIS directive, adopted in 2016 and the recently approved Cybersecurity Act, the people said. (…)
Nearly 95% of all reported trading in bitcoin is artificially created by unregulated exchanges, a new study concludes, raising fresh doubts about the nascent market following a steep decline in prices over the past
(…) Bitwise Asset Management said its analysis of trading activity at 81 exchanges over four days in March indicates that the actual market for bitcoin is far smaller than previously thought. (…) Last week, research firm Crypto Integrity said it concluded that 88% of all trading in February had been inflated. The TIE, another cryptocurrency researcher, on Monday estimated that 75% of exchanges had some form of suspicious activity occurring on them. (…)
Bitwise suggests that the unregulated exchanges are inflating trading volume to get a higher ranking on data services like CoinMarketCap and leverage that ranking to attract listing fees.
4 thoughts on “THE DAILY EDGE: 25 MARCH 2019”
Re: Yardeni and “the real income side of the consumer is pretty strong”
Maybe I’m looking at his chart wrong (it’s early) but I see a 5 cent wage increase over 24 years. Even without going over details, there has been a very long multi-decade period of wage decay, even of you account for a few pennies, after the multi-trillion QE. The case for not worrying about an inverted yield curve is super weak. The lack of global wage growth and lack of real growth is causing economic instability, which is causing workers of the world to look at extreme political ideologies as a way forward. Yardeni is excited about a few pennies while the world falls into greater chaos.
Sorry for the confusion. The chart is actually in dollars per hour (real hourly wages) and it is not a Yardeni chart but one I added to try to show that the American consumer is enjoying rising real wages while his savings are at the high end of the past 25 years, offering a potential buffer.
Thanks. I enjoy FRED, and sorry if I add to confusion:
https://fred.stlouisfed.org/graph/?g=noRZ
Mr. Q.
Here’s yet another FRED, using ECI, which doesn’t blend-in compensation associated with stock options … not that low-end workers would be involved in that type of theft, but as an index, it’s a nice alternative to keep an eye on, in terms of exploding wage growth. Sorry to go insane on compensation, but it’s simply nothing more than hype.
https://fred.stlouisfed.org/graph/?g=npiR
Comments are closed.