U.S. Trade Team Back in Beijing as China Sees Much Still to Do
(…) “There’s still a lot of work to be done,” Ministry of Commerce Spokesman Gao Feng said at a press conference in Beijing on Thursday. One of the biggest sticking points is still disagreement on enforcement, with the U.S. wanting assurances that China will deliver on any promises to change its practices around intellectual property protection. (…)
The urgency of reaching a trade deal is being underscored by the dimming outlook for global commerce. Figures published Monday show trade fell 1.8 percent in the three months through January compared with the previous period. That’s the biggest drop since May 2009. (…)
These charts from CPB show that world trade has essentially stalled in 2018 and is now falling after the inventory build up last fall. Because of the shutdown, the CPB plugged a zero value to U.S. January imports and exports. Figures released yesterday show U.S. exports up 0.9% and imports down 2.6% MoM. Since U.S. imports totally dwarf exports, CPB figures will look even worse when revised.

The CPB also charts world industrial production through January:

These IP trends certainly feed this other trend:
Global Bond Markets Go ‘Mad’ as Everything Rallies at Once
As benchmark Treasury yields trade at December 2017 lows and those on German bunds sink deeper into negative territory, century bonds riddled with interest-rate risk are suddenly one of the market’s biggest outperformers. And the market value of the world’s investment-grade and high-yield bonds has jumped by almost $1.6 trillion to $55 trillion in the past three weeks, with the index racing toward record highs, according to Bloomberg data. (…)
“It seems that there is widespread capitulation on strong macro views, so the search for carry is on,’’ said Chris Iggo, chief investment officer for fixed income at Axa Investment.
The $9.8 trillion Bloomberg Barclays Global Aggregate Corporate Index is fast recovering from last year’s meltdown, yielding less than 125 basis points above Treasuries — below the five-year average.
“Credit should not do well when the yield curve is inverted and recession fears heighten,” Emons wrote in a separate note. “Yet, inverted yield curves, recession and rate cut expectations has driven credit spreads tighter.”
The Reserve Bank of New Zealand is no big weight on the world monetary policy scale but has proven one of the best observer of world economic trends. This is from their March 27 statement:
(…) The global economic outlook has continued to weaken, in particular amongst some of our key trading partners including Australia, Europe, and China. (…) The balance of risks to this outlook has shifted to the downside. The risk of a more pronounced global downturn has increased (…)
But the U.S. economy is not cratering:
-
 Fed Officials Push Back on Market’s Rate-Cut Belief Some Federal Reserve officials are saying it is too soon to consider cutting U.S. interest rates, despite rising market speculation of such a move because of slowing global growth and signals of trouble from the bond market.

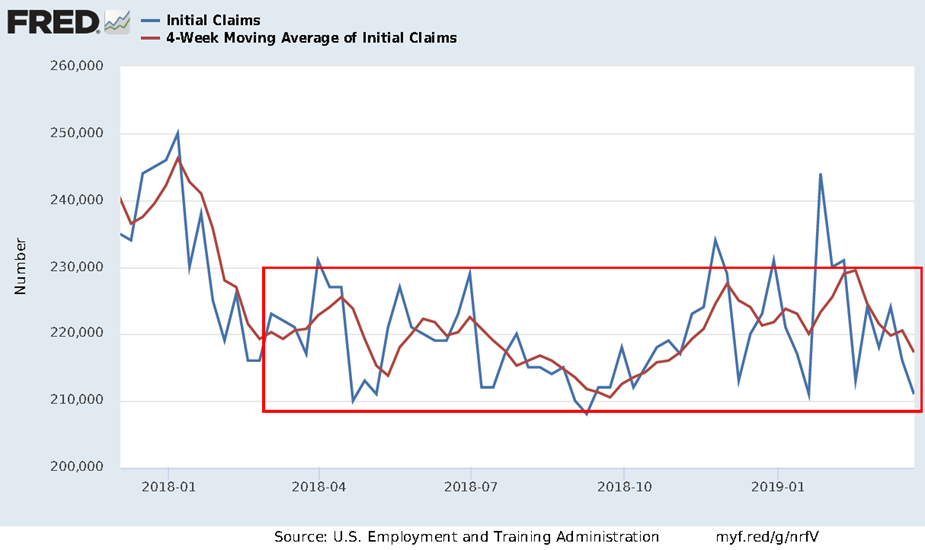
In the week ending March 23, the advance figure for seasonally adjusted initial claims was 211,000, a decrease of 5,000 from the previous week’s revised level. The previous week’s level was revised down by 5,000 from 221,000 to 216,000. The 4-week moving average was 217,250, a decrease of 3,250 from the previous week’s revised average. The previous week’s average was revised down by 4,500 from 225,000 to 220,500.
Keeping track of David Rosenberg’s concerns about “forward-looking initial claims”. Back to the bottom of the 2018 channel after the shutdown:
China makes unprecedented proposals on tech, trade talks progress – U.S. officials China has made unprecedented proposals in talks with the United States on a range of issues including forced technology transfer as the two sides work to overcome remaining obstacles to a deal to end their protracted trade war, U.S. officials told Reuters on Wednesday.
Auto Retail Sales Off to Slowest Q1 Start Since 2013
Total sales in March are projected to reach 1,562,800 units, a 2.1% decrease compared with March 2018. The seasonally adjusted annualized rate (SAAR) for total sales is expected to be 16.9 million units, down 400,000 from a year ago.
New vehicle total sales in Q1 are projected to reach 3,952,100 units, a 2.5% decrease compared to the first quarter of last year.
“This is the first time in six years that Q1 sales will fall short of 3 million units. While the volume story could be better, there is remarkable growth in transaction prices, with records being set monthly. New-vehicle prices are on pace to reach $33,319 in Q1—the highest ever for the first quarter—and it’s more than $1,000 higher than last year.” The combination of lower volumes and higher prices means that consumer expenditures on new vehicles will be down only 3%. (…)
Last year, sales during the first quarter were down nearly 3%, while sales during the reminder of the year were down only 2%. Recovery of that volume is key, because the slow start to the year has resulted in increased inventory levels. Without a recovery, the industry will be faced with the tough choice of either increasing incentive levels or cutting production. (…)
TECHNICALS WATCH
CMG Wealth’s weekly Trade Signals have turned almost all green on equities:
Equity Trade Signals
- Ned Davis Research CMG U.S. Large Cap Long/Flat Index: Buy Signal – 100% U.S. Large Cap Equity Exposure
- Long-term Trend (13/34-Week EMA) on the S&P 500 Index: Buy Signal – Bullish for Equities
- Volume Demand (buyers) vs. Volume Supply (sellers): Buy Signal – Bullish for Equities
- S&P 500 Index 200-day Moving Average Trend: Buy Signal – Bullish for Equities
- S&P 500 Index 50-day vs. 200-day Moving Average Cross: Sell Signal – Bearish for Equities*
- NASDAQ Index 200-day Moving Average Trend: Buy Signal – Bullish for Equities
- Don’t Fight the Tape or the Fed: Indicator Reading = +1 (Bullish Signal for Equities)
*Nearing a signal change
The 13/34–Week EMA Trend Chart has proven pretty good so far this century (!):

So has the S&P 500 Index 200-day Moving Average Trend which flags a buy signal when the 200-day MA price line rises from a low point by 0.5% or more. The signal was triggered March 20.

And we are just about to get the “Golden Cross”:
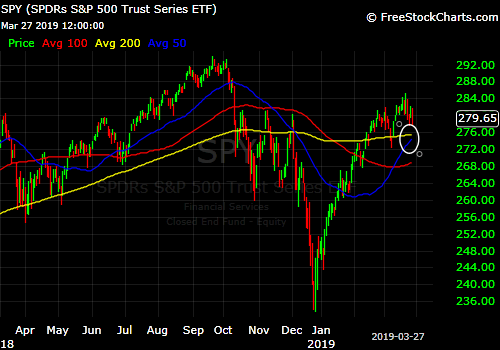

FYI, the “Golden Cross” has actually happened yesterday on the S&P 500 Equal Weight Index.

This is but a large cap phenomenon, however, as trends in moving averages of mid and small caps remain negative:

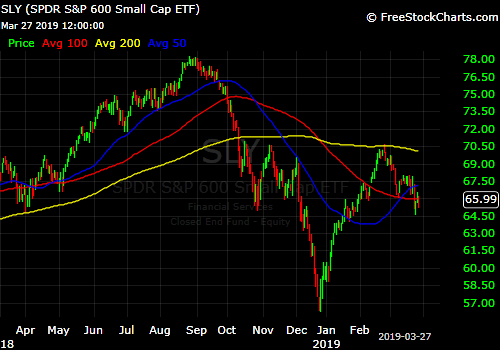
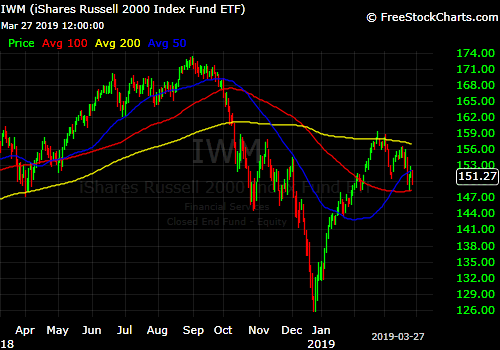
Earnings generally matter. While S&P 500 companies posted a 16.8% earnings gain in Q4’18 with a +3.4% surprise factor, the S&P 600 Index earnings were down 1.5% with a –2.6% surprise factor. Mid caps were slightly better with a 2.7% earnings gain on a 3.3% surprise factor.

And if you still care about Europe, whatever that means now, the STOXX 600 companies are trending towards a 1.8% earnings gain in Q4’18 on a –0.1% surprise factor and a 48% beat rate. Energy and Utilities earnings are +21.1% and +20.4% respectively, giving you an idea of what the rest looks like.
Trends in liquidity are also very important. This is from Fathom Consulting:
Our headline Fathom Liquidity measure (FLiq), has seen a significant rebound this year courtesy of sharp u-turns on rate hikes from both Fed Chairman Powell and ECB President Draghi. This has provided a much-needed boost to markets after the heavy 2018 Q4 sell-off. However, we note that market liquidity has recovered only to broadly neutral levels since the end of January 2019. More importantly, the fixed income sub-component to the FLiq, available to our clients, continues to signal challenging levels of liquidity in this market segment. We believe market liquidity, particularly in fixed income, needs to improve from current levels if the euphoric market sentiment is to persist.

Saudi Arabia’s Economic Overhaul Is Backfiring Saudis facing new taxes and an exodus of workers experience the downside of the crown prince’s reform agenda
In the past two years, Crown Prince Mohammed bin Salman has raised gasoline and electricity prices, introduced Saudi Arabia to new taxes and pushed foreign workers to leave the country to make way for Saudis.
As the economy of the world’s largest petroleum exporter slows, the measures are intended to jump-start its non-oil economy and provide new income for a government that relies on oil exports for 87% of its revenue. (…)
With fewer people spending money, the economy entered deflation in January. Consumer prices fell 2.2% in February compared with the same month last year, the steepest drop since a 2017 recession, according to the Saudi central bank. Real-estate prices were 15% lower at the end of 2018 compared with the beginning of 2016, according to Saudi government figures. (…)
Foreign direct investment was $2.4 billion through three quarters of 2018, up from a 14-year low of $1.4 billion for all of 2017 but far below historic averages and 2016’s annual figure of $7.4 billion. (…)
The International Monetary Fund also scaled back its outlook for Saudi economic growth this year to 1.8%, down from 2.3% in 2018. Non-oil economic growth is expected to be 2.1% this year, down from 2.2% in 2018, the IMF says.
Saudi Arabia has one of the biggest youth populations in the G-20, with almost 60% of its citizens under 30. Many of them are unemployed. Low-paid foreign workers make up most of the non-oil workforce, with the official unemployment rate for Saudis at 25%. The oil industry makes up 42% of GDP, and almost 90% of the country’s export revenue. (…)
-
Saudi Aramco to Buy Majority Stake in Petrochemicals Producer Sabic for $69.1 Billion Deal gives Crown Prince Mohammed freer hand to pursue ambitious plan to diversify kingdom’s economy
(…) The deal announced Wednesday would join the country’s two largest companies. In doing so, the deal will hand the Saudi sovereign-wealth fund, Sabic’s current owner, roughly the same amount of money it had expected to reap from an initial public offering for Aramco. (…)
The Sabic deal, with its transfer of cash, gives Prince Mohammed a freer hand to pursue his domestic dreams. The Public Investment Fund, or PIF, is the main vehicle for his economic plans, known as Vision 2030. (…)
While PIF aims to increase the nation’s wealth by investing overseas, it is also funding multibillion-dollar projects at home to create jobs for Saudi Arabia’s young population. Those efforts include building a Disney World-style metropolis of theme parks and resorts on the outskirts of Riyadh and a conurbation of hotels and tourist attractions on the Red Sea. PIF is also overseeing the development of a $500 billion futuristic city called Neom. (…)
1 thought on “THE DAILY EDGE: 28 MARCH 2019: Technicals Watch”
Re: Fed cutting rates:
Good read at Alhambra:
“On an accumulated basis, that is total profits for the entire YTD period, industrial firms booked bottom line growth of 10.3% for all of 2018. That was already concerning, about half the growth rate posted the year before in 2017. These same businesses have started out January and February 2019 with –14%.”
https://www.alhambrapartners.com/2019/03/27/china-partly-answers-for-why-markets-are-forecasting-even-more-powell-rate-cuts/
Comments are closed.