 You might have missed Saturday’s post: IN GODS WE TRUST
Economy Regains Momentum After Shaky Start to Year The U.S. economy started 2019 with a pop, growing at a 3.2% clip despite headwinds such as weaker domestic demand. The GDP data suggested the expansion has more room to run.
Gross domestic product—the value of all goods and services produced in the U.S., adjusted for inflation and seasonality—rose at a 3.2% annual rate from January through March, the strongest rate of first-quarter growth in four years, the Commerce Department reported Friday.
Rising exports, falling imports and higher inventory investment drove much of the growth, helping to offset weaker gains in consumer spending and business investment. (…)
After stripping out the volatile categories of trade, inventories and government spending, sales to private domestic buyers rose at an annual rate of 1.3%—half the rate of the prior quarter and a far slower pace than the overall GDP growth number. The housing sector was a drag on growth for the fifth-straight quarter.
Consumer spending, which makes up two-thirds of economic activity, rose at a mere 1.2% rate in the first quarter, down from a stronger 2.5% in the fourth quarter of 2018. (…)
The Commerce Department estimated the government shutdown shaved 0.3 percentage point from growth in the first quarter. (…)
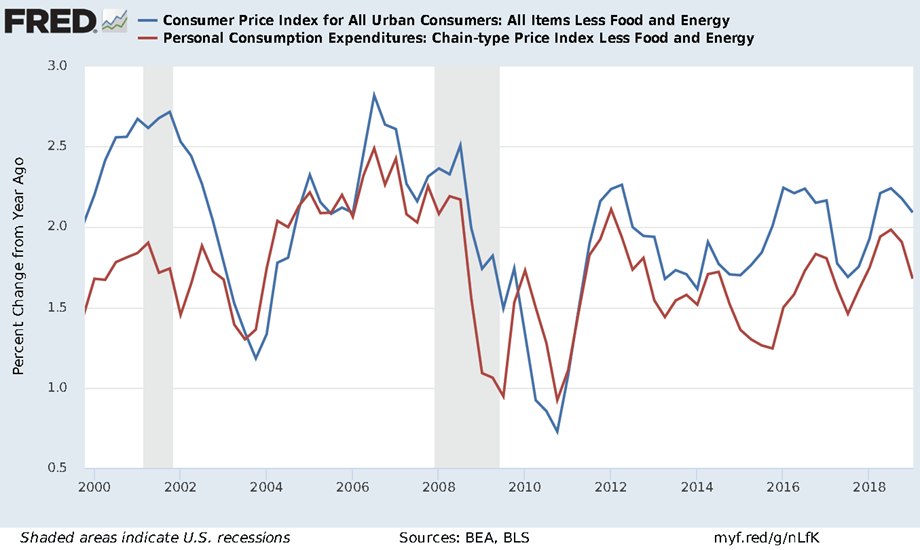
The Fed’s preferred inflation measure, the price index for personal-consumption expenditures, increased at a 0.6% seasonally adjusted annual rate in the first quarter, down from 1.5% in the final quarter of 2018 and below the Fed’s 2% target. Core prices—which exclude volatile food and energy costs—rose at a 1.3% rate. (…)
David Rosenberg agreed with President Trump’s assessment of the 3.2% GDP growth figure, “an incredible number”.
(…) So let’s stick to what can actually be observed and measured as opposed to “airy fair” estimates. You simply add up consumer spending, nonresidential construction, business capital spending, and housing – the key guts of the domestic private sector economy – and it slowed to a 0.9% annual rate, from 2.3% in Q4, 3.0% in Q3 and 4.0% in Q2 of 2018 as the tax stimulus kicked into high gear. At no time in the early-2016 “soft patch” were the domestic guts of GDP this weak. You have to go back to the third quarter of 2012 to see something this soft (…).
I’ll take more lipstick off. Add up all the areas of GDP that are actually sensitive to the economic cycle: consumer durable goods and cyclically-sensitive services and nondurables (transportation, recreation, restaurants, accommodation, clothing), business spending on plants and equipment and housing – collectively they contracted at a 2.1% annual rate. You read that correctly. The recession in underlying cyclical spending has already begun. (…)

The BEA publishes a series that I had been telling everyone all week to pay attention to – real final sales to domestic producers. Another way to look under the hood. This key metric was cut in half in Q1 to a 1.3% annualized rate (…). And why this is important is because it will be the real headline GDP growth rate that will soon be converging on this subpar trend, not the other way around. (…)

Hmmm…not obvious to me:

The YoY trends:
Same thing happened in Q1’18:

The WSJ editorial has valid points:
(…) Yet the government shutdown took some 0.3% off growth and that won’t be repeated in the second quarter. Auto sales took 0.49% off GDP in the quarter, but sales rebounded in March heading into the second quarter. Overall consumer spending contributed a relatively small 0.82% to GDP, perhaps due to the fall in consumer confidence after the stock market swoon in the last months of 2018. With job growth strong and wages rising, consumers should contribute more to the expansion the rest of this year.
Private business investment kicked in a relatively measly 0.27% in the quarter, which is disappointing. But (…) private capital investment has driven the rebound in growth since 2017. Business investment fell through the floor in the last half of 2015 and 2016, offset in part by a robust housing market. But that has reversed since Donald Trump took office, with business investment taking the lead as housing slowed and moved into negative territory in late 2018 and the first quarter of 2019.
What changed? Well, the economic policy mix. The Trump Administration lifted the threat of new regulation and harassment of business in 2017, which liberated long-stifled animal spirits. Then came the Trump tax reform with its sharp reduction in business tax rates and immediate 100% expensing of new investment. This was targeted precisely to stimulate the weak capital investment that had stymied growth in the Obama years.
This has also kept the U.S. expansion going even as growth in the rest of the world has slowed markedly. U.S. growth over the last four quarters year over year is now above 3%. Politicians in Germany or France would be elated, and maybe faint dead over, if they could keep growth above 3% for 12 months. (…)
U.S. Auto Sales Seen Cooling in April as Prices, Rates Rise
Cox Automotive and the team of J.D. Power and LMC Automotive on Friday both said they expect U.S. auto sales of about 1.37 million units in April. That represents a rise of 1% on a reported basis, but a decline of 3.5% when adjusted for an extra selling day this year.
Both surveys showed an expected seasonally adjusted annual sales rate in April of 16.9 million units, down from 17.5 million in March and 17.2 million in April 2018, according to figures from Cox.
Retail sales, which exclude fleet sales, are expected to post an even weaker showing in April. J.D. Power and LMC said they expect retail sales of 1.04 million units, down 5.3% on a selling-day adjusted basis and marking the 10th straight month of year-over-year retail sales declines. (…)
INFLATION…DEFLATION
April 20, the WSJ:
(…) But if it turns out that core inflation, which excludes volatile food and energy categories, falls and stays near 1.5% for several months, “I would be extremely nervous about that, and I would definitely be thinking about taking out insurance in that regard” by cutting rates, he said.
Dallas Fed President Robert Kaplan didn’t endorse such a move outright but said Thursday that inflation running persistently around 1.5% or lower is “something I’m going to certainly take into account” when setting rates.
Clearly communicating the rationale for an interest-rate cut would be especially important to avoid signaling alarm about the broader economic outlook, which could chill spending and investment. “We would need to be very careful,” said Mr. Evans.
Fed Vice Chairman Richard Clarida, speaking earlier this month on CNBC, appeared to be lowering the bar for such a move. He volunteered that a recession wasn’t the only situation in which the Fed had cut rates in the past, pointing to instances in the 1990s in which the central bank “took out some insurance cuts.” (…)
Mr. Evans must be quite nervous after the Q1 GDP report which showed core PCE inflation at +1.26% annualized in Q1 and +1.52% on average for the last 3 quarters. If Rosenberg’s thesis has any weight at the FOMC, an insurance cut is imminent.
Trump’s New Nafta Faces Mounting Trouble in House President Trump’s push to revamp North America’s trade rules is hitting a roadblock in Washington as Democrats and labor groups demand changes, dimming its chances of passage before next year’s election.
By Chuck Grassley (R- Iowa)
(…) As chairman of the Finance Committee, I’m leading the Senate effort. I’ve been involved in the passage of every U.S. free-trade agreement, and it’s never easy. Reorganizing a massive economic relationship affects many constituencies, and that’s inevitably complicated.
I’ve met with congressional colleagues, as well as U.S., Canadian and Mexican trade officials, to discuss how our nations will secure legislative approval of USMCA. A significant roadblock is the administration’s tariffs on steel and aluminum and retaliatory Canadian and Mexican tariffs on U.S. products. These levies are a tax on Americans, and they jeopardize USMCA’s prospects of passage in the Mexican Congress, Canadian Parliament and U.S. Congress. Canadian and Mexican trade officials may be more delicate in their language, but they’re diplomats. I’m not. If these tariffs aren’t lifted, USMCA is dead. There is no appetite in Congress to debate USMCA with these tariffs in place. (…)
Earlier this year U.S. Trade Representative Robert Lighthizer told the House Ways and Means Committee that failing to pass USMCA this year would damage the credibility of America’s global trade agenda, particularly the efforts to secure a deal with China. He’s right.
The administration can take the lead by promptly lifting tariffs on steel and aluminum from Canada and Mexico and working with allies to address the true source of overcapacity: China. This essential step is fully within the administration’s control and would immediately clear a significant hurdle to passage. Meanwhile, Speaker Nancy Pelosi and congressional Democrats should recognize this historic win for the country and engage in good faith to pass USMCA this year.
USMCA is good for the environment, for workers, for jobs and for nearly every sector of America’s economy. I hope Washington rises to the occasion.
EARNINGS WATCH
From Refinitiv/IBES:
Through Apr. 26, 229 companies in the S&P 500 Index have reported earnings for Q1 2019. Of these companies, 77.3% reported earnings above analyst expectations and 17.0% reported earnings below analyst expectations. In a typical quarter (since 1994), 65% of companies beat estimates and 21% miss estimates. Over the past four quarters, 76% of companies beat the estimates and 17% missed estimates.
In aggregate, companies are reporting earnings that are 6.1% above estimates [actual growth +3.8%], which compares to a long-term (since 1994) average surprise factor of 3.2% and the average surprise factor over the prior four quarters of 5.4%. The E
The estimated earnings growth rate for the S&P 500 for 19Q1 is -0.3%. If the energy sector is excluded, the growth rate improves to 1.2%. Five of the 11 sectors in the index expect to see an improvement in earnings relative to 18Q1.
Of these 229 companies, 56.1% reported revenues above analyst expectations and 43.9% reported revenues below analyst expectations. In a typical quarter (since 2002), 60% of companies beat estimates and 40% miss estimates. Over the past four quarters, 67% of companies beat the estimates and 33% missed estimates.
In aggregate, companies are reporting revenues that are 0.2% below estimates, which compares to a long-term (since 2002) average surprise factor of 1.5% and the average surprise factor over the prior four quarters of 1.1%.
The estimated revenue growth rate for the S&P 500 for 19Q1 is 5.0%. If the energy sector is excluded, the growth rate improves to 5.5%.
Trailing EPS are now $162.72, up from $161.93 for all of 2018.
Revisions have turned positive last week…
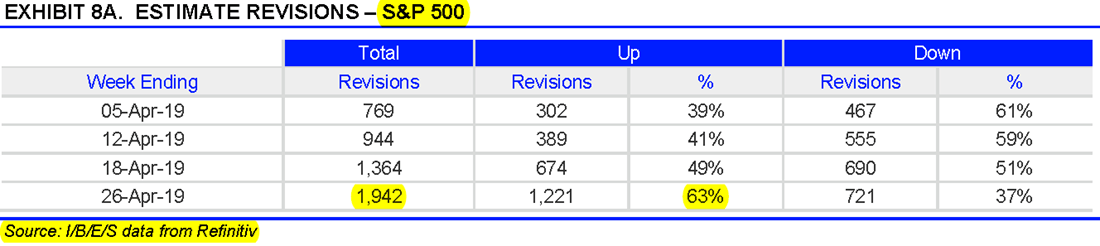

…but have yet to translate into better official estimates for the rest of the year: the estimated earnings growth rate for the S&P 500 for 19Q2 is 1.9% (+2.8% on April 1). If the energy sector is excluded, the growth rate improves to 2.0%. Q3: +2.1% vs +2.7% and Q4 +8.6% vs +8.9%. Full year 2019: +3.0% vs +3.3% on April 1.
- Despite the earnings beats (above), companies have turned much more cautious on growth. (The Daily Shot)

Source: BofA Merrill Lynch Global Research
The Rule of 20 P/E is 20.03 @ 2934 on the S&P 500 Index. Since the December low (2343), the Index is up 25.2% as the Rule of 20 P/E rose 19% from 16.83 while trailing EPS rose 1.4% and inflation receded from 2.3% to 2.0%.

Reasonably good earnings coupled with downward inflation trends should keep the Rule of 20 Fair Value (currently 2929, yellow line) in a positive trend in coming months. Generally, the Rule of 20 P/E traverses the “20” Fair P/E when the Fair Value is rising. We don’t know the future but it seems fair to think that most of the recent market angsts have faded: the recession risk, a hawkish Fed, declining earnings, inflation. Remaining, in no particular order: China, trade wars, Italy, Brexit, oil, deflation, debt.
TECHNICALS WATCH
Lowry’s Research sees little evidence to support contentions of a significant market top as “the forces of Supply and Demand continue to support a healthy bull market headed for further new highs in the months ahead.”
I should warn, however, that Lowry’s Selling Pressure and Buying Power indices were on a converging trend last week for the first time since mid-September. To be monitored.
For now, most technical indicators are green, except investor sentiment measures, most of which being high (contrarian negative).
From Barron’s:
(…) Only 49% of the 148 professional money managers responding to Barron’s spring 2019 Big Money poll call themselves bullish about the prospects for stocks over the next 12 months, down from 56% in our fall 2018 survey. The percentage of bulls hasn’t dipped below 50% since the fall 2016 survey.
At the same time, the bears’ ranks have grown to 16% from just 9% last fall, while the neutral camp has held steady at 35%. And almost 70% of Big Money managers consider stocks fairly valued today—the highest percentage in nearly half a decade. (…)
What were they thinking in January 2018 when the actual P/E was 21.2 and the Rule of 20 P/E was 23.5?
IN GODS WE TRUST (follow up)
I posted this last Saturday morning but I read Steve Blumenthal’s On My Radar today. Good supplement:
(…) Today, we’ll look at what I believe are two of the most important indicators you can follow to help you manage the risk and potentially profit from the defaults that will present in the next recession. Timing, of course, is critical and I’m trusting that what I’ve followed for nearly 27 years can help you and me identify the turning point. To which, I believe the HY price trend holds the key. (…)
The leveraged loan market is generally where companies whose credit is so weak they can’t access the high-yield bond market to obtain financing. Read that last line again. This is the sub-prime of the corporate bond market. The popularity of leveraged loan funds and ETFs was enabled by zero interest rate policy. Seeking to improve returns on their savings, investors moved their money into riskier asset classes. That liquidity, like sub-prime in the mid-2000’s, gives borrowers to hold the upper hand. The problem is one of size, scale and poor quality. Let’s take a closer look. (…)
Moody’s evaluates and rates covenant protection on a scale of 1 to 5 with 5 being the least protection for lenders and 1 being the best. [It is now above 4.2]. (…) Next is a look showing the percentage of covenant-light loans in the index grew from 31% in June 2012 to 79% in September 2018. It hit 87% in January. (…)
When you consider the $1.22 trillion in leveraged loans, the $1.21 trillion in high yield junk bonds and the $2.56 trillion in BBB-rated corporate bonds, the $2.55 trillion in High Grade/Quality bonds is “dwarfed” by the $5 trillion in high risk debt.
Moody’s estimated the post-default trading prices for senior unsecured bonds was 53.9% in 2017, up sharply from 31.5% in 2016. The high yield bond market declined 45% in the last crisis. Given the low covenant quality today, I estimate the next recession will see that $5 trillion in debt off 60% from its highs. The sub-prime problem turned out to be an approximately $3 trillion global blow-up that is now defined as the “Great Recession.” I believe the next recession and default wave that concludes by recession-end will match or exceed the sub-prime problem when you factor in the derivatives that are tied to the corporate credit markets. (…)
The HY market is a good lead indicator for the equity market and both are good lead indicators for the economy. The fireworks will occur in the next recession. Thus, I believe the HY market holds the key. Keep it on your radar. (…)

My Saturday post explains the corporate debt box the Fed has put itself in with its lower for longer experiment. FOMC voters can shy away from tightening but the bond market will eventually do the job for them. Not happening just yet:

1 thought on “THE DAILY EDGE: 29 APRIL 2019”
==> Latest GDP Numbers Revealed Some Troubling Trends
By Matthew C. Klein
Updated April 26, 2019
Excluding inventories and trade, the U.S. economy grew at just a 1.5% annual rate in the first quarter. That is the slowest pace of growth since the fourth quarter of 2015, when falling stock prices, spiking credit spreads, and a soaring dollar were causing some to worry the economy could tumble into recession. Back then, the Fed overestimated the economy’s underlying growth and was eventually compelled to raise interest rates by far less than officials had originally thought. The latest data confirm something similar has happened more recently.
The components of GDP that drive the business cycle are household spending on durable goods (mostly motor vehicles, furniture, and appliances), business investment in equipment, and homebuilding. These account for a small share of overall economic activity but explain most of the changes in GDP growth rates, particularly during recessions and recoveries. These cyclical components subtracted 0.5 percentage point from growth in the first quarter—the first negative reading since the second quarter of 2009, when the U.S. economy was still in the midst of the 2007-09 recession.
https://www.barrons.com/articles/latest-gdp-numbers-have-something-for-everyone-51556295087
FRED Chart: https://fred.stlouisfed.org/graph/?g=nM6s
Comments are closed.