Personal Income, February 2019; Personal Outlays, January 2019
Due to the recent partial government shutdown, this report combines estimates for January and February 2019. January estimates include both personal income and outlays measures, while February estimates are limited to personal income. Estimates of outlays for February will be available with the next release on April 29, 2019.
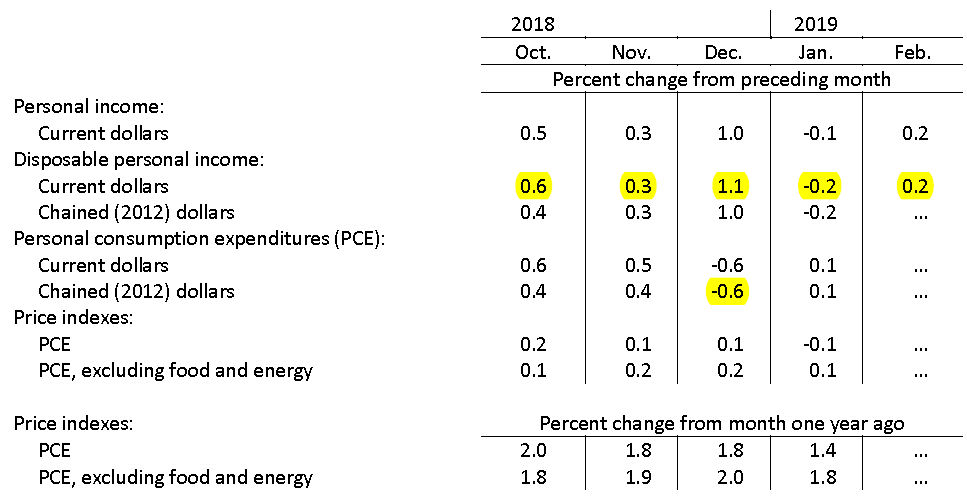
Still in the dark on spending after the very weak December that followed strong Oct. and Nov. real spending. The good news is that income is rising at a fast clip even with the Jan-Feb wash. Disposable income was up 5.8% YoY in Q4’18.
U.S. Economy Had Less Momentum Heading Into 2019 as Corporate Profits Stalled Spending by consumers, state and local governments and businesses was revised lower
Gross domestic product, a broad measure of goods and services produced across the economy, rose at a 2.2% annual rate in the fourth quarter, adjusted for seasonality and inflation, down from an earlier estimate of 2.6%.
A measure of U.S. company earnings, corporate profits after tax with inventory valuation and capital-consumption adjustments, posted no growth in the fourth quarter compared with the prior three months, the Commerce Department reported Thursday.
That marked a slowdown from a 3.5% quarter-over-quarter increase in the third quarter, 2.1% in the second and 8.2% in the first. Measured from a year earlier, after-tax profits rose 14.3%, which was the slowest year-over-year increase of any quarter in 2018 but nonetheless robust by historical standards. (…)
The Commerce Department data showed consumer spending, which accounts for more than two-thirds of the economy, was weaker in the fourth quarter than initially estimated, largely due to sharp downward revisions to spending on long-lasting items like recreation goods and vehicles. Consumer spending increased at a 2.5% annual pace from October to December, compared with 3.5% in the third quarter. (…)
The housing sector was a headwind for growth for the fourth quarter in a row as residential investment fell at a 4.7% annual pace. Investment in nonresidential structures declined at 3.9% rate in the fourth quarter. (…)
Business investment still helped drive overall GDP growth in late 2018, contributing 0.73 percentage point to the fourth quarter’s 2.2% growth rate. In another positive sign for the U.S. economy, growth in exports was revised slightly higher from last month’s estimate, to a 1.8% annual pace, while the rate of imports was revised down to a 2% annual rate. That meant foreign trade exerted a mild 0.08 percentage point drag on growth, smaller than initially thought.
By one measure of the nation’s total output for 2018 compared with total output for 2017—which offers a look at broader trends—the economy grew 2.9% last year, unchanged from the prior reading.
By a separate measure, output in the fourth quarter of 2018 versus the fourth quarter of 2017—which gives a look at more recent trends—the economy grew 3.0% last year. That was slightly below the initial estimate of 3.1% growth. (…)
Charts from Haver Analytics:


GDP levels – US versus other developed markets

U.S. Pending Home Sales Fall
The National Association of Realtors (NAR) reported that pending home sales declined 1.0% (-4.9% y/y) during February following a 4.3% gain, revised from 4.6%. Sales have declined 9.7% since the peak in April 2016.
Sales were mixed throughout the country. In the Midwest sales declined 7.2% (-6.1% y/y) after a 3.0% rise. In the Northeast sales slipped 0.8% (-2.6% y/y) after a 0.3% gain. Offsetting these declines, sales rose 1.7% in the South (-2.9% y/y) after an 8.9% jump. In the West sales improved 0.5% (-9.6% y/y) following a 0.1% uptick. (…)


-
The 4% Mortgage Is Back The average rate on a 30-year fixed mortgage was down nearly a quarter point this week from a week earlier, its biggest drop in over a decade
(…) In many cases rates are lower than 4%. (…) Lower rates also are boosting refinancing applications, which jumped 12% over that span. As of last week, 3.3 million homeowners stood to save money by refinancing their mortgages, the most since January 2018, according to Black Knight Inc., a mortgage-data and technology firm. (…)
- However, the recent sharp downturn in mortgage rates is expected to support the housing market in the months to come. (The Daily Shot)

Source: BCA Research
National home prices grew by approximately 4% annually in fourth quarter-2018 (4Q’18), slower than the roughly 6% annual growth home prices have averaged for the last six years. West Virginia led the slowdown with 6% annual home price depreciation while California’s home price growth stalled at less than 1% annually in 4Q’18. “National home prices are currently 2% overvalued on a population weighted average basis,” said Managing Director Grant Bailey. Fitch expects home price growth to continue slowing this year.
Another sign of the cooling housing market is the rising inventory of new housing that has not been purchased. New home supply not absorbed by the market reached its highest level in over eight years with higher priced homes in the Northeast and West accounting for much of the increase. “The Western U.S. in particular has seen listings for mid-to-high tier priced homes increase by 30% last month compared to the same period last year,” said Bailey. (…)
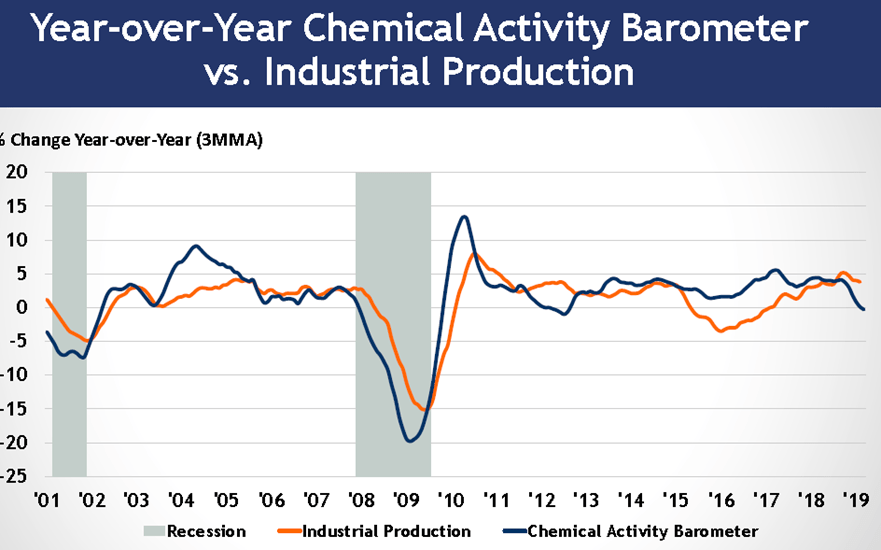
The Chemical Activity Barometer (CAB), a leading economic indicator created by the American Chemistry Council (ACC), rose 0.1 percent in March on a three-month moving average (3MMA) basis, the first gain in five months. On a year-over-year (Y/Y) basis, the barometer is down 0.3 percent (3MMA).
The unadjusted measure of the CAB rose 0.3 percent in March following six months of shrinking activity. It declined 0.1 percent in February and had a flat reading in January. The diffusion index rebounded to 65 percent in March, up from 57 percent in February. A year earlier, it was 71 percent. The diffusion index marks the number of positive contributors relative to the total number of indicators monitored.
“The CAB continues to indicate gains in U.S. commercial and industrial activity through mid-2019, but at a markedly slower rate of growth, as measured by year-earlier comparisons,†said Kevin Swift, chief economist at ACC. (…)
China, U.S. Pore Over Deal Text to End Trade War Negotiators are now going line-by-line through the draft of an agreement.
Yellen Sees No U.S. Recession, Says Fed Won’t Cut in 2019
(…) “But my baseline is I don’t see a recession, I don’t think it’s likely. And I expect them to stay on hold during the year.†Yellen said Fed officials have “been looking to engineer something of a slowdown†because the labor market is “really quite tight.†(…) Yellen said she’s more concerned about disinflation than inflation at this point. A slowing rate has been weighing on inflation expectation, “and in a world of low interest rates, it’s not a good thing to have inflation expectations slip.†(…)
CANADA HOUSING
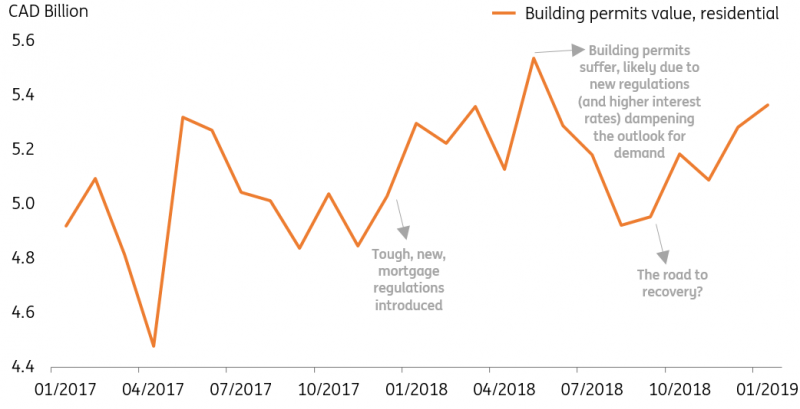
(…) Higher interest rates and tighter mortgage rules have triggered a housing market slowdown. Nonetheless, investment in residential construction has picked up in recent months and in particular, single-dwelling construction has started to improve. So are things really that bad?
Of course, it’s important not to focus solely on the monthly figure due to the sector’s volatility but when you look at building permits – which tend to be a leading housing market indicator given that you (typically) can’t construct without a permit- things look to be recovering.
Are building permits pointing to a recovery?
(…) This should also be supported by the Liberal government’s federal budget for 2019. First-time home buyers are being incentivised to jump on the housing ladder with government plans to absorb part of the cost. That said, this inducement won’t come until effect until the autumn so some home buyers may delay their decisions until then. This could make the housing market appear weaker-than-expected in the near-term. (ING)
 Fed’s New Balance Sheet Plan Means Easier Global Liquidity Conditions
The Fed’s new guidance on its balance sheet policies has material implications for the outlook for global liquidity and will help perpetuate an environment of low market interest rates, says Fitch Ratings. Global quantitative tightening will be a lot less intense than expected and may even be completely off the agenda this year if the ECB restarts net asset purchases.
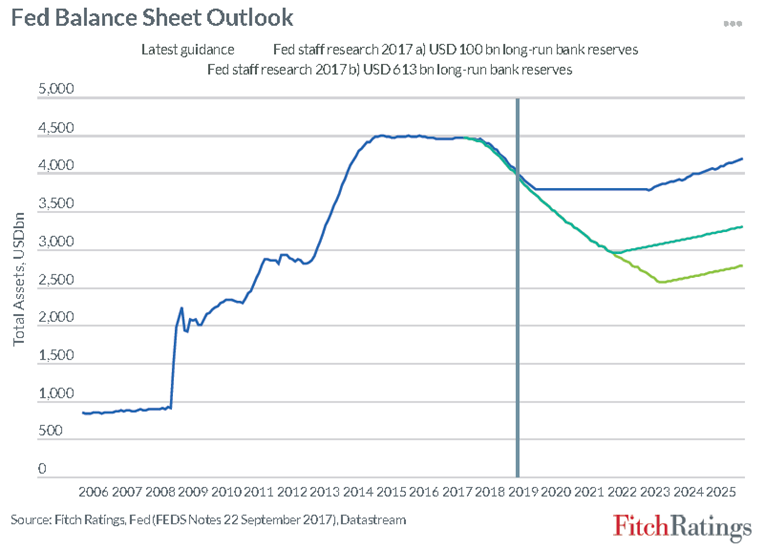
The Fed announced last week that it would taper the run-down of its balance sheet from May 2019 (by reducing the threshold above which maturing Treasury securities are reinvested to USD15 billion from USD30 billion per month) and cease reducing assets altogether after September 2019. This implies a much shorter period of balance sheet normalisation and a much higher level of Fed asset holdings over the medium term than previously suggested.
This is highlighted in the latest chart of the month from Fitch’s economics team, which compares the balance sheet path implied by the latest guidance with earlier projections from Fed research staff published in September 2017. The balance sheet is now set to stabilise at around USD3.8 trillion compared with previous estimates of the Fed’s normalised balance sheet of USD2.5 trillion to USD3.0 trillion. This two year run-down will see assets decline by USD700 billion from their peak, contrasting with earlier estimates of a four to five year normalisation period with a peak to trough fall in assets of USD1.5 trillion to USD2.0 trillion.
The decision to wrap-up balance sheet normalisation earlier primarily reflects the Fed’s decision to maintain the current administrative ‘floor-based’ system for setting interest rates indefinitely. This system requires an abundance of liquidity in the Federal Funds market to ensure that commercial banks do not bid up overnight interest rates above the policy interest rate. Estimates of the level of commercial bank reserves (CBR) at the Fed necessary to ensure abundant liquidity have been revised up sharply, culminating in higher estimates of the Fed’s normalised balance sheet.
However the Fed has also been deliberately cautious. Survey estimates suggest that CBR of around USD800 billion would be sufficient to ensure abundance. This would imply a normalised balance sheet of USD3.2 trillion once the Fed’s other liabilities are taken into account. In addition the Fed seems very keen that CBR decline only very gradually towards the point where overnight liquidity could start to become scarce, given the uncertainty surrounding exactly where this point lies. CBR would have fallen to USD1.4 trillion by September 2019, well in excess of most estimates of a possible scarcity point. With the Fed’s overall balance sheet flat from September, CBR would subsequently decline gradually as demand for currency rises and banks meet this by drawing down their reserve balances at the Fed. This process will give the Fed plenty of time to learn more about banks’ liquidity demands.
The revised plans imply that Fed asset holdings will fall by USD300 billion over 2019 as a whole. Fitch’s estimates of global quantitative easing/tightening (QE/QT) – calculated by adding up the annual flow of asset purchases/sales of the Fed, ECB, Bank of England and Bank of Japan (BOJ) in US dollar equivalent terms – had previously been assuming that Fed assets would decline by around USD440 billion in 2019. The new Fed plans mean that global QT will be modest in 2019 given that we expect the BOJ to purchase assets of around USD 260 billion (JPY30 trillion). Moreover, if the ECB restarts asset purchases later in 2019, global QE may even continue this year.
THE MOUSE TRAP
Disney just closed its $85B acquisition of 21st Century Fox, a truly redefining deal. Matthew Ball, former Head of Strategy at Amazon Studios, wrote a very thoughtful article for REDEF:
While on corporate strategy, you may also enjoy Ben Thomson’s
What the heck, here’s more reading if you care:
2 thoughts on “THE DAILY EDGE: 29 MARCH 2019”
Oh boy!
“I never really thought about this, but, you know, I thought that — the more I thought about it, the more I thought this is economic policy right on the front line,” Mr. Moore said. “That’s what I do. I thought this would be an amazing experience, and hopefully I could work with Powell to get him shifted over to a more pro-growth” policy.
“I would use commodity prices as a guide,” Mr. Moore added. “I wouldn’t be doctrinaire about it.”
https://www.nytimes.com/2019/03/26/business/stephen-moore-federal-reserve-trump.html
I probably should look at his published methodology for his commodity thought, related to Fed interest rates, but here’s what I dreamed up @ FRED — adding to my confusion, in terms of what commodities, what markets, e.g., are we talking global stuff, like copper and oil or what — and if so, doesn’t the global price add some noise to USA interest rates … maybe not, just curious, looking for trouble.
https://fred.stlouisfed.org/graph/?g=ntLw
Comments are closed.