U.S. Personal Spending & Income Gains Slow
Personal consumption expenditures improved 0.3% (5.0% y/y) during December following an unrevised 0.4% November rise. The increase matched expectations in the Action Economics Forecast Survey. During all of 2019, consumer spending rose 4.0%, the weakest increase since 2016. In constant dollars, spending edged 0.1% higher (3.3% y/y) last month. For the full year, real spending increased 2.6%, down from a 3.0% gain in 2018. Real durable goods spending declined 0.3% (+7.9% y/y) during December following a 1.2% increase. Spending on motor vehicles fell 2.2% (+1.6% y/y) and reversed most of November’s increase. (…) Real spending on services improved 0.1% (2.3% y/y) following a 0.3% gain. The rise was held back by a 0.3% fall (+1.4% y/y) in spending on housing & utilities. (…) spending at restaurants & hotels increased 0.5% (2.7% y/y).
Personal income improved 0.2% last month following a 0.4% November increase, revised from 0.5%. A 0.3% rise was expected. Wages & salaries improved 0.3% (5.2% y/y) after two months of 0.4% increase. (…)
Disposable personal income rose 0.2% last month (3.6% y/y) after a 0.4% November increase. Adjusted for price inflation, take-home pay eased 0.1% (+2.0% y/y) after November’s 0.3% rise.
Last month’s strength in spending relative to the gain in income lessened the personal savings rate to 7.6%, its lowest level since July. The level of personal saving declined 10.4% y/y last month.
The PCE chain price index increased 0.3% (1.6% y/y), the strongest rise since April. The price index excluding food & energy rose 0.2% (1.6% y/y) after four straight months of 0.1% increase. Energy prices improved 1.5% (3.7% y/y) after a 0.8% gain. Food prices held steady (0.8% y/y) for the third month in the last four.
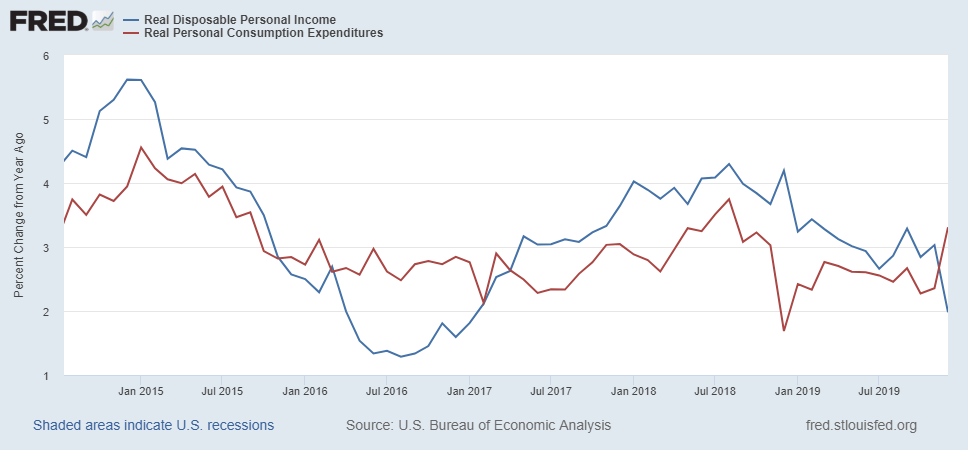
As we all know, the American consumer has been the most dependable pillar of the economy. In the last 3 years, real disposable income has grown 3.0% annually on average, sustaining a 2.7% average annual gain in real expenditures. In Q4’19, disposable income grew at the same rate as spending (2.6%) but income growth slowed to 2.0% in December although spending rose 3.3% YoY as consumers dipped into their savings (or borrowed) to finance their Christmas giveaways.
The lines in the chart must cross again…
MANUFACTURING PMIs
The U.S PMI will be released today at 9:45. Will post it tomorrow. The coronavirus outbreak is making January’s PMI somewhat less relevant.
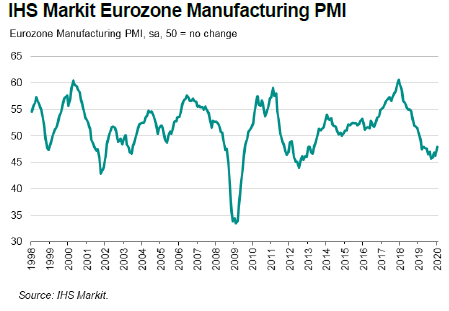
Operating conditions in the euro area manufacturing economy continued to weaken at the start of the year, but at a noticeably slower rate. After accounting for seasonal factors, the IHS Markit Eurozone Manufacturing PMI® registered 47.9, slightly better than the earlier flash reading and above December’s 46.3. Although the index has now recorded below the crucial 50.0 no-change mark for 12 months in succession, the latest reading was the highest since April 2019.
Market groups data signalled that the consumer goods category remained the strongest-performing during January, registering marginal growth for a second successive month. In contrast, the intermediate and investment goods sectors both continued to contract, although rates of decline weakened in each instance.
Greece was the strongest-performing, with growth reaching a five-month high. Ireland and France were the other two nations to record expansion, with rates of growth modest in each case.
Germany was again the weakest-performing country, despite its respective PMI reaching an 11-month high. Modest deteriorations in operating conditions were seen in Italy and Spain, whilst Austria and the Netherlands saw marginal deteriorations.
Euro area manufacturing production and new order levels both continued to decline at the start of 2020, although in each case at weaker rates than at the end of 2019. The modest reduction in output extended the current downturn to 12 months, whilst new orders have deteriorated continuously since October 2018.
The rate of decline in new work was, however, the slowest for over a year, helped in part by only a marginal reduction in new export sales.
January data again provided evidence of spare capacity in the manufacturing economy with backlogs of work cut for a seventeenth successive month, albeit to the weakest degree since February 2019.
Job losses were also registered for the ninth month in a row and, whilst not declining to the same degree as December’s near seven-year record, the rate at which employment fell remained marked. Germany again led the way in terms of job shedding, followed by Spain where employment declined to the greatest degree for over six years.
Eurozone manufacturers also continued to make cuts to their purchasing activity, although in line with trends for output and new orders, the fall in purchasing activity was the weakest in 11 months. Companies continued to signal a preference for utilising inventories wherever possible, with the rate of destocking in finished goods the sharpest in nearly three-and-a-half years.
Average lead times continued to improve meanwhile, shortening for an eleventh successive month, and ongoing supply-side slack weighed on input prices. Latest data showed that input costs fell for an eighth month in succession and afforded manufacturers further room to cut their own charges. January’s survey signalled another fall in output prices, maintaining a trend that has been evident since last July.
Looking ahead to the next 12 months, confidence about the future jumped at the start of 2020 to its highest level since August 2018. The improvement in sentiment was also broad-based, with optimism led by Greece, Ireland and the Netherlands. Optimism remained lowest in Austria and Germany despite reaching 16- and 17-month highs respectively.
Chris Williamson, Chief Business Economist at IHS Markit:
Eurozone manufacturing started 2020 with green shoots of recovery in sight. Most encouragingly, order books moved closer towards stabilisation, falling to the smallest extent since late 2018. With the survey indicating the steepest fall in warehouse stocks since September 2016, the new orders-to-inventory ratio, a key forward-looking indicator for factory production, surged to its highest for nearly one-and-a-half years.
Expectations for output growth also leaped to the highest since August 2018 amid a broad-based improvement of sentiment across the region, with an especially important upturn in confidence seen in Germany.
The improvement adds to our view that the eurozone economy could see growth strengthen in the coming months, meaning the ECB will hold off with any policy changes and instead focus on its strategic review. However, key risks which could alter the brightening outlook include the threat of US tariffs and trade war escalation, Brexit-related disruptions to trade as well as uncertainty surrounding the impact of the Wuhan coronavirus.
 January 2020 data were collected 13-22 January 2020.
Latest PMI data signalled the softest improvement in operating conditions across China’s manufacturing sector for five months in January. Companies signalled slower increases in new orders and output, while payrolls fell for the first time since last October. The latter was partly linked to attempts to reduce costs, as firms saw a solid increase in overall operating expenses at the start of the year. More cautious approaches were also taken in terms of purchasing activity and stocks of inputs and finished items, which all fell slightly in January. Factory gate prices rose only modestly, however, due to competitive market pressures.
On a more positive note, an easing of China-US trade tensions helped to boost business confidence regarding the 12-month outlook for output. Notably, optimism about the year ahead rose to its highest level for 22 months.
The headline seasonally adjusted Purchasing Managers’ Index™ (PMI™) edged down from 51.5 in December to 51.1 in January. Although remaining above the neutral 50.0 mark, the figure indicated only a marginal improvement in the health of the sector. Notably, the rate of improvement was the slowest recorded since the current upturn began in August 2019.
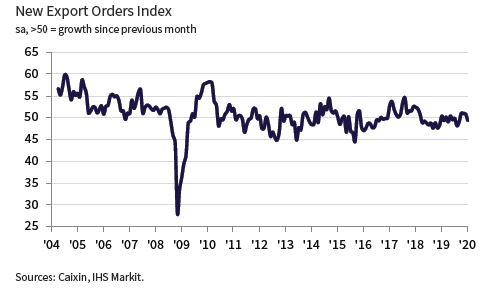
Weighing on the headline PMI was a softer rise in new orders received by Chinese goods producers. The latest increase in new work was modest overall, with the rate of growth having eased for a third successive month. Data indicated that this was partly due to weaker external demand, as new export business fell for the first time in four months, albeit only slightly.
The subindex for total new orders continued to weaken and dropped to a level not seen since last September. The gauge for new export orders fell into contractionary territory, ending three straight months of expansion.
Reflective of the trend for new orders, output growth eased to a moderate pace in January. Moreover, the latest upturn in production was the softest seen for five months.
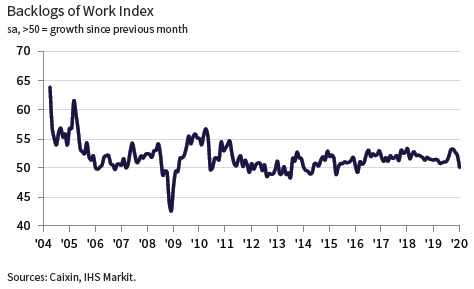
At the same time, some firms implemented down-sizing policies as part of attempts to reduce costs, which contributed to a renewed fall in employment. Concurrently, January data indicated an easing of capacity pressures, with backlogs of work broadly stable at the start of the year following a 46-month sequence of accumulation.
A cautious approach was taken in terms of buying activity. Following a six-month sequence of growth, purchasing activity fell slightly in January. As a result, companies reported a slight dip in their inventories of pre-production stocks for the first time since last August. Inventories of finished items also fell marginally.
On the prices front, Chinese manufacturers recorded a solid increase in operating expenses. Firms often attributed higher input costs to greater prices for raw materials. Furthermore, the rate of cost inflation was the steepest recorded for 14 months. However, competitive market pressures limited the extent to which companies could pass on their cost burdens to clients, with selling prices rising only modestly at the start of 2020.
An easing of trade tensions between China and the US helped to lift business confidence to a 22-month high in January. Firms also attributed optimism to new product launches and expectations that global demand conditions will improve.
(…) In the near term, China’s economy will also be impacted by the new pneumonia epidemic, and therefore need to gain support from proper countercyclical policies.

There was little respite for Japanese manufacturers at the start of
the new decade, with latest PMI data signalling another challenging
month as demand conditions remain fragile. Output was reduced
for a thirteenth month running, with sub-sector data revealing that
the capital goods segment was a particular source of weakness.
Export orders also fell in January, although the rate of decline
eased notably.Meanwhile, there were signs of inflationary pressures picking up and business confidence strengthened to a 17-month high.
The headline Jibun Bank Japan Manufacturing Purchasing Managers’ Index™ (PMI)® recorded 48.8 in January. This was a slight increase from December’s 48.4, but indicated a further deterioration in business conditions facing Japanese goods producers. The headline index has recorded below the crucial 50.0 mark in every month since last May, with the latest reading coming in slightly below the average across this period (49.0).
Japanese manufacturers reduced output in January for a thirteenth month running. Sub-sector data revealed that cutbacks were broad-based across consumer, intermediate and investment goods makers, although the decline was particularly severe for the latter. Unfavourable demand conditions was the main factor causing production to fall, according to panel comments.
As has been the case since the start of last year, total order book volumes contracted. While the decrease was the softest in four months, it was stronger than seen on average across the current sequence of falling sales. Some firms attributed lower workloads to caution among existing clients, who reportedly trimmed their demand. Orders from overseas also fell amid reports of weak global trade conditions. That said, export orders fell only marginally and at the weakest pace since the downward trend started at the end of 2018.
Japanese manufacturers demonstrated a desire to keep stock levels lean in January as both pre- and post-production inventories declined. In both cases, however, rates of depletion eased. Purchasing activity also decreased during the latest survey period amid weak demand.
Latest survey data showed a further easing of capacity pressures in January. Backlogs of work fell solidly, albeit at the slowest rate for five months. Despite this, Japanese goods producers increased their workforce numbers. The rate of employment growth gathered pace and was above the historical trend.
Elsewhere, both survey measures of prices moved in an upward direction during January. Input price inflation quickened to a six-month high amid reports of higher raw material costs and unfavourable exchange rate movements. Firms responded by raising their output prices for the first time since last May, although the rate of increase was only slight.
Lastly, there was a notable improvement in business sentiment during January. Upbeat demand forecasts, particularly for electronics and related products, helped push output expectations up to their highest level in 17 months.

Boeing’s Woes Create Headwinds for U.S. Economy Boeing’s halt in production of the 737 MAX jetliner could reduce first-quarter GDP by half a percentage point, and second-quarter output could also take a hit, according to at least three leading economists.
(…) Boeing said last week it doesn’t expect to restart production until it gets regulatory approval to resume flying, which it hopes to secure by midyear and then slowly ramp up production over the next two years. (…)
It uses a network of 600 major suppliers providing everything from engines to seats to bathrooms. Boeing’s Seattle-area factories alone employ 12,000 workers on the MAX. (…)
India steps up farm support, offers tax cuts to revive faltering growth
Prime Minister Narendra Modi’s government is grappling with the country’s worst slowdown in a decade, with falling employment, consumption and investment ratcheting up the pressure to revive growth.
The government estimates growth this year to March 31 will slip to 5%, the weakest pace since the global financial crisis of 2008-09. It also warned an expected rebound the following year might entail a blow-out in fiscal deficit targets. (…)
Experts Race to Figure Out How Contagious the Coronavirus Is
Studies published in recent days say the new virus appears to be more contagious than seasonal flu and on par with the similar pathogen behind an outbreak of severe acute respiratory syndrome in 2002 and 2003. The new virus’ mortality rate, however, is far below that of SARS. (…)
China’s health commission says incubation is generally between three and seven days, with the longest period being 14 days, and that people can spread the virus before appearing ill. That makes a two-week quarantine an important prevention measure—and casts doubt on the efficacy of temperature checks, the main screening method at immigration and other checkpoints. (…)
A study led by a researcher from Boston’s Northeastern University—using mathematical probability models based on travel patterns and confirmed international cases—estimated the median number of infections in Wuhan at 31,200 as of Wednesday, compared with that day’s official tally of 2,261.
Professors at the University of Hong Kong using similar methods published a study in the Lancet on Friday that estimated there were 75,815 infected in Wuhan as of Jan. 25, when official counts were still in the hundreds.
(…) “they all point in the same direction,” said Christian L. Althaus, an epidemiologist at the University of Bern in Switzerland who co-wrote a study estimating the basic reproduction number of the virus at 2.2. “There is a potential threat of a global pandemic if this reproduction number cannot be reduced.” (…)
Chinese officials have said the outbreak could peak or even begin to subside by Feb. 8, though some overseas experts have suggested the outbreak might not peak for several weeks. (…)
Recent studies indicate that stringent control measures will be needed not just in China, but in several other countries, to curtail the outbreak. (…)
(…) That means the pathogen might be transmitted along the fecal-oral route, not just from coming into contact with virus-laden droplets emitted from a sick person’s cough. Doctors have focused on respiratory samples from pneumonia cases to identify coronavirus patients, but they might have ignored diarrhea, a less apparent potential source of the spread, Bloomberg News reported Saturday. (…)
(…) the reopening of Chinese markets was ugly, but provided no new reason for people outside China to sell risk assets that they hadn’t already sold by the end of last week. For now, the two critical issues are whether the coronavirus continues to spread at a geometric rate for more than a matter of days, and the toll on the Chinese economy and manufacturing sector.
For the progression of the virus, this chart from Kambiz Kazemi of La Financiere Constance in Toronto offers a useful rule of thumb:
What matters is the speed of the spread, and we need to look at this on a log scale. Using the most recent data, there appear to be about 30% more cases each day than the day before. Assuming this continues, his projections are that there would be over 80,000 cases by the end of this week, and more than 130,000 suspected cases. If the outcome is below these numbers, that would be good news, even though it would mean that more people would be sick. (…)

Per Bloomberg as of 2:00AM ET today: 17,390 confirmed cases worldwide, 362 deaths worldwide.
How Long Can Chinese Property Developers Go Without Sales? A slowdown in sales will strain an increasingly important part of the funding model for real-estate giants
(…) Deposits and advance payments now make up the greatest portion of funding for real-estate developers. Almost all sales in China are made before construction is finished.
The inability to build or sell properties at a normal pace will eventually put a strain on this risky funding model. A 20% decline in advance payments to developers this year—an extreme scenario based on about 10 weeks of lost activity—would reduce the sector’s funding by about 1.2 trillion yuan ($173.04 billion), which represents 7% of the total payments received last year.
The risk for global investors is that developers aren’t able to meet their obligations in the offshore bond market, where companies raise U.S. dollars to finance activity. The good news is that there isn’t an immediate refinancing crunch. The biggest wave of debts comes due in the first half of 2021, when developers will need to refinance $45.1 billion. (…)
China Evergrande and Sunac have the largest offshore repayment schedules this year. (…)
As Almost Daily Grant has been warning for a while, Evergrande is a highly-speculative credit with over $118 billion in net borrowings ($53B maturing in 2020 per Bloomberg) and negative free cash flow for eight of the last nine years. Too big to fail? This virus could also spread…
Saudis Mull Large Oil Cuts in Response to Coronavirus Saudi Arabia is considering a drastic, short-term oil production cut as it seeks to respond to the impact of China’s deadly coronavirus on crude demand, according to OPEC officials.
(…) Under one scenario, Saudi Arabia, OPEC’s kingpin, would lead a collective reduction of 500,000 barrels a day that would stand until the crisis is over, cartel officials said.
Another option being considered would involve a temporary cut of 1 million barrels a day by the Saudis to jolt oil markets, the officials said. (…)
EARNINGS WATCH
From Refinitiv/IBES:
Through Jan. 31, 226 companies in the S&P 500 Index have reported earnings for Q4 2019. Of these companies, 69.5% reported earnings above analyst expectations and 20.4% reported earnings below analyst expectations. In a typical quarter (since 1994), 65% of companies beat estimates and 20% miss estimates. Over the past four quarters, 74% of companies beat the estimates and 19% missed estimates.
In aggregate, companies are reporting earnings that are 4.7% above estimates, which compares to a long-term (since 1994) average surprise factor of 3.3% and the average surprise factor over the prior four quarters of 4.9%.
Of these companies, 64.0% reported revenue above analyst expectations and 36.0% reported revenue below analyst expectations. In a typical quarter (since 2002), 60% of companies beat estimates and 40% miss estimates. Over the past four quarters, 58% of companies beat the estimates and 42% missed estimates.
In aggregate, companies are reporting revenue that are 0.9% above estimates, which compares to a long-term (since 2002) average surprise factor of 1.5% and the average surprise factor over the prior four quarters of 1.0%.
The estimated earnings growth rate for the S&P 500 for 19Q4 is 1.1%. If the energy sector is excluded, the growth rate improves to 3.9%. The estimated revenue growth rate for the S&P 500 for 19Q4 is 4.7%. If the energy sector is excluded, the growth rate improves to 5.9%.
Remarkably, the 226 companies having reported so far aggregate a +4.6% earnings growth rate, much better than the +0.4% recorded by the 236 companies that had reported at the same time during Q3’19. This in spite of slower revenue growth: +3.3% vs +3.5%.
Positive earnings surprises are across the board, ex-Industrials, the latter sector still suffering from the trade war and expected to show a 9.7% drop in earnings in Q4. Industrials are 14% of S&P 500 companies, 9% of market cap and earnings.
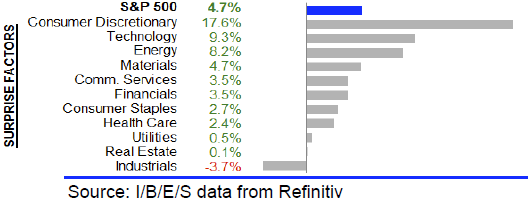
Total S&P 500 earnings are now seen UP 1.1% in Q4, +3.9% ex-Energy.
Analysts remain downward biased in their revisions:

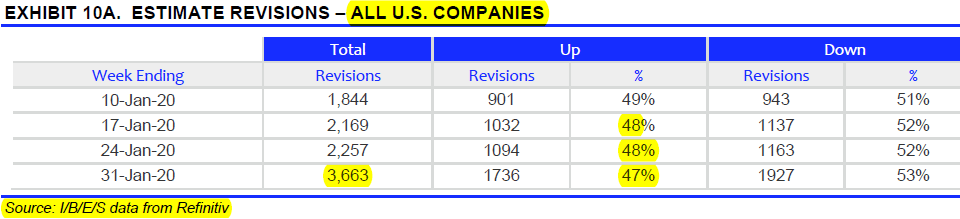
The estimated earnings growth rate for the S&P 500 for 20Q1 is 5.4% (+6.3% on Jan. 1). If the energy sector is excluded, the growth rate
declines to 4.8% (+5.5%).
Keep in mind that the coronavirus outbreak will likely hurt earnings in Q1 and Q2, not yet incorporated in estimates. This is also true for guidance: Factset tells us that
37 companies in the index have issued EPS guidance for Q1 2020. Of these 37 companies, 24
have issued negative EPS guidance and 13 have issued positive EPS guidance. The percentage of companies issuing negative EPS guidance is 65% (24 out of 37), which is below the 5-year average of 70%.
Unsurprisingly, net guidance is particularly negative among Industrials and Materials and analysts have substantially dialed down their expectations for these 2 sectors for Q1’20 but still see a marked rebound in Q2. Expectations for Energy have declined a little but will likely need further shavings given the recent drop in oil prices.

In Saturday’s WSJ:
Caterpillar Inc. said it expects demand for its machinery to fall this year, widening a performance gap between some manufacturers and an otherwise robust U.S. economy. (…)
Caterpillar, which sells machines in 193 countries, is viewed as a barometer for global industrial vigor. The company (…) said it expects revenue to decline this year as demand falls by between 4% and 9%. In North America, Caterpillar said it expects construction activity to decline and demand from oil-and-gas customers to remain weak.
Caterpillar joined a chorus of manufacturers saying they expect sluggish conditions to carry into 2020. Lingering trade tensions, Boeing Co.’s idled 737 MAX production lines and the coronavirus outbreak in China all threaten to extend a rough patch for U.S. factories.
“The industrial economy in the United States is very weak,” Stanley Black & Decker Inc. Chief Executive James Loree said in an interview last week.
He said suppliers and producers were experiencing an inventory mismatch that he expects to dissipate in time. The company has said it expects slowdowns in automobile production and domestic oil-and-gas drilling to continue in the first half of this year. (…)
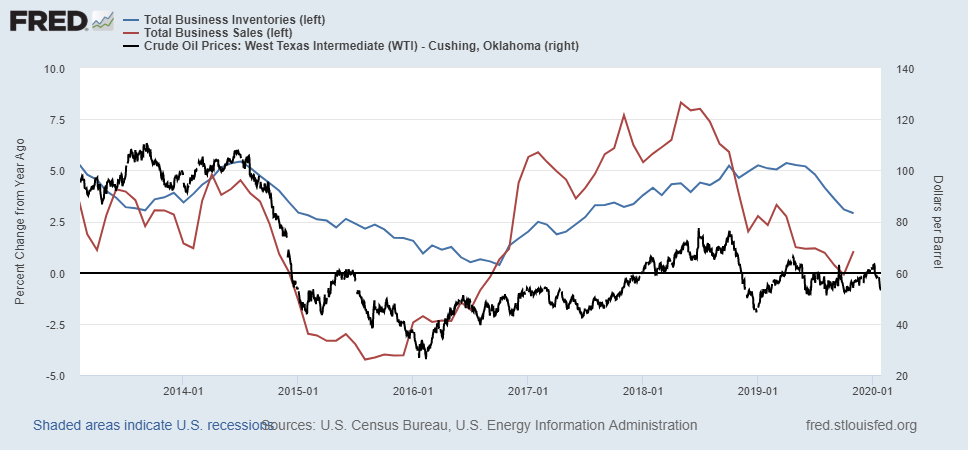
Business sales have been slowing much faster than inventories throughout 2019. The slowdown in sales is broad based this time around, contrary to 2015-16 which was mainly an oil industry problem.
In the same WSJ:
As the spread of the new coronavirus in China causes more factory shutdowns, the effect on global industrial supply chains could linger for years.
China now makes up more than twice the share of global merchandise exports it did in 2003, when the SARS virus hit. Guangdong province alone exported more in 2018 than China did as a whole 17 years ago. (…)
Global supply chains are considerably more complex than they were in 2003, shortly after China’s accession to the World Trade Organization. Even items with a marginal quantity of Chinese content will be affected as production is halted. (…)
Even mighty tech is impacted:
The world’s biggest tech companies are facing disruptions to their supply chains from prolonged factory closures and labor shortages in China, as the deadly coronavirus outbreak threatens the nation’s vast manufacturing network.
Electronics, telecom and semiconductor companies all rely on factories in China, honed to efficiency by years of servicing Western tech giants. Wuhan, the epicenter of the outbreak that is under lockdown by Chinese authorities, is home to numerous high-tech component suppliers and is a key transportation hub. (…)
“The impact on our supply chain looks inevitable,” said Mitsuaki Nishiyama, the chief financial officer of Hitachi Ltd., HTHIY -4.85% the Japanese maker of electronics, elevators and other products, which has factories across China. Hitachi is “concerned about the possibility that infections may become more widespread and that the supply chain may be affected,” he said, adding it was unclear whether production can be resumed immediately when the holidays are over.
Other electronics giants, including smartphone maker Apple Inc. AAPL -4.43% and contract manufacturer Foxconn Technology Group, 2317 0.12% are reliant on Chinese factories, and any disruptions could ripple across the global tech industry. Other companies with big factory footprints in China, such as global auto makers, are also preparing for supply issues. (…)
Many plant workers spent the Lunar New Year holidays traveling, including to Hubei province. Because of the lockdown in Wuhan and transportation disruption elsewhere, it’s unclear whether these workers can return on time, according to a supply-chain executive. Once they do come back, companies may impose quarantines before they can return to work. (…)
THE GOODS SECTOR’S EARNINGS RECESSION
If we split the S&P 500 Index between cyclicals (Cons. Disc., Energy, Industrials, Materials, 25% of the market cap. and 23% of 2019 earnings) and less-cyclicals, the divergence in Q4 earnings is striking: cyclicals’ earnings (non-tech goods producers) are forecast down 18.6%, in sharp contrast with the other 75% of the market which is now expected to post a 7.4% gain in earnings. In Q3’19, the spread was tighter: –8.3% vs +2.5%.
Narrowing down, Financials (+$7B) and Technology (+$5B) account for 65% of the YoY swing in less-cyclicals’ earnings while Energy (-$11B) is responsible for 64% of the cyclicals’ hit. Interestingly, since the start of the year, the Tech sub-index is up 4% while Financials and Health Care are both down 2.7% while the S&P 500 is unchanged (equal-weighted –1.9%). On the cyclicals’ side, Energy is down 11%, Materials –6.2% and Industrials –0.4%. Consumer Discretionary is flat but AMZN is up 8.7%.
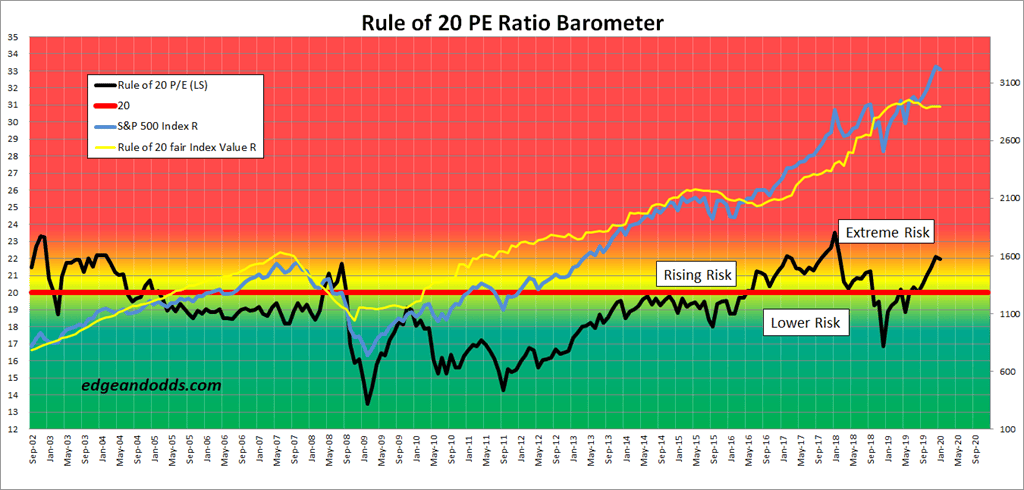
As it stands now, trailing EPS are $163.69, down slightly from $163.78 at the end of December and from their recent high of $164.43 in August. Time will tell but there seems to be a good chance that trailing EPS could turn up in February, potentially providing a much needed earnings tailwind to this still overvalued market. Per the Rule of 20, Fair Value (yellow line below) is now 2895.
Nonetheless, investors will be in the dark on Q1 and Q2 earnings until companies can better assess, and disclose, the impact of the virus on their sales and costs.
The chart below covers the 2003 SARS episode (which actually began in November 2002 but became public in early February 2003). At the peak of the fear, the R20 P/E troughed at 18.7 on March 12, down from 23.3 reached on Dec. 2.. Note the rising R20 Fair Value (yellow line) at that time, unlike today.
TECHNICALS WATCH
Lowry’s Research says that “while evidence of the durability of the market’s long-term uptrend remains apparent, awaiting signs of strong renewed Demand is likely the best short-term course of action before aggressively committing new funds.”
What’s needed from Lowry’s viewpoint is, first, exhausted sellers, potentially creating oversold conditions, followed by “evidence of robust demand”.
More fundamentally, we need positive news to reduce fear and more appealing overall valuations to attract demand.
The S&P 500 Index is sitting on its 50-day m.a., 3.5% above its 100d m.a. and 6.5% above its 200d m.a., all still in a strong uptrend. The S&P 600 Index, down 6.2% since Jan 17, is sitting on its 100d m.a. and 1.9% above its 200 d m.a.. Nasdaq stocks are down 3.0% from their Jan. 21 high.


Coronavirus and the Panic Epidemic The Chinese government is going all-out because it knows the people don’t entirely trust it.
Ian Johnson, who lives in Beijing, wrote an op-ed in the NYT last week:
(…) Instead of having an adult conversation with the population about the virus and putting in place reasonable policies that have been used effectively elsewhere, the Chinese state has gone into full lockdown mode. This demonstrates one of those truisms from political science: Authoritarian governments are like people who don’t have any fingers but do possess two thumbs. They can take forceful actions but can’t fine-tune the levers of government. (…)
But when faced with a crisis, the party can’t seem to avoid grand gestures: building hospitals from scratch in two weeks, locking down tens of millions of people, banning millions more from traveling to big cities and so on. In some ways, a moment like this one is a technocrat’s dream: When Western health care experts say that this sort of lockdown won’t work, they basically mean it’s never been tried on this scale with this kind of uberefficient government.
Now that it’s being tried, not just in Beijing but also across the country, the effects are kind of thrilling to watch. Apartment compounds like mine are being fumigated. (With what? Who cares!) People are walking around with loudspeakers blaring out warnings against the virus. Villages are closing their gates as if bandits were on the prowl. And going to a restaurant or a bar is almost an act of treason or, at best, foolish selfishness.
The most interesting question is why the party feels the need to carry on like this. I think it knows the people don’t trust it in these cases and assume there has been a cover-up. (…)
This has been reinforced over the past few days by reports that at least eight people who were detained in Wuhan in early January on charges of spreading rumors are in fact medical doctors, not fear-mongering ne’er-do-wells. This startling fact is now leaking out in online reports that are sometimes, but not always, being blocked. At some point, the government will have to admit to a partial cover-up. (…)
Does this mean that the state will suffer? I don’t think so. For despite their mistrust of the system, people over all are going along with the lockdown. In private conversations and on chat rooms, they say it’s impossible not to take drastic action in a country as big as China.
In this sense, the population has absorbed the government’s narrative of Chinese exceptionalism: Running China requires a strong hand, and these measures, as absurd as they seem, are proof that the government is doing a good job — and portend that the party will come out of this, as always, triumphant.
 Drone patrols!! Many village and cities in China are using drones equipped with speakers to patrol during the #coronavirus outbreak.