Yesterday was Groundhog Day:
- Punxsutawney Phil: Six more weeks of winter
- Shubenacadie Sam: Six more weeks of winter
- Fred la marmotte: Six more weeks of winter
- Manitoba Merv: Six more weeks of winter
- Balzac Billy: Six more weeks of winter
- Lucy the Lobster: Six more weeks of winter
Of course, there is always the outlier:
- Wiarton Willie: Early spring
Also an outlier:
- Markit: Six more months of winter:
MANUFACTURING WINTER
The IHS Markit manufacturing PMI for January showed output growth deteriorating markedly. The sub-index covering production fell to 50.5 from 53.8 in December, its lowest since the recovery form the first COVID-19 lockdowns began in July 2020. The news was followed by the ISM survey’s output gauge also falling, down to its lowest since June 2020. However, at 57.8 compared to 59.4 in December, the ISM index is still indicative of production rising at a substantial rate whereas the IHS Markit index is signalling almost no growth. For both surveys, any index reading above 50 means more companies reported higher output during the month than reported lower output.
While the signals form the surveys in terms of the direction of travel is clearly downwards, the extent of the slowdown and overall health of the goods producing sector being indicated is clearly very different.
To get an idea of why the ISM index is higher than the IHS Markit index we only have to look back at the survey history.
The ISM and IHS Markit gauges moved in similar cycles of similar magnitudes between 2007 and 2015, both serving equally well as accurate lead indicators of changes in the official data (charted here using the three-month-on-three-month rate of growth in the manufacturing component of industrial production, as this better captures the underlying trend in the official data than monthly percentage changes. To illustrate further, the ISM index averaged 54.5 between mid-2007 and the end of 2016 compared to an average IHS Markit reading of 53.2. These averages occurred over a period in which the average quarterly rate of growth of manufacturing output was -0.2% (and the average month-on-month change was +0.05%). Thus, both surveys therefore tend to have overstated performance to some degree over this period, averaging above 50 when output trended very slightly lower, though the ISM more so than the IHS Markit index.
Since 2016, however, the divergence has widened. The ISM output index has averaged 57.5 over the past six years while the IHS Markit index has averaged just 53.4. Yet over this period the average quarterly rate of change of manufacturing output has been just +0.1% (and the average month-on-month change was also +0.1%). The ISM index has therefore notably overstated growth relative to the official data to an increasing degree in recent years, contrasting with a more stable (and therefore more predictable) relationship of the IHS Markit data with the official growth rate.
These updated findings corroborate existing work from the legacy Macroeconomic Advisors team, which also found a statistical break between the ISM data and official industrial production numbers in 2017, with no such break evident in the IHS Markit numbers.
We remain uncertain as to what has caused the ISM survey to overstate official data, but it is clear that some allowance should be made by analysts when interpreting these survey data.

Most analysts tend to follow the ISM in the U.S.. They are likely to be surprised in coming months if Markit again proves more accurate, potentially meaning negative output growth in the first half of 2022. Monday’s release revealed “muted client demand”, and a “reluctance among some clients to place orders”, taking new order growth to a 16-month low.
This is not only a U.S. phenomenon as “the number of companies reporting that backlogs of work rose in January due to rising demand pressures was the lowest recorded for just over one and a half years.”

That would be unfortunate timing given that “January saw rising energy prices driving manufacturing prices higher to an extent not seen since 2008, alongside an unprecedented upward pressure from staff costs.”

Trying to protect profit margins, “globally, the rate of selling price inflation accelerated to the fourth highest in over a decade of survey history, exceeded only by prior pandemic highs to suggest that upward pressure on consumer prices inflation looks likely to remain historically elevated in coming months.”

Meanwhile, in China,
New orders likewise fell back into decline amid the January Omicron restrictions, fueled by the largest drop in export orders recorded by the survey for 20 months. Ominously, the January survey also showed that the drop in new orders caused backlogs of uncompleted work to fall at a rate not exceeded since the height of the global financial crisis in 2008-9. This depletion of manufacturing order books hints at the build-up of excess capacity relative to demand, and in turn caused increasing numbers of firms to scale back workforce headcounts. The resulting decline in factory employment was the largest recorded since the early stages of the pandemic in April 2020.
(…) it is the impact of reduced production in China which will be of concern for policymakers in other countries, with restricted trade likely to add to supply chain woes, and will add weight to suggestions that the inflationary pressures of the supply crunch could persist well into 2022.
OPEC, Allies Agree to Pump More Oil Amid Supply Concerns The producers agreed to a small, planned increase in output amid soaring oil prices, with concerns over supply heightened due to a possible Russian invasion of Ukraine.
The Organization of the Petroleum Exporting Countries and a coalition of Russia-led oil producers said they agreed to raise their collective production by another 400,000 barrels a day in March. The boost is in line with what the cartel, called OPEC+, agreed to last year as part of a plan to raise output to pre-pandemic levels. (…)
Some delegates said Russia is unlikely to approve any additional supplies as it benefits politically from higher oil prices, which could deter the U.S. from imposing sanctions that would hit Moscow’s energy sector. Saudi Arabia also fears such a move could jeopardize its alliance with Russia, a cornerstone of the OPEC+ grouping, they noted. (…)
An internal OPEC report that was prepared for a technical meeting on Tuesday pointed to a global supply surplus of 1.4 million barrels a day in the first quarter, rising to 1.7 million barrels a day in the second if the group continued to add 400,000 barrels a day and crude consumption rises as planned. But OPEC+ in December pumped 824,000 barrels a day below its publicly stated targets, according to the report.
Several members, including top African producers Nigeria and Angola, are struggling to add back their share of the group’s pre-pandemic output following years of underinvestment, the OPEC report shows. Even Russia in December pumped below its OPEC+ quota for the first time since the group cut output, due to slower-than-expected development of some fields, according to the cartel’s data. (…)
 In reality, much higher oil prices is in nobody’s interest at the moment.
Deutsche Bank shows that, “of the 20 US economic cycles since 1914, this is the strongest recovery in commodity prices on record at this stage: it eclipses the two 1970s cycles largely due to the spikes back then occurring beyond year three of the 1970- and 1975- expansions (and also has a broader commodity composition beyond energy). In other words, this is not your grandparents’ 1970s inflation shock: it is way worse (for now).” (via ZeroHedge)


One commonality that defines commodity markets at this juncture is that deficits have exceeded expectations and led to a sharp drawdown in inventories well below pre-Covid levels. (…) As physical assets, commodity returns depend on activity levels being above supply levels, and not rates of economic growth. (…) Supply uncertainty remains high, from Iran to Russia’s oil production shortfalls to the impact of the European energy crunch on distillates and base metals markets to la Nina risks on Brazilian soybeans. Commodity forward curves are currently either steeply backwardated or less contango-ed than normal, underscoring the bullish environment commodities find themselves in relative to history. (Goldman Sachs)
- World Food Prices Are Climbing Closer Toward a Record High The United Nations’ index of prices rose 1.1% in January, pushed up by more expensive vegetable oils and dairy. The gauge is edging closer to 2011’s all-time high, and unfavorable weather for crops and the fallout from an energy crisis threaten to keep prices high going forward. (…)

Bulk Shipping Rates Extend Slide on Weak Demand From China
(…) Shipping rates for every type of vessel from oil tankers to container vessels have fallen since October, easing inflationary pressure even as commodity prices climb. Still, freight rates remain well above normal, with the price to ship a container from China to the U.S. roughly six times higher than the five-year average. (…)

More supply issues…
Is ‘long Covid’ worsening the labor shortage?
Millions of COVID-19 patients have developed a range of debilitating symptoms that last for months or even years. They are being diagnosed with “post-acute sequelae of COVID-19”—or more colloquially, long Covid. Yet we know little about these people—how many there are, why they stay sick, or what the impact is on their lives. Among these knowledge gaps is the fact that public health and economics experts have almost no understanding of long Covid’s economic burden.
This piece explores data suggesting that long Covid is contributing to record high numbers of unfilled jobs by keeping millions of people from getting back to work. (…)
The Centers for Disease Control and Prevention estimates that through October 2021, just over 100 million Americans between the ages of 18 and 64 have contracted COVID-19. And studies suggest that between 27% and 33% of COVID-19 patients still experience symptoms months after infection. That means 31 million working-age Americans—more than one in seven—may have experienced, or be experiencing, lingering COVID-19 symptoms. (…)
In the U.K., which is doing a much better job collecting data than the U.S., more than 70% of people with persistent COVID-19 symptoms have been sick for more than three months, and more than one-third have been sick for at least a year. This chronicity is consistent with other post-viral illnesses, which behave similarly to long Covid and often last for years. (…)
Two studies of long Covid patients found that 23% and 28%, respectively, were out of work due to long Covid at the time of the study. That suggests there may have been about 1.1 million Americans not working due to long Covid at any given time.
Additionally, some long Covid patients reduced hours rather than taking time off: 46% according to a study in The Lancet. That is another 2.1 million workers. If those workers reduced their hours by only a quarter, that would increase the labor market impact to 1.6 million full-time equivalent workers. In other words, under reasonable assumptions given the data available, long Covid could account for 15% of the nation’s 10.6 million unfilled jobs. (…)
Axios: “Studies estimate long COVID hits anywhere from 5% to 60% of COVID patients. Many of the patients we’re seeing are in the 40-year-old range. They’re people who are still working … then they got COVID,” Monica Verduzco-Gutierrez, director of the COVID Recovery Clinic at University Health in Texas.”
…coupled with demand headwinds:
Financial Progress Still Eluding Americans Americans’ belief that they are making financial progress has yet to recover after falling last year, with 41% saying they are better off than a year ago.
Forty-one percent of U.S. adults now say they are better off financially than a year ago. That is up slightly from 35% in January 2021 but still well below the record-high 59% reporting they were better off in January 2020, right before the start of the coronavirus pandemic.
An identical 41% of adults now say they are financially worse off than a year ago, also up from 36% in 2021. Meanwhile, the percentage volunteering that their financial situation is the same has dropped 10 percentage points to 18%.
The result of these changes is that “net” financial progress — that is, the percentage better off minus the percentage worse off — has held at or near zero for each of the past two years, compared with net-positive financial progress from 2015 to 2020. (…)
Lower-income Americans’ assessments of their personal financial situation have changed the most over the past three years.
- After plunging from 45% in 2020 to 23% in 2021, the percentage of adults in households earning less than $40,000 annually saying they are better off financially than a year ago has bounced back to 47%.
- Fewer lower-income Americans now (41%) than a year ago (56%) think their finances are worse today. However, more lower-income Americans say they are worse off than did so in 2020 (34%).
By contrast, middle- and upper-income adults’ positive perceptions of the recent trend in their finances are flat, with 33% and 48%, respectively, saying they are better off. But the percentages of these groups saying their finances are worse have jumped substantially.
Lower-income Americans are also the most optimistic about their household income over the next year, with 71% expecting to be better off, similar to their outlook each of the past two years. At the same time, optimism has waned among middle- and upper-income Americans, and now about six in 10 in each group are optimistic. (…)


 So, what about the $2.6T in excess savings? Where ever they are, they are not being used just yet:

HIKES
- A hawkish Bank of England raises rates and there’s surely more to come The fact that four out of nine Bank of England rate-setters voted for a 50bp rate rise at the February meeting shows that policymakers are keen to act pre-emptively amid high headline inflation rates. We now expect further rate rises in March and May
- Brazil Central Bank Raises Benchmark Lending Rate to 10.75% Brazil’s central bank raised its benchmark interest rate by 1.5 percentage points as expected, and signaled a smaller rate increase at its next meeting.
Housing Market in a ‘Speculative Fever,’ Canada Regulator Says Property prices in Canada are set to fall as rising interest rates bring an end to a “speculative fever” in the housing market, the country’s banking regulator said on a podcast. “In some markets, where you had really rapid increases in prices, you could see a fall of 10%, 20%,” Routledge said.
EARNINGS WATCH
As of Tuesday, we had 214 reports in, a 77% beat rate and a +4.6% surprise factor. These numbers will likely change when yesterday’s reports are accounted for.
As you may know
PayPal tumbled 25%, its worst one-day performance on record, after it posted lower earnings and higher expenses and scrapped an ambitious growth strategy. Investors also punished Meta Platforms and Spotify, which reported their latest quarter results after the markets closed. Meta shares dropped 20% after it posted rising revenue but a sharper-than-expected decline in profits as it ramped up spending to execute the pivot to the metaverse. Spotify, already embroiled in controversy, lost 12% post-market after it wouldn’t provide annual guidance, despite adding more users and reporting a surge in advertising revenue for the quarter that ended Dec. 31.
 Importantly, Refinitiv released its first tally of Q1’22 pre-announcements. The negative/positive ratio doubled from Q4’21 at the same time. Interestingly, only 24 companies have formally pre-announced so far, down from 37 at the same time last quarter.
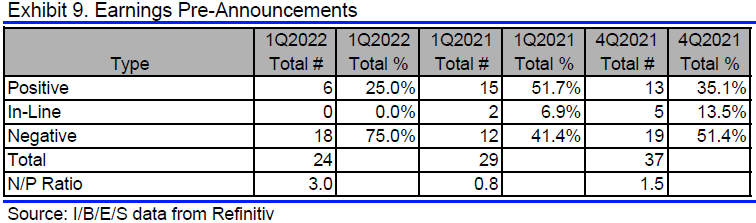
As reported Monday, Goldman Sachs’ own tally is that “of the 44 companies that provided formal FY1 EPS guidance, 23 (52%) have guided above consensus and 21 (48%) have guided below.” I suspect GS includes all companies its analysts follow while Refinitiv only cares of S&P 500 companies. That would mean that of the 20 non-S&P 500 companies having guided, 17 were positive and 3 were negative.
SENTIMENT WATCH
Evercore’s Ross Has Bought ‘Every Dip’ for Two Years But Not Now The S&P 500 is no longer oversold, commodities are rising as the dollar strengthens, credit spreads — the extra yield over Treasuries investors demand to lend to a company — are breaking higher and action in stocks like Alphabet Inc. is worrisome, said Rich Ross, a technical analyst at Evercore. He has a “high conviction” that this is consistent with a level of 3,800 on the S&P 500 — about 17% below current levels.
EXCESS SAVINGS
Here’s where some excess savings are being used:
Jeff Bezos’s New Superyacht to Force Dismantling of Dutch Bridge
Jeff Bezos’s massive new superyacht is nearing completion, but getting it to its owner will require taking out a bridge.
The 417-foot-long sailing yacht, code-named Y721, is being built by Alblasserdam, Netherlands-based Oceanco. For the boat to reach the ocean, it will have to pass through Rotterdam, and navigate a landmark steel bridge known as De Hef. A lift bridge, De Hef’s central span can be raised more than 130 feet into the air, but that’s still not high enough to accommodate the yacht’s three giant masts. (…)
Rotterdam council project leader Marcel Walravens defended the city’s decision to allow the bridge to be dismantled, telling local broadcaster Rijnmond it was the “only alternative” to complete what the municipality considers “a very important project” economically. (…)
The enormity of the yacht’s sails will make it unsafe to land a helicopter onboard, so Bezos has commissioned a support yacht equipped with a helipad to trail alongside.
Surging levels of personal wealth pushed superyacht sales to record levels last year. A total of 887 such ships were sold in 2021, a 77% jump from a year earlier and more than double the number in 2019, according to a report from maritime data firm VesselsValue. Boat builder Burgess reported more than 2 billion euros ($2.3 billion) in superyacht sales last year.
The new definition of helicopter money!