U.S. Personal Spending Picks Up as Savings Rate Tumbles
Personal consumption expenditures surged 0.9% (4.4% y/y) following a 0.1% February uptick and a 0.3% January rise, revised from 0.1%. (…) A 1.7% surge (2.9% y/y) in spending on goods was driven by a 2.3% gain (1.7% y/y) in durable goods outlays. Spending on motor vehicle & parts jumped 4.8% (-1.2% y/y) following three straight months of sharp decline. Spending on home furnishings & appliances increased 1.1% (3.0% y/y) and recreational goods & vehicle outlays jumped 1.0% (4.3% y/y). (…)
Outlays on services strengthened 0.5% (5.1% y/y), the most since October. Recreation services spending jumped 1.5% (3.0% y/y) following declines in three of the prior four months. Housing & utilities outlays rose 0.7% (4.7% y/y) for a second consecutive month while health care spending rose 0.5% (4.4% y/y), the same as in the prior month.
This strength in spending came at the expense of the personal savings rate which fell to 6.5% from 7.3%. It was down from December’s high of 7.7% and the lowest rate since November. The level of personal savings fell 6.2% y/y.
Personal income edged 0.1% higher last month after a 0.2% rise. The 3.8% y/y gain was the weakest since January 2017. (…) Wages & salaries increased a firm 0.4% but y/y growth of 4.2% was below the 5.1% high in August 2017. (…)
The chain price index rose 0.2% (1.5% y/y) after edging 0.1% higher in February. The price index excluding food & energy held steady (1.6% y/y) following two months of 0.1% gain. (…)
In constant dollars, personal spending increased 0.7% (2.9% y/y) and personal disposable income declined 0.2% (+2.3% y/y).


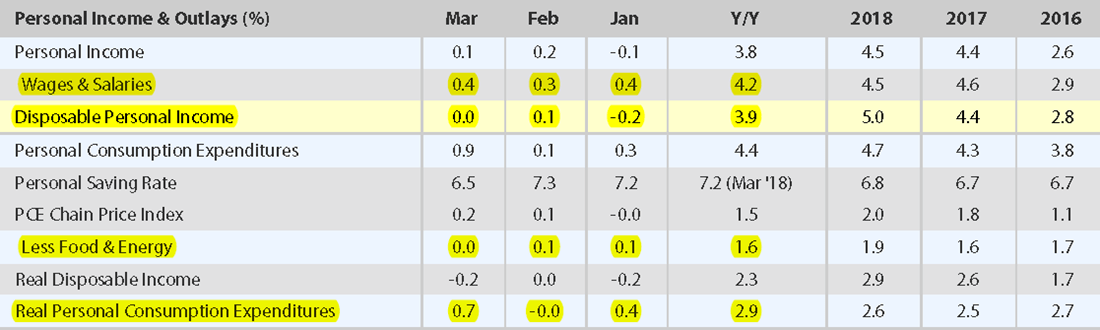
In Q1:
- Wages and Salaries: +4.5% annualized.
- Cons. expenditures: +5.2%
- Disposable Income: -0.4%
- Core PCE deflator: +0.8%
- Real expenditures: +4.5%
The BEA is still struggling to catch up after the shutdown. Its income data seem vey incomplete, particularly income from assets (rent, interest, dividends). I take comfort from the labor income and expenditures data which both suggest a fairly strong consumer. (Full BEA release)
-
Median Household Income Lower for March
New data from the monthly Current Population Survey (CPS) indicate that median annual household income was $63,425 for March 2019. The March 2019 median was 1.5 percent higher than that for March 2018 but $635 lower (about 1-percent) than in January 2019. Median household income for March 2019 was 4.8 percent higher than the median of $60,534 for December 2007, the official start of the Great Recession and 14.6 percent above the post-recession low point of $55,360 in June 2011. Despite numerous monthly increases following the June 2011 post-recession low for median income, the March 2019 median was just 3.5 percent above the January 2000 level of $61,254 (first year in this monthly series) after adjusting for changes in prices.

China manufacturing production rises slightly in April
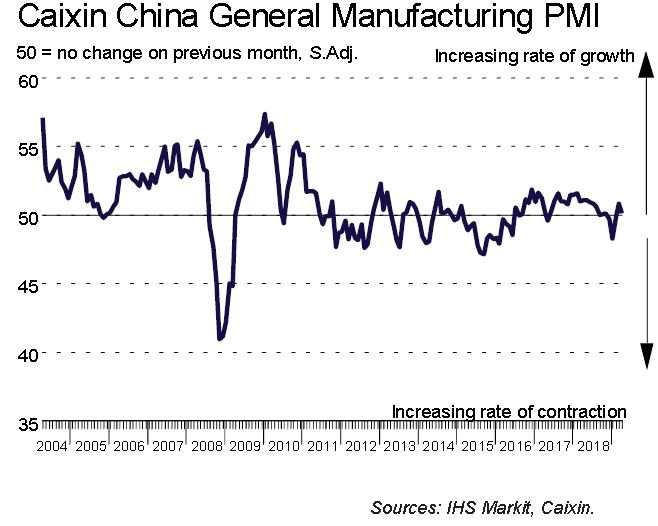
Latest PMI data showed that the overall health of China’s manufacturing sector improved for the second month running in April, albeit at a softer pace. Output and total new work both rose slightly, though companies reported a marginal fall in new work from overseas. Buying activity meanwhile stabilised, but relatively subdued demand conditions led firms to remain reluctant to expand their inventories in April. Prices data indicated that overall inflationary pressures softened at the start of the second quarter. Input costs and output charges both rose only marginally, with some linking lower selling prices to recent sales tax reforms. Encouragingly, business confidence regarding the one-year outlook for production improved to an 11-month high.
The headline seasonally adjusted Purchasing Managers’ Index™ (PMI™) posted down from 50.8 in March to 50.2 in April, to signal the second successive monthly improvement in business conditions. Although the rate of improvement was only slight, it nonetheless contrasted with the subdued trend seen at the turn of the year.
Latest data showed that manufacturing output in China rose again in April. Though marginal, the upturn extended the current expansionary sequence to three months. New orders followed a similar trend, and rose at a softer pace than seen in March. Data indicated that subdued sales largely stemmed from weaker foreign demand, as new export business fell for the second time in the past three months.
Companies signalled limited pressure on operating capacities at the start of the second quarter, as highlighted by the slowest increase in backlogs of work for three years. At the same time, efforts to contain costs and the non-replacement of voluntary leavers led to a slight fall in manufacturing workforce numbers.
Buying activity broadly stabilised following a three-month sequence of reduction. As a result, stocks of purchases were also broadly unchanged compared to the previous month. However, muted overall demand conditions meant manufacturing firms remained cautious regarding their inventories of finished items, which fell for the fourth month running.
Latest data showed an easing of pressure on supply chains across China’s manufacturing sector, as delivery times for inputs increased only marginally. Average purchasing costs rose again in April, though the rate of inflation was only slight. Factory gate prices also increased at a weaker pace, with some firms citing that charges were impacted by recent sales tax reforms.
On a positive note, business confidence strengthened to its highest for nearly a year in April. Positive forecasts were often linked by companies to new product launches, planned company expansions and expectations that global demand conditions will improve.
-
China Manufacturing Activity Falters The official manufacturing PMI fell to 50.1 in April from 50.5 in March
(…) The overall new orders subindex of the official gauge edged down to 51.4 from 51.6. A subindex for production fell to 52.1 from 52.7 in March. The new export subindex—an indicator of external demand for Chinese goods—rose to 49.2 from 47.1. (…)
-
Gradual slowdown in China’s economy continues
China’s economy resumed in March, with growth nudging down to 5.1% after several months of more stable readings. Its weakest rate since late 2016, the measure is now some way below the 6.4% official estimate of annual GDP growth, which defied market expectations of a further slowdown in the first quarter. The CMI not only points to weaker economic growth but also to changes in the composition of that growth, a consequence of China’s stop-start approach to reform. For now, it continues to suggest that China is prioritising growth over reform, with the bulk of ‘old-model’ sub-components included within CMI 2.0 firming in March. This strategy has seen China loosen several key rates harder and faster than at any point in recent history, and has helped to avert a repeat of 2014-15. Beijing is caught between a rock and a hard place as both the old and new growth strategies are fraught with difficulties: the former is producing less bang for its buck, while the latter is associated with a painful economic adjustment. (Fathom Consulting)

Mnuchin hopes for ‘substantial progress’ in China trade talks U.S. Treasury Secretary Steven Mnuchin said on Tuesday that he hopes to make “substantial progress” with Chinese negotiators in the next two rounds of trade talks, as the world’s two largest economies look for ways to end their bruising trade war.
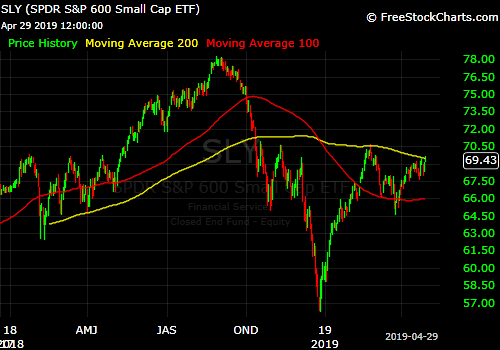
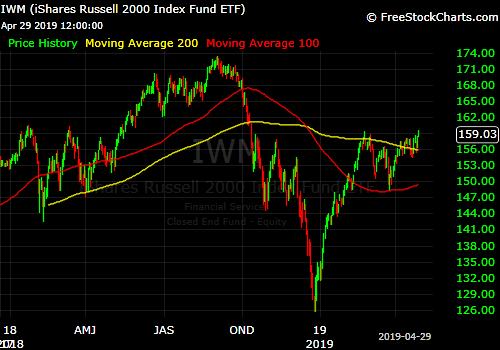
Left Behind in the Rally, Small-Caps Stand to Benefit From Surging Dollar A resurgence in the dollar potentially bodes well for one group that has struggled to reclaim record territory after last year’s rout: small-cap stocks.
(…) Small-caps, which typically have a market value of about $2 billion or less, are at an important juncture. The Russell 2000, which has climbed 19% this year, rebounded in early 2019 but has struggled to stay above 1600, a key resistance level. How small-cap stocks perform in the near term could be a telling sign for the trajectory of the broader market this year, some analysts said. (…)
The Russell 2000 trades at 35.6 times projected earnings over the next 12 months, higher than its 10-year average of 29.7, according to FactSet. The S&P 500, meanwhile, is trading at 19.2 times projected earnings, up from its 10-year average of 17.6. (…)
Interested by small caps? Perhaps you should read IN GODS WE TRUST before you splurge.
WeWork Files for Initial Public Offering
(…) WeWork, which rebranded as the We Company early this year, said it filed confidentially for an initial public offering in December, not long before it was valued at $47 billion by Japanese technology investor SoftBank Group Corp. (…)
Do Ride-Sharing Customers Sit in Front? An accounting practice at Uber and Lyft that ought to raise eyebrows.
(…) The most significant accounting distortion in each company’s filing comes from its treatment of rider discounts and refunds. For nearly any business in any industry, discounts and other cash incentives to customers are treated as a reduction of sales, lowering the net sales figure reported to investors.
Uber and Lyft each provide substantial discounts and incentives to riders, which subsidize the cost of trips and encourage usage. But they don’t account for these amounts in their sales numbers. Instead they categorize them as marketing expenses. That inflates reported gross profits and distorts common analyses of the companies’ unit economics.
This distortion is possible because both companies inexplicably assert that their customers are not the passengers but the drivers, whom the companies classify for tax purposes as independent contractors. If the passenger isn’t their customer, the companies can bury these costs further down in the income statement, where investors and analysts give them less significance.
The impact is material. In 2018 Lyft included $338.4 million of rider incentives and refunds in “marketing expenses.” Had it been treated as ordinary sales discounts, reported revenue would have been some 16% lower than the $2.16 billion disclosed. The same year Uber reported that $1.4 billion in “sales and marketing” was for consumer discounts, promotions and refunds. If treated as ordinary sales discounts, sales would have been 12% lower than the $11.27 billion reported. For both companies, reclassifying this spending as part of operating expenses inflates sales and sales growth. (…)
Mr. Schilit is CEO of Schilit Forensics and a co-author of “Financial Shenanigans.”
FYI:
 Vodafone Found Hidden Backdoors in Huawei Equipment While the carrier says the issues found in 2011 and 2012 were resolved at the time, the revelation may further damage the reputation of a Chinese powerhouse.
(…) Europe’s biggest phone company identified hidden backdoors in the software that could have given Huawei unauthorized access to the carrier’s fixed-line network in Italy, a system that provides internet service to millions of homes and businesses, according to Vodafone’s security briefing documents from 2009 and 2011 seen by Bloomberg, as well as people involved in the situation.
Vodafone asked Huawei to remove backdoors in home internet routers in 2011 and received assurances from the supplier that the issues were fixed, but further testing revealed that the security vulnerabilities remained, the documents show. Vodafone also identified backdoors in parts of its fixed-access network known as optical service nodes, which are responsible for transporting internet traffic over optical fibers, and other parts called broadband network gateways, which handle subscriber authentication and access to the internet, the people said.
Vodafone asked Huawei to remove backdoors in home internet routers in 2011 and received assurances from the supplier that the issues were fixed, but further testing revealed that the security vulnerabilities remained, the documents show. Vodafone also identified backdoors in parts of its fixed-access network known as optical service nodes, which are responsible for transporting internet traffic over optical fibers, and other parts called broadband network gateways, which handle subscriber authentication and access to the internet, the people said. (…)