U.S., China Close In on Trade Deal China and the U.S. are close to completing a trade deal, though hurdles remain. Both countries could lift some tariffs imposed last year, and Beijing would agree to ease restrictions on American products.
(…) Despite the remaining hurdles, the talks have progressed to the extent that a formal agreement could be reached at a summit between President Trump and Chinese President Xi Jinping, probably around March 27, after Mr. Xi finishes a trip to Italy and France, individuals with knowledge of the plans said.
As part of a deal, China is pledging to help level the playing field, including speeding up the timetable for removing foreign-ownership limitations on car ventures and reducing tariffs on imported vehicles to below the current auto tariff of 15%.
Beijing would also step up purchases of U.S. goods—a tactic designed to appeal to President Trump, who campaigned on closing the bilateral trade deficit with China. (…)
There has been less progress on other issues dividing the two nations, especially China’s industrial policies and subsidies. Beijing considers that support crucial to its state-led development plan and maintaining the Communist Party’s rule. (…)
The U.S. and China are close to a trade deal that could lift most or all U.S. tariffs as long as Beijing follows through on pledges ranging from better protecting intellectual-property rights to buying a significant amount of American products, two people familiar with the discussions said. (…)
One of the remaining sticking points is whether the tariffs would be lifted immediately or over a period of time to allow the U.S. to monitor whether China is meeting its obligations, the people said. (…)
U.S. RETAIL SALES
The important debate on the hugely weak December retail sales continues. Bearish David Rosenberg highlights the most recent SpendTrend retail sales figures for February showing a weak 0.9% YoY growth rate. SpendTrend data is based on aggregate card-based same-store sales activity across First Data’s network of more than 1.3 million U.S. merchants. But SpendTrend data were up 6.2% YoY between October 28 and January 1, the best showing in four years, totally different from the official retail sales data.
We will get earnings reports from many retailers this week, hopefully with some sense of the current state of the consumer.
Consumer expenditures are nearly 70% of the economy. Housing is not particularly strong these days, nor are exports. And now, manufacturing seems to be entering a soft patch per these Markit charts:


Demographics: Renting vs. Owning
This is from CalculatedRisk’s Bill McBride:
(…) The move “from owning to renting” is over, and demographics for apartments are much less favorable than 8 years ago. Also much more supply has come online. Slowing demand and more supply for apartments is why multi-family starts have slowed recently (multi-family starts probably peaked in 2015).
On demographics, a large cohort had been moving into the 20 to 29 year old age group (a key age group for renters). Going forward, a large cohort is moving into the 30 to 39 age group (a key for ownership). (…)

Russia Cuts February Output Deeper to Comply With OPEC Pact
The country produced 43.3 million tons of oil last month, according to preliminary data from the Energy Ministry’s CDU-TEK unit. That’s equivalent to 11.336 million barrels a day, down 82,000 barrels per day from the October baseline of the OPEC+ deal, Bloomberg calculations show.
Russia’s Energy Ministry earlier this week said February output was 97,000 barrels a day lower than in October. Bloomberg’s calculation of the country’s cuts also differed from official figures in January. The difference may be explained by the methodology, as the ministry uses an individual conversion ratio from tons to barrels for each field, while Bloomberg uses a unified ratio of 7.33 barrels a ton.
The nation curtailed its January supply by about 47,000 barrels a day from the baseline, according to the Energy Ministry. Russia pledged to gradually implement a 228,000 barrel-a-day reduction and maintain it until the end of the first half. (…)
 Source: @markets; Read full article

TECHNICALS WATCH
The Dow Just Had Its Best Two Months in Years — and There Could Be More to Come
(…) “Although the rate of change in high-frequency indicators makes an unequivocal case for a slowdown, the level of said indicators refutes the idea of a hard landing, at least so far,” he writes. “The level of the ISM New Orders Index remains consistent with ongoing growth in earnings estimates and capital spending.”
There are also signs that the Fed, simply by taking a breather, has eased monetary conditions. The evidence: The yield curve is steepening. The difference between 30-year and two-year Treasury yields—the spread most correlated to money supply—has risen to about 0.6 percentage point, the highest since June, Darda observes, while the market has started pricing in more inflation. “It is becoming clear that the Fed has actually ‘eased’ monetary policy to some degree given the FOMC’s forward-looking January ‘pivot,’ which should reduce hard landing risk,” he explains.
The market isn’t risk-free, however. Deltec’s Rogers, for one, sees continued weakness in economic data from China and Europe, trade hopes baked into stocks, and very little earnings support for the stock market in the U.S., where the S&P 500 trades at 16.4 times earnings. “We think from here there’s little upside, so we would not chase equities,” he says.
This pretty good chart from CMG Wealth also suggests there could be more to come:
13/34–Week EMA Trend Chart
CMG Wealth’s Steve Blumenthal also watches the 200-day moving average. A sell signal occurred recently when the 200-day MA price line dropped from its high point by 0.5%. But a buy signal will occur if the 200dma price line rises from its 2738.1 low point by 0.5% or more. This would be at 2751.8, 0.17% above its current level.

Meanwhile, the Nasdaq has effectively reversed its similar bearish signal when its 200dma exceeded 7061 on February 25. Ned Davis Research data says that, since 1973, the NDX has risen 74% of the time averaging 12.7% per annum when its 200dma was rising.
The S&P 500 is bumping against its recent 2800 recovery highs with many investors still hurt by the 16% cliff that followed the December 3 failure.

Lowry’s Research reminds us that its Demand vs Supply data was showing steady rising Supply and weakening Demand prior to December 2018. Selling Pressure has been declining since early January while “Buying Power rose to its highest point since late August of 2018. On an intermediate-term basis, the trends of contracting Supply and expanding Demand are consistent with a healthy market uptrend. In the short-term, the moderation of these trends suggests a near-term market consolidation is more likely.”
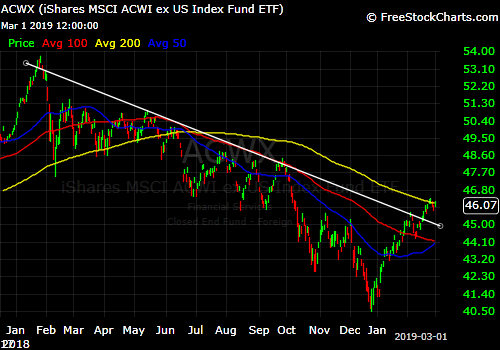
BTW, equity markets outside the U.S. have broken their one-year downtrend and are now bumping against their still declining 200dma.
EARNINGS WATCH
A consolidation phase is also likely for the Rule of 20 Fair Value as trailing earnings are expected to flatten during the next 6 months based on Q1 and Q2 estimates for 2019.
With trailing EPS of $162.86 and 2.2% inflation, the Rule of 20 Fair Value is 2899, 3.4% above the last close. If estimates per Refinitiv’s data are met, trailing EPS will not rise much until Q3 or Q4 of this year and only lower inflation would positively impact Fair Value (every 0.1% decline in the inflation rate would increase Fair value by 0.55%).
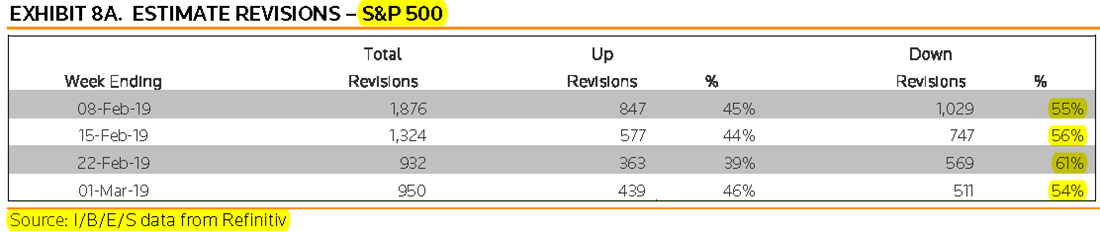
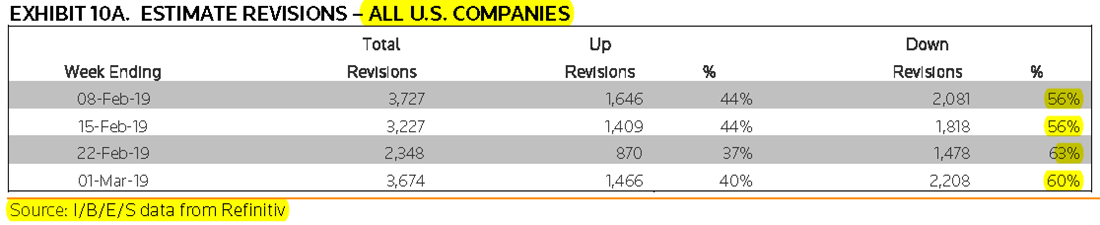
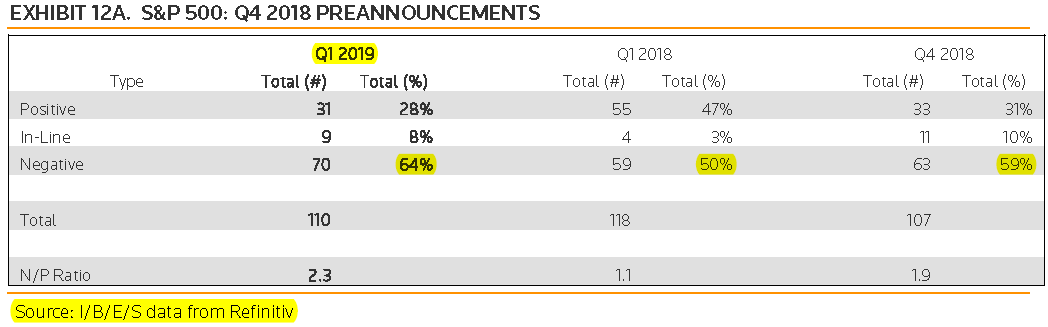
Analysts are relentlessly revising their estimates downward and corporate preannouncements are not helping reverse the trend.

Q1’19 earnings are seen down 1.1% (-0.4% ex-Energy). Q2 and Q3 estimates are +3.2% (+4.0%) and +2.9% (+4.3%) respectively while Q4 is still expected to show good growth at +9.3% (+10.7%) primarily because of an expected 20% rebound in Financials’ earnings as Financials’ trading revenues should (?) recover from the very weak Q4 just passed.
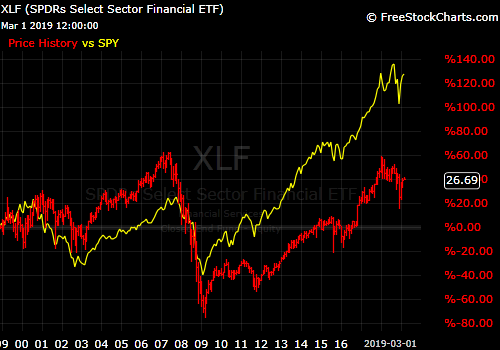
As Ed Yardeni illustrates, Financials are selling at low historical multiples and PEG ratios…

…having substantially lagged the S&P 500 Index during this cycle…
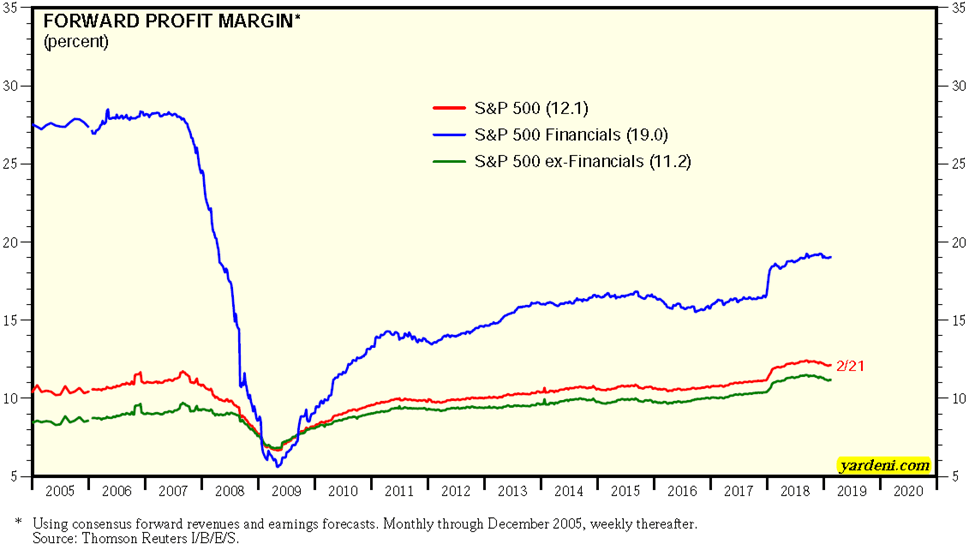
…because Financials’ earnings have substantially lagged due to their inability to bring margins back even near pre-crisis levels…
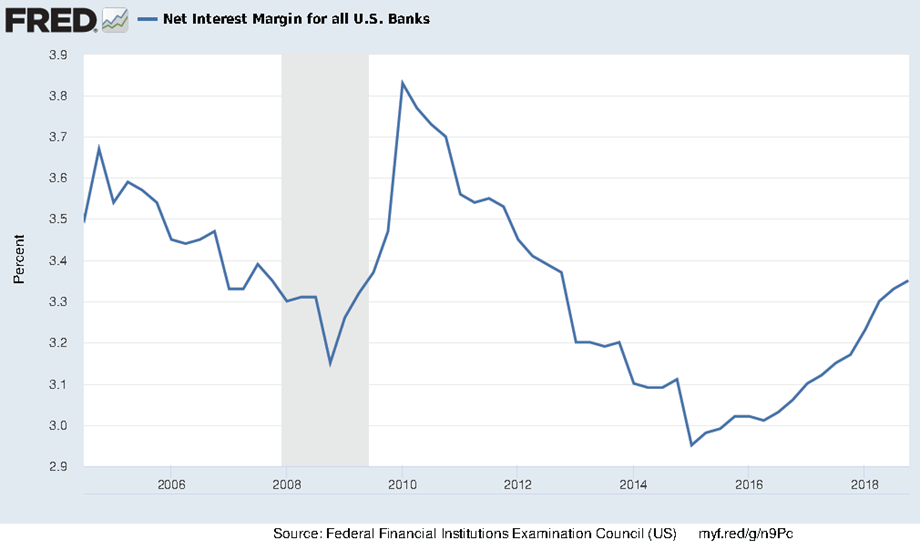
…in part because of compressed lending margins…
China’s Stock Market Isn’t Quite The Bargain It Seems
The broad Chinese market trades at just 14 times forecast earnings for the next 12 months, according to a FactSet index of more than 3,000 stocks. That is roughly 17% below its 10-year average of 16.8 times, despite a blistering rally in Chinese stocks over the first two months of this year.
On other gauges, the country looks even cheaper: The MSCI China A Onshore Index, which includes large- and mid-capitalization stocks in Shanghai and Shenzhen, had a price-to-earnings ratio of just 10 times at the end of January. (…)
However, headline figures tell only part of the story. The consumer non-durables segment of the FactSet index, which includes liquor maker Kweichow Moutai, trades at 20.9 times forward earnings, while technology-services companies trade at 29.4 times. These are some of the companies foreign investors most want to own as Chinese consumers become a bigger economic driver.
Meanwhile, financial firms trade at just 7.4 times forward earnings, making that segment the cheapest of FactSet’s China index. The country’s banks have large stacks of nonperforming loans. (…)
The banks matter because they make up big chunks of many indexes: They and other financial institutions account for 35% of the Shanghai Composite, and 31% of the MSCI China A Onshore Index.
Avoid the Crowds in Chinese Stocks (AllianceBernstein L.P.)
After MSCI decided [last week] to boost the allocation to Chinese onshore stocks in its emerging-market indices, global investors are likely to pump more money into the market. But watch out for crowds. Flows into China are concentrated in a small group of large-cap stocks. (…)
Our research suggests that foreign inflows through the Stock Connect channel are concentrated in a small number of Chinese stocks, mostly large caps ( Display ). In fact, only 117 Chinese A-shares have foreign ownership of more than 5%, while 1,480 stocks have foreign ownership of less than 5%. Those 1,480 stocks include many small- and mid-cap names that may be less familiar to foreign investors.
There are many good long-term investment opportunities in large-cap Chinese stocks. But naively following crowds can be risky, if sentiment and momentum toward popular positions reverse. We believe the Chinese market offers a world of opportunities in a diverse set of companies that are off the beaten path. International investors seeking to take advantage of China’s newly opened markets should make sure their asset managers have strong local knowledge of companies and industries as well as the capabilities and skill to capture the potential that’s being overlooked by the masses.
Should Stock Buybacks Be Banned? (Ed Yardeni)
Good analysis by Ed Yardeni.