Trump’s Fight With Canada Over Nafta Faces New Hurdles
President Donald Trump’s effort to force Canada into signing on to a new Nafta on his terms is facing new hurdles thanks to growing opposition at home to his threat to proceed without the U.S.’s northern neighbor. (…)
“There’s going to be a lot of pressure to get a deal with Canada,” Mark Sobel, a former U.S. Treasury official and now American chairman of the research group OMFIF. “Canada’s the main trading partner for many states, quite a bit of our economic fortunes are entwined with Canada.”
The battle with Canada is building as the White House also prepares to roll out new tariffs on products from China that make up some $200 billion in annual trade in the most significant batch of duties yet aimed at Beijing. A public comment period wraps up Thursday and people familiar with the White House deliberations last week said the U.S. president is eager to move soon after that. China has already said it will retaliate. (…)
The problem for Trump is that U.S. business and farm groups as well as a broad bipartisan swath of legislators say they will oppose any deal that doesn’t include Canada. If the AFL-CIO’s opposition to a Nafta without Canada holds, it would leave Trump facing opposition by bosses, farmers, workers and politicians — every major constituency in American trade politics. (…)
Dollar shifts up through the gears, EM currencies skid again A rebound in Chinese shares and a rally in Italian bonds bolstered Europe’s spirits on Tuesday, though the pressure remained firmly on emerging market currencies as the dollar shifted up through the gears again.
China lures chip talent from Taiwan with fat salaries, perks
The cost of buying a home is rising three times faster than the cost to rent In nearly two-thirds of counties nationwide, it’s now cheaper to rent than buy a home
The monthly cost of buying a home — which includes mortgage payments, taxes and insurance — jumped 14% between July 2017 and July 2018, according to a report released Thursday by Realtor.com. Comparatively, it only became 4% more expensive to rent a home over that same period.
That disparity means that for much of the country, it’s now much more affordable to rent than it is to buy. It’s cheaper to buy in only 35% of counties nationwide, and just 41% of the U.S. population lives in those counties.
The gap is even greater in counties where the population exceeds 100,000 people — buying is more affordable in only 7% of those counties. Over the past year, 20 counties with 100,000 residents or more shifted from being more affordable for home buyers to being cheaper for renters. Three-quarters of these counties were located in the South and the Midwest, Realtor.com reported. (…)
MANUFACTURING PMIs
August U.S. PMI signals strong growth despite dipping to nine-month low
The seasonally adjusted IHS Markit final U.S. Manufacturing Purchasing Managers’ Index™ (PMI™) registered 54.7 in August, down from 55.3 in July. Although signalling the weakest improvement in operating conditions since last November, the PMI indicated a strong overall manufacturing performance. Moreover, the latest figure remained well above the long-run series average.
Output growth across the goods-producing sector remained strong, despite the rate of expansion softening to an 11-month low. Panellists that reported higher output generally linked this to greater new order volumes.
Similarly, new business rose at a slightly slower, albeit still strong, rate in August. Anecdotal evidence stated that greater new orders from home and abroad had driven growth. Moreover, new business from abroad returned to expansionary territory. However, some panellists noted that client demand was relatively lacklustre when compared to the start of the year, leading to a slightly weaker overall upturn.
Consequently, rates of employment and backlog growth remained solid. This was despite rates of growth softening to four-month lows. Anecdotal evidence commonly stated that job creation stemmed from increased production requirements and greater efforts to recruit skilled labour.
On the price front, manufacturers signalled a marked rise in input costs. Although the rate of inflation softened to a six-month low, it remained marked and was linked to new trucking regulations, higher raw material prices (in part driven by tariffs), and supply shortages (especially for electronics components).
Average charges rose strongly, with respondents reportedly partly passing higher costs on to clients in order to protect profit margins. Although dipping to a five-month low, the rate of inflation remained well above the long-run series trend.
Meanwhile, supplier delivery times lengthened further in August. Although lead times increased to the weakest extent since February, the rate of deterioration remained historically marked. Panellists continued to report widespread stockpiling of inputs, with buying activity rising solidly.
Finally, expectations towards output over the coming 12 months improved. The degree of confidence reached a three-month high.


Meanwhile in Canada:
August data pointed to a sharp and accelerated upturn in Canadian manufacturing output, but the latest survey also revealed a loss of momentum for new business growth. Anecdotal evidence suggested that some clients had adopted a wait-and-see approach to spending in response to heightened business uncertainty and ongoing global trade tensions.
Steel and aluminum tariffs contributed to the fastest rise in manufacturers’ input costs since April 2011. At the same time, factory gate charges increased at one of the sharpest rates since the survey began in 2010. (…)

Meanwhile in Mexico:
PMI data for August highlighted a softer growth patch of the Mexican manufacturing sector, with new work, exports and employment all displaying weaker increases than recorded at the start of the third quarter. At the same time, production dipped into contraction territory.
Nonetheless, the slowdown doesn’t yet ring alarm bells on growth prospects. When looking at anecdotal evidence supplied by respondents, it’s clear that production was hampered by material shortages, while a stronger upturn in input purchasing shows firms’ willingness to reverse the downturn trend in output in the near term. Confidence in the outlook was also evident in an uptick of manufacturing sentiment, sustained job creation and stock-building initiatives.

Eurozone manufacturing sector growth softens in August
Manufacturing operating conditions in the eurozone continued to strengthen during August, maintaining a run of expansion that now stretches to 62 months. However, posting 54.6, unchanged from the earlier flash-estimate, but down from July’s 55.1, the final IHS Markit Eurozone PMI pointed to the slowest growth since November 2016.
Reflective of the loss of momentum experienced by the sector in 2018 to date, the headline PMI is now six points lower than December 2017’s record high. Similar trends were observed at the market group level, with business conditions improving at slower rates across the consumer, intermediate and investment goods categories in August. Investment goods continued to perform the strongest, followed by intermediate goods.
There remained a notable divergence between the strongest and weakest performing manufacturing sectors at the country level. The Netherlands and Ireland led the way, with growth rates both ticking up since July. Austria and Germany continued to enjoy robust rates of expansion, whilst Greece, France and Spain all turned in solid growth performances. In contrast, Italy registered its worst manufacturing PMI reading for two years, with operating conditions little changed since July.
Eurozone manufacturing output rose further in August, with growth improving to its highest in three months. Growth strengthened despite the level of new orders increasing at the slowest rate for two years. In a number of instances, this left manufacturers with an excess of stock at their plants. Warehouse inventories subsequently rose slightly in
August.The slowdown of the manufacturing sector during 2018 has coincided with a similar weakening of export trade. August’s data showed that new export orders rose at a rate unchanged on July’s near two year low. Weaker gains in new export orders were seen in Germany, Italy and Spain, whilst only marginal growth was registered in France, following a decline in July. Greece, the Netherlands and Ireland all saw stronger gains, whilst there was a return to modest growth in Austria.
With backlogs of work continuing to increase during August, albeit at the slowest rate in over two years, manufacturers continued to add to their payroll numbers. Overall employment growth was again historically elevated, although the net gain was the lowest recorded by the survey since February 2017. There were job gains across all nations covered, with growth led by Germany and the Netherlands. In contrast, relatively modest gains were seen in France and Italy.
On the price front, input cost pressures remained elevated, despite the rate of inflation easing to a three-month low. Steel and oil-related goods were reported to be up in cost, whilst there were several reports of increased prices for agricultural products.
Supply-side shortages also underpinned inflation, according to anecdotal evidence. Reflective of a lack of inventory at suppliers, average lead times for the delivery of inputs continued to lengthen noticeably in August.
Manufacturers sought to pass on their higher costs to clients by raising their own charges. The rate of inflation remained historically marked, albeit the lowest recorded for a year.
Finally, global trade tensions and the possibility of further tariff impositions weighed on expectations during the latest survey period. Business optimism was lower than in July and subsequently remained well down on levels seen around the turn of the year.

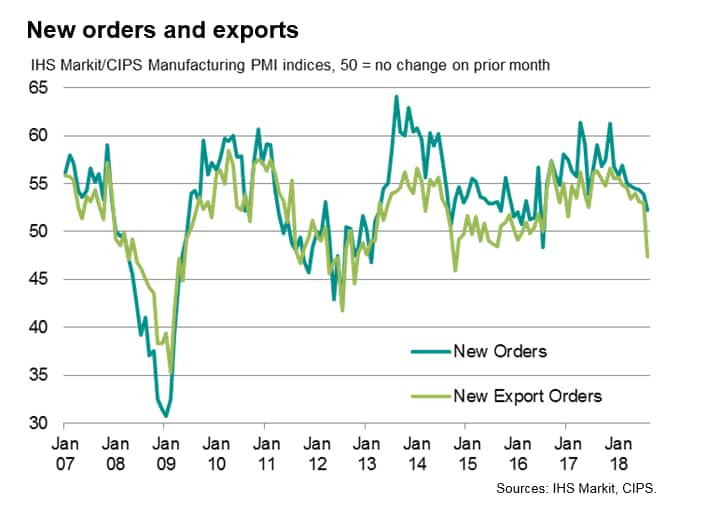
- UK new export orders are now contracting, suggesting weak demand abroad:
While exports had been an important driver of the manufacturing upturn for much of 2017, the trade picture has worsened in recent months, culminating in a sharp drop in exports in August. The export decline is all the more worrying due to the sustained weakness of sterling during the month, which should be helping to boost the competiveness of UK goods in overseas markets.
Export orders fell for consumer goods, investment goods (such as plant and machinery) as well as intermediary goods. The latter, which are inputs provided to other manufacturers abroad, showed the steepest decline and fell for a second successive month.
China PMI edges down to 14-month low in August
August survey data signalled a further improvement in Chinese manufacturing operating conditions. Output continued to expand, and at a quicker pace than in July. However, new orders rose at the slowest rate since May 2017, while export sales declined for the fifth month in a row. At the same time, employment remained on a downward trend which, in turn, contributed to an increase in outstanding workloads. Inflationary pressures meanwhile picked up, with firms noting steeper increases in both input costs and output charges.
Confidence towards future output remained stuck near June’s six-month low, with a number of panellists citing concerns over the impact of the ongoing China-US trade war and relatively subdued market conditions.
The headline seasonally adjusted Purchasing Managers’ Index™ (PMI™) posted above the neutral 50.0 level at 50.6 in August. However, this was down from 50.8 in July and signalled the weakest improvement in the health of the sector since June 2017.
Manufacturing production continued to increase during August, and at the fastest rate since the start of the year. However, latest data indicated that demand conditions softened, with total new business rising at the slowest pace for 15 months. Weaker foreign demand contributed to the softer increase in overall new work, with export sales declining for the fifth month in a row.
Reports of company restructuring and cost-cutting initiatives underpinned a further reduction in headcounts at Chinese manufacturers in August. The rate of job shedding picked up from July but remained moderate overall. At the same time, backlogs of work rose for the thirtieth month in a row.
Manufacturers continued to expand their buying activity in August. That said, the rate of growth was modest and below the series average. Stocks of purchases meanwhile rose only slightly, which in part reflected a more cautious approach to inventory holdings. Notably, stocks of finished items fell for the fourth month in a row.
Average supplier performance continued to deteriorate in August, with some panellists linking longer lead times to stricter environmental policies. However, the rate at which delivery times lengthened was the slowest for six months.
Input costs increased at an accelerated rate in August, with the rate of inflation the second-sharpest in seven months. According to panellists, higher raw material costs drove the latest upturn in purchasing prices. As a result, average charges for manufactured goods rose further, with the rate of inflation also quickening since July.
Optimism regarding future production remained relatively subdued in August, with confidence little-changed from June’s recent low. Positive forecasts were generally linked to expectations of rising client demand. However, concerns over the ongoing China-US trade war and softer demand conditions weighed on overall sentiment.

Taking care of business:

Japan business conditions improve moderately in August
The headline Nikkei Japan Manufacturing Purchasing Managers’ IndexTM (PMI)® registered at 52.5 in August. This was compared to 52.3 in July, thereby indicating a stronger rate of improvement in operating conditions across the Japanese goods-producing sector. Latest data extended the current period of growth to two years; however, compared to rates of improvement observed during the first and second quarters, the latest PMI reading pointed to a relatively soft improvement.
Demand continued to increase during the latest survey period. Notably, for the first time since April, new orders increased at a faster pace. Panellists indicated that new client wins and product diversification had supported higher sales volumes. To accommodate for this, output was increased at a moderate and faster pace.
Survey data indicated new business was primarily sourced from domestic markets, as export orders declined. Some survey participants noted weaker sales to Chinese customers.
Greater order book volumes impacted production capabilities, with backlogs of work increasing in August for a twelfth successive month. That said, the rate of accumulation was only mild. To enhance capacity, firms hired extra staff, albeit to the joint softest extent since November 2016. According to some companies, workforce numbers fell due to increasing retirements.
Capacity pressures were also apparent across the supply chain. Input delivery times lengthened markedly in August. Vendor performance was reportedly affected by strong input demand and material shortages. Purchasing activity rose at the fastest pace in four months in August. However, stockpiling efforts were impacted by slower lead times, with pre-production inventories falling.
Increased shipping fees were reportedly one of several factors driving up operating expenses in August. Fuel, metals and labour were among the other inputs to have increased in cost. Overall, purchase prices rose sharply, with the rate of inflation remaining close to July’s 88-month peak.
Efforts to alleviate profit margin erosion were observed, as firms increased selling charges in August. In fact, the rate of increase was the steepest since October 2008.
Finally, future output expectations were positive, with new product launches, Olympic Games-related work and planned production capacity improvements underpinning confidence. However, the degree of optimism eased to a 21-month low amid geopolitical risk concerns.

Weak exports are also experienced in ASEAN countries as Markit reports:
In August, total new orders rose at the second-strongest pace for four years, despite a decline in export sales. New business from abroad fell at the quickest pace since the end of 2016.
Beware of the Q Trap
Very interesting note from Blackrock’s Jean Boivin. This is the conclusion but the whole piece is a good informative read.
QT should not be viewed as the mirror image of QE. Doing so overlooks the ability of the private sector in creating credit and liquidity. US policy rates are rising, yet they are only approaching neutral levels and the resulting tightening of financial conditions is modest. How risk appetite evolves is more material to the outlook for financial conditions. The threat to risk assets is from this heightened uncertainty that confronts investors with a wider array of potential outcomes to the upside (US fiscal stimulus in the near term) and downside (trade tensions and overheating). As long as this uncertainty persists, we expect investors to manage this uneasy equilibrium by demanding higher risk premia across asset classes.
Italian Politics Keep Global Investors on EdgeWorries around the fall budget in Italy have sent global investors’ holdings of eurozone equities to their lowest since 2015.
Abe vows to raise Japanese retirement age Prime minister sets out plan to reform social security as country faces challenges of ageing population
To Counter China, U.S. Looks to Invest Billions More Overseas White House hopes to expand Overseas Private Investment Corp., a little-known agency it wanted to eliminate a year ago
Congress is working to resolve the last barriers to passing a bill that would boost the U.S.’s role in international development. It would combine several little-known government agencies into a new body, with authority to do $60 billion in development financing—more than double the cap of the current agency that performs that function. The measure, supported by the Trump administration, easily passed the House this summer; it faces its biggest test in the Senate.
The new agency would have broad authority to go toe-to-toe with China in offering countries financing options for major infrastructure and development projects. (…)
US-China trade war prompts supply chain rethink Suppliers to Google and Hoover among those looking to shift production out of China
Steve Madden is shifting handbag production to Cambodia, Vietnam is sucking up some production for Hoover-maker Techtronic Industries and Google’s hardware maker Flex is seeking new production centres from Mexico to Malaysia. (…)
EARNINGS WATCH
The Q2’18 earnings season has closed.
Overall, 99% of the companies in the S&P 500 have reported earnings to date for the second quarter. Of these companies, 80% have reported actual EPS above the mean EPS estimate, 5% have reported actual EPS equal to the mean EPS estimate, and 15% have reported actual EPS below the mean EPS estimate. The percentage of companies reporting EPS above the mean EPS estimate is above the 1-year (75%) average and above the 5-year (70%) average. If 80% is the final percentage for the quarter, it will mark the highest percentage of S&P 500 companies reporting actual EPS above estimates for a quarter since FactSet began tracking this metric in Q3 2008. The current record is 78%, which occurred in Q1 2018.
In aggregate, companies are reporting earnings that are 5.0% above expectations. This surprise percentage is below the 1-year (+5.6%) average but above the 5-year (+4.4%) average.
In terms of revenues, 72% of companies have reported actual sales above estimated sales and 28% have reported actual sales below estimated sales. The percentage of companies reporting sales above estimates is below the 1- year average (73%) but well above the 5-year average (58%).
In aggregate, companies are reporting sales that are 1.3% above expectations. This surprise percentage is above the 1-year (+1.2%) average and above the 5-year (+0.7%) average.
The blended (year-over-year) earnings growth rate for Q2 2018 is 25.0%. If 25.0% is the final growth rate for the quarter, it will mark highest earnings growth reported by the index since Q3 2010 (34.1%). The blended (year-over-year) revenue growth rate for Q2 2018 is 10.1%. The second quarter marked the highest revenue growth reported by the index since Q3 2011 (12.5%).

Given recent trends in costs (e.g. transport, trade), it is very important to carefully monitor corporate guidance and analysts revisions.
Analysts remain upbeat on Q3 and full year earnings on S&P 500 companies:

Somewhat less upbeat on mid and small caps where down revisions have averaged 48% in the last 4 and 2 weeks.

The above Thomson Reuters IBES tables only provide the number of revisions. Factset monitors the changes in estimates:
During the first two months of the third quarter, analysts lowered earnings estimates for companies in the S&P 500 for the quarter. The Q3 bottom-up EPS estimate (which is an aggregation of the median EPS estimates for all the companies in the index) has dropped by 0.9% (to $40.63 from $41.00) during this period. (…) the decline in the bottom-up EPS estimate recorded during the first two months of the third quarter was smaller than the 5-year [2.5%], 10-year [3.6%], and 15-year [2.8%] averages.

Interestingly, corporate guidance has been deteriorating lately. Negative pre-announcements are now 60% of the total, from 52% and 55% at the same time during Q2’18 and Q3’17 respectively. The sharp drop in positive guidance can also be seen worrisome given that companies are generally more prone to increase than to decrease guidance.

During the month of August only, 71.4% of pre-announcements were negative per TR numbers. Last week, we got 1 positive guidance but 6 negative.
Ed Yardeni monitors the changes in estimates for large, mid and small caps. While large caps have only seen a small decline in their Q3 estimates as Factset reports, their current Q3 estimates have slipped below Q2 EPS. Q3 EPS are typically equal or above Q2 numbers. At this stage, this would require a 1% beat.

On the other hand, there has been a clear deterioration in estimates on mid and small caps. Mid-cap EPS are now seen unchanged from Q2’18 while small caps are expected to show Q3 EPS 4.7% lower than Q2. Not particularly inspiring for a group that has returned 17.4% YtD vs +8.8% for the S&P 500 Index.


It is also interesting to know that only 67% and 64% of S&P 400 and 600 companies respectively beat in Q2.
TECHNICALS WATCH
Lowry’s Research warns that small caps are not uniformly outperforming:
But, while strong small caps remained strong, small caps also displayed the most widespread weakness with 32.1% down 20% or more from their 52-week highs as of Aug. 29th vs. 14.8% of mid caps and just 5.7% of large caps. Thus, in terms of portfolio construction, small caps present the widest disparity in performance, suggesting selectivity is likely of paramount importance when considering new buying in this Segment.
Small cap breadth has been deteriorating:

However, Lowry’s analysis suggests that “this bull market remains healthy and with little of the evidence that typically precedes the formation of a major market top.”
That said, there are cracks in the so far widely bullish technicals:
(…) the current reading suggests Demand for individual common stocks is slightly less than at prior highs in the market. Similarly, the percentages of NYSE issues trading above their 10- and 30-week moving averages remain well below their levels at the time of the Jan. high in the S&P 500, suggesting strength among common stocks is becoming more selective. (…) there is little question that the current percentage of New Highs is well below levels at the Jan. and June market highs. Again, this differs from the pattern leading up to the Jan. 2018 market high, when the number of New Highs was steadily rising. At present, the lack of New Highs is most apparent among Large and Mid Cap stocks.
This market is getting narrower. Bob Farrell’s #7: Markets are strongest when they are broad and weakest when they narrow to a handful of blue-chip names.


In case you did not notice, the S&P 500 Index is up 8.8% this year but only 3 sectors are positive: CD, IT and HC which together represent 54% of the Index.
The Chaikin Power Gauge Rating shows only 4 sectors (Utes, HC, IT, Com.) with positive Power Bars, these 4 sectors accounting for 60% of the total positive ratings among S&P 500 companies.
The S&P 500 Index jumped 3.2% during risky August. Let’s hope frightening September also behaves well.
 Source: Market Ethos, Richardson GMP (via The Daily Shot)
FYI: The S&P 500 is 6.1% above its still rising 200-dma. CD is 10.1% above, IT, 11.0% and HC 9.0%. Other sectors are at or very near their 200-dma.

NASDAQ is 9.3% above its still rising 200-dma.

 Electric Mercedes opens German assault on Tesla