CFO Survey: Economic Outlook for 2022 Deteriorates
Views on the economy among CFOs have worsened for 2022, according to the latest results of The CFO Survey, a joint project of Duke University’s Fuqua School of Business and the Federal Reserve Banks of Richmond and Atlanta.
“Price pressures have increased, real revenue growth has stalled, and optimism about the overall economy has fallen sharply,” said John Graham, a Fuqua finance professor and the survey’s academic director. “Monetary tightening is one of several factors dampening the economic outlook.”
The quarterly survey of 320 U.S. financial executives was conducted May 25-June 10. Among its findings:
- The median CFO expectation last quarter was for a 6 percent increase in unit costs for 2022; this quarter the expectation was an 8 percent increase. Unit cost increases are expected to moderate in 2023.
- Adjusted for inflation, average revenues are not expected to grow in 2022, down from real revenue growth of approximately 3 percent on average in last quarter’s survey.
- Employment growth is expected to moderate for the typical firm in 2022.
- If borrowing costs were to increase by 2 percent, half of borrowing firms indicate they would reduce their capital spending plans.
- If borrowing costs were to increase by 3 percent, two-thirds of borrowing firms indicate they would reduce their capital spending plans.
 CFOs now expect flat sales volumes this year, down from +3% three months ago, underscoring the radical slowdown since March that has yet to transpire in official economic data.
Consumer spending for Q1 has already been revised down from +3.1% to +1.8% in the third iteration of GDP. But, as I wrote on June 30, the bigger, actually shocking, revision was on real personal disposable income revised down from -2.0% in the first GDP estimate to -7.8% in the third, “primarily reflecting an upward revision to personal current taxes.”
The next day, we learned that real expenditures on goods were down 1.6% in May after +0.3% (revised from +1.0%) in April. Real services were revised down every month this year, from +0.6% on average to +0.4% Jan. to Apr. and to +0.3% in May.
The income/spending relationship is back to normal but, unless inflation abates quickly, lower real income will push total expenditures downward.

Clearly, slowing demand for goods is not fully offset by services while spending power is quickly eroding. Not the smooth transition many were forecasting (hoping).
In June 23, the S&P Global flash PMI for the U.S. revealed
(…) a solid fall in new orders [for services companies]. Client demand dropped for the first time since July 2020, and at the steepest pace for over two years. Total new sales were also weighed down by the quickest decrease in new export orders since December 2020.
Clear sequence: softer spending on goods in March, then a sharp drop in April and May. Services were hanging in…until June per the flash PMI. No major Omicron impact there.
Ned Davis Research has an Economic Timing Model which
plunged to a reading of 4 in May, its lowest level since the early months of the pandemic. The steep decline over the previous three months moved the Model from indicating above-trend growth in March to indicating slow growth today.
Since 1948, a drop in the ETM into the low growth zone has been followed by recession a median of two months later. The only exceptions are 1951 and 1956, when it returned to the moderate growth zone. Heeding the Model, we believe the risk of recession has been pulled forward to late 2022/early 2023.
The decline in the ETM was driven by weakening leading economic indicators (LEI), tumbling equity prices, and tighter financial conditions.
The LEI specifically posted its third consecutive decline in May, the first time that has happened since April 2020, producing a slowdown signal for the economy. Historically, the LEI has peaked a median of ten months ahead of recession, raising the risk of contraction at the end of this year.
David Rosenberg has another way of looking at the LEI suggesting the recession is here:
On the leading indicator, here’s the reality: the Conference Board’s official index of leading economic variables goes back to February 1959, and whenever this composite fell three months in a row and in four of five, the economy was still in economic expansion less than 1% of the time six months out. So let me repeat — 99% of the time in the past 70+ years, the economy was either in recession or within six months of entering one with the LEI contracting three straight months and for four of five months, as is currently the case.
The Fed could thus be completely misreading the situation, aggressively tightening while the consumer and the housing market are weak and weakening, hoping that saved stimmies will spend us out of the mess.
Assume that the assumed $2.7 trillion of excess savings are still there, that’s 11% of GDP. But the current U.S. equity market drawdown, so far, is equivalent to 46% of GDP. Plus the crypto meltdown. And unlike other equity bears, this one did not come with a bond bull, a bond bear rather. In terms of wealth destruction, particularly for the wealthiest, 2022 is almost unparalleled.

The $19B Consumer Discretionary Select Sector SPDR Fund (XLY) is down 32% this year, -24% since April. Its components are, much like the S&P 500 Index, primarily goods companies. The narrower Invesco Dynamic Leisure and Entertainment ETF (PEJ), invested mostly in services companies, is also down 24% since April after having held up in Q1. Investors are not seeing the same offset from services as the Fed is.

Yesterday, I posted the Atlanta Fed’s GDPNow estimate for Q2, at -1.0% as of June 30. I had missed the July 1 update, now -2.1% after the latest data on construction spending but mainly after the June Manufacturing ISM. The consensus is still +2.9%!

On June 15, the FOMC published its median 2022 estimate calling for +1.7% GDP growth, down from +2.8% in March. With Q1 at -1.6%, if Q2 is, say +1.0-1.0%, second half growth would have to be 3-4%+ for the FOMC to be about right. The latest Atlanta Fed release must have shaken many in the Eccles building where the FOMC meets on July 26-27. They will not meet again until September 20-21.
Hopefully, the July 13 CPI release will show the beginning of some easing. It will come 2 days before the retail sales report. But the next consumer expenditures and PCE inflation report, with more input on services spending and prices, is only due July 29, after the FOMC.
The San Francisco Fed has designed a tool to track the price changes in the extent to which either supply or demand factors are responsible for inflation levels. Declining demand is already having an impact on prices, particularly since March, but supply constraints and other factors (yellow) have taken over and kept monthly core inflation in the 4% annualized range, so far…
Supply- and Demand-Driven Contributions to Annualized Monthly Core PCE Inflation

The key is services inflation since goods prices will undoubtedly decline as retailers liquidate their excess inventories and supply bottlenecks ease.
Goldman Sachs has this neat chart showing that 47%, and rising, of core services categories ex-shelter are inflating by more than 4% annualized with 25%, and rising, inflating by more than 6%.

The glass half full approach would say that 53% of categories are seeing prices rising by less than 4%, but that proportion is down from 80-90% pre-pandemic, and falling.
Meanwhile, Goldman’s wage tracker is flirting with 6% which, coupled with rising energy prices, will keep pressuring service providers.

Our national index rose by 1.3 percent over the course of June, consistent with last month’s increase. So far this year, rents are growing more slowly than they did in 2021, but faster than they did in the years immediately preceding the pandemic. Over the first half of 2022, rents have increased by a total of 5.4 percent, compared to an increase of 8.8 percent over the same months of 2021.
For comparison, rent growth from January to June totalled 3.1 percent in 2017, 3.6 percent in 2018, 3.4 percent in 2019, and -0.7 percent in 2020.
Year-over-year rent growth currently stands at a staggering 14.1 percent, but has been trending down from a peak of 17.8 percent at the start of the year.
On the supply side, our national vacancy index ticked up slightly again this month, continuing a streak of gradual easing dating back to last fall. Our vacancy index now stands at 5 percent, up from a low of 4.1 percent, but remains well below the pre-pandemic norm. And with spiking mortgage rates sidelining potential homebuyers, we could see additional tightness in the rental market in the months ahead. Rents increased this month in 97 of the nation’s 100 largest cities. New York City has seen the nation’s fastest city-level rent growth over the past year, while some of the hottest Sun Belt markets are finally showing signs of plateauing growth. (…)


Bank of Canada’s rapid rate hikes likely to cause a recession, study finds
Accelerating Inflation in Asia Puts Pressure on Central Banks to Raise Rates Accelerating inflation is rippling through the Asia-Pacific, stoking expectations that policy makers will need to keep ratcheting up borrowing costs to cool climbing prices.
China’s Housing Pain Set to Continue After Sales Bottom
Industry executives and economists foresee sales remaining depressed due a weak job market, a prolonged cash crunch and low confidence on housing prices. It could hit growth in the world’s second-largest economy, where real estate and related industries account for about 20% of gross domestic product.
Sales at China’s largest housing developers fell 43% in June from a year earlier, according to China Real Estate Information Corp., less than the previous month’s 59% decline. Weekly sales data from CRIC show that some major cities, including Shenzhen and Guangzhou in southern China, generated year-on-year growth at the end of June.
The market has “bottomed out” but a recovery will be slow, Yu Liang head of China’s second-largest builder China Vanke Co., said last week. He attributed the recovery partly to seasonal factors — property developers usually rush sales in June to polish interim results.
China’s land transactions increased in June compared with the previous month. Sales of land through auctions from 300 cities rose by 45% to 120 million square meters in June, China Securities Journal reported. Fewer under-subscriptions were reported from the first two rounds of auctions held by core cities, an indication that the housing market is recovering. (…)
CRIC data show home sales by top developers were up 61% in June from May. Still, that was less than half the pace of increase following the lifting of 2020’s lockdowns.
(…) developers in some rural areas to accept garlic, wheat and even watermelon as housing deposits in recent months. (…)
Luxury builder Shimao Group Holdings Ltd.’s default on a $1 billion offshore bond this week highlighted the severity of the spreading liquidity crisis. It could also leave millions of square feet of apartments unfinished — underscoring a risk that has deterred homebuyers. Developers’ completion for property projects slumped further in May, according to official data.
Chinese builders have been driving record offshore bond defaults this year, and the risks are now spilling into the onshore market. (…)]
“Limiting the drop of real estate industry to between 10% and 20% would be difficult,” Feng Jun, a former housing ministry official who is now head of the state-backed China Real Estate Association, warned during a June 29 conference in Beijing.

American Factories Are Making Stuff Again as CEOs Take Production Out of China
(…) Rattled by the most recent wave of strict Covid lockdowns in China, the long-time manufacturing hub of choice for multinationals, CEOs have been highlighting plans to relocate production — using the buzzwords onshoring, reshoring or nearshoring — at a greater clip this year than they even did in the first six months of the pandemic, according to a review of earnings call and conference presentations transcribed by Bloomberg. (Compared to pre-pandemic periods, these references are up over 1,000%.) (…)
The construction of new manufacturing facilities in the US has soared 116% over the past year, dwarfing the 10% gain on all building projects combined, according to Dodge Construction Network.
(…) Russia’s invasion of Ukraine also got Pettit’s attention.
Not just because the war further snarled global trade and added to the surge in freight costs but because it reminded him that China could try something similar in Taiwan. And in the same way that business ended for most Western companies in Russia, so too it could end in China. Suddenly, that benign geopolitical backdrop that had helped encourage so many executives to globalize their operations over the past few decades was vanishing. And this, Pettit said, added to his sense of urgency to change things up. (…)

US Wants Dutch Supplier to Stop Selling Chipmaking Gear to China
The US is pushing the Netherlands to ban ASML Holding NV from selling to China mainstream technology essential in making a large chunk of the world’s chips, expanding its campaign to curb the country’s rise, according to people familiar with the matter.
Washington’s proposed restriction would expand an existing moratorium on the sale of the most advanced systems to China, in an attempt to thwart China’s plans to become a world leader in chip production. If the Netherlands agrees, it would broaden significantly the range and class of chipmaking gear now forbidden from heading to China, potentially dealing a serious blow to Chinese chipmakers from Semiconductor Manufacturing International Corp. to Hua Hong Semiconductor Ltd.
American officials are lobbying their Dutch counterparts to bar ASML from selling some of its older deep ultraviolet lithography, or DUV, systems, the people said. These machines are a generation behind cutting-edge but still the most common method in making certain less-advanced chips required by cars, phones, computers and even robots. (…)
The Dutch government has yet to agree to any additional restrictions on ASML’s exports to Chinese chipmakers, which could hurt the country’s trade ties with China, the people said. ASML is already unable to ship its most advanced extreme ultraviolet, or EUV, lithography systems, which cost about 160 million euros ($164 million) per unit, to China as it cannot obtain an export license from the Dutch government. (…)
ASML is the world’s top maker of lithography systems, machines that perform a crucial step in the process of creating semiconductors. ASML’s dominance of the market for that type of equipment means that further cutting China off from access to its products would undermine the Asian country’s ambitions to make itself more self-sufficient in production of the crucial electronic components.
“China’s share of the global chip-equipment market is negligible,” said Alex Capri, a research fellow at the Asia-based Hinrich Foundation, characterizing chip production as “a choke point” in China’s plans to bulk up its semiconductor muscle. (…)
American officials are also trying to exert pressure on Japan to stop shipping the same technology to Chinese chipmakers, one of the people said. Japan’s Nikon competes with ASML in this area.
Immersion lithography is also known as argon fluoride immersion, or simply ArFi. According to China-based Founder Securities, ASML sold 81 ArFi systems in 2021, compared with four from Nikon, giving the Dutch firm a 95% market share. (…)
Dutch Prime Minister Mark Rutte said in June he is against reconsidering trade relations with China and called for the EU to develop its own policies toward Beijing. China is the Netherlands’ third-biggest trade partner after Germany and Belgium.
ASML opposes a ban on sales of DUV lithography equipment to Chinese customers because it is already a mature technology, Wennink said earlier this year. Chinese-based facilities, run by either domestic or foreign companies, account for 14.7% of ASML’s total revenue in 2021, according to company disclosures and data compiled by Bloomberg.
ASML is also alleging potential IP infringement by a Chinese tech firm supported by the country’s government. (…)
Major US chip-equipment makers including Applied Materials Inc. and Lam Research Corp. are already banned from selling certain advanced products to SMIC due to national security concerns. The potential DUV ban could further hit SMIC and its Chinese peers.
“Lithography equipment is the most difficult equipment for China to replace when it comes to semiconductor production,” said Johnson Wang, an analyst at Taiwan Institute of Economic Research. “Without access to foreign DUV lithography equipment, the progress of China’s chip industry could come to a halt.”
Crypto Broker Voyager Digital Files for Bankruptcy Protection The voluntary filing comes after crypto hedge fund Three Arrows Capital defaulted on a large loan from a Voyager unit.
BA.5 Subvariant Drives Majority of Recent Covid-19 Cases The highly infectious version of the virus represented nearly 54% of U.S. cases in the week ended July 2, the CDC estimates.
(…) Another version known as BA.4, which is closely related to BA.5, and also ramped up recently, represents nearly 17% of cases, the CDC estimates.
Virus experts believe BA.5 is particularly adept at evading immune protections built up from prior infections and vaccines, giving it an advantage as it takes over as the major subvariant. This adds to the possibility people will contract Covid-19 repeatedly while facing the risk of developing complications like long-running and sometimes debilitating symptoms. (…)
The U.S. seven-day moving average for new Covid-19 cases has mostly hovered slightly above 100,000 a day since May, according to CDC data through last week, before the July Fourth holiday temporarily slowed reporting. These cases likely represent a fraction of actual infections due to at-home testing states generally don’t track, epidemiologists say. (…)
Hospitalizations remain far below levels seen in prior peaks, but there are signs of upward pressure, the latest federal data show. (…)
The seven-day moving average for confirmed, prior-day hospital admissions recently surpassed 5,000 a day for the first time since late February, data from the Department of Health and Human Services show. The U.S. in early April was averaging less than 1,500 new admissions a day.
Meantime, the U.S. recently averaged slightly more than 300 deaths a day. A year ago the average dipped to slightly above 200 a day, reflecting a lull in cases as vaccinations rose and a respite before the Delta and then Omicron variants took hold.
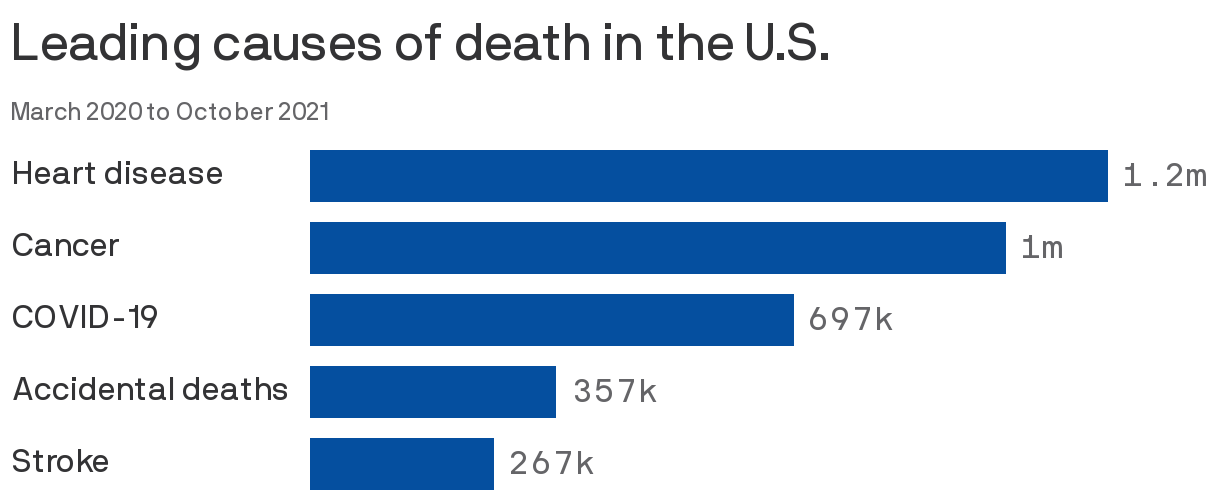
Data: JAMA Intern Medicine. Chart: Axios Visuals
- The Health Risks of Getting Covid a Second (or Third) Time New research details the risks of Covid-19 reinfection as more-infectious Omicron subvariants circulate.
(…) each new infection carries a risk of medical problems, including hospitalization, death and long Covid, according to preliminary data from a study of patients in the Veterans Affairs health system.
(…) out of 100 people with a reinfection and 100 who had only one infection, five more people with reinfection developed a lung or respiratory issue or heart problem within a six-month period. (…)
With the more contagious and immune-evading Omicron subvariants BA.4 and BA.5, reinfections matter because they will become more common, according to Dr. Topol.
“We’re headed into the worst zone of reinfection that we’ve seen since the pandemic began,” Dr. Topol says. (…)
New data from the United Kingdom’s Office for National Statistics found that the risk of getting reinfected with Covid-19 was seven times higher when Omicron variants were circulating compared with when Delta was the predominant strain.
The ONS, looking at the period between July 2020 and June 2022, also found that younger people were more likely to get Covid again, as were unvaccinated people. (…)
EVERYTHING IS SINKING, EVEN U.S DEMOCRACY
According to Gallup, confidence in the U.S. Presidency is now 23% (38% in 2021), the criminal justice system 14% (20%) and Congress 7% (12%). Seven percent!
Add the Supreme Court which now seems to be automatically voting everything 6-3, the same six vs the same three. These nine should have a discussion about their 25% current confidence level. Forty percent in 2020 was already dangerously low, 25% is alarming.
Confidence in the U.S. Supreme Court
