NEXT FRIDAY’S MAY CPI
Will the anticipated (or wished for) inflation downshift start in May? The consensus is +0.7% MoM with core CPI +0.5%.

- JP Morgan says that energy prices still rising and services price pressures
still building, a downshift now looks unlikely. JPM expects +0.8%. - S&P Global’s Manufacturing PMI: “The rate of cost inflation accelerated to the fastest in six months, with firms passing on higher expenses to customers through a near-record rise in output charges.” Prices of durable goods declined 0.9% MoM in March and edged up 0.05% in April. They are still up 14.0% YoY. Non-durables prices declined 0.2% in April but energy prices rose in May. Non-durables prices were up 12.8% YoY in April.
- S&P Global’s Services PMI: “Service providers passed on higher costs to their clients through another marked monthly uptick in output charges during May. That said, the rate of selling price inflation slowed from April’s record pace as a limited number of firms mentioned concessions made to customers.” CPI Services was up 0.76% MoM in April, +5.4% YoY.
Rising productivity was supposed to restrain companies from passing on their cost increases but that’s not happening as I wrote yesterday. Here’s David Rosenberg’s take:
Productivity has contracted a rare two of the past three quarters and at a -1.8% annual rate over this interval. In the post-WWII era, this has only happened in 1982, 1974, and 1960. All recessions. The level of productivity is down to a seven-quarter low, and what has happened here is that the +4.7% annualized increase in labor input (on a three-quarter percent change basis) has far outpaced the corresponding +2.8% expansion in real output.
Unit labor costs are skyrocketing:

While other costs keep rising:
Goldman Again Hikes Oil Price Target, Now Sees Barrel Hitting $140, Up From $125
Oil’s structural deficit therefore remains unresolved, with in fact an even tighter oil market through April than we had expected. Supply remains inelastic to higher prices with core-OPEC (higher) and exempt countries (lower) production shifts broadly offsetting. On the demand side, the negative global growth impulse remains insufficient to rebalance inventories at current prices. As a result, we believe oil prices need to rally further to normalize the unsustainably low levels of global oil inventories, as well as OPEC and refining spare capacities.
Updating our supply and demand expectations, we now forecast that Brent prices will need to average $135/bbl in 2H22-1H23 (up $10/bbl vs. prior forecast) for inventories to finally normalize by late 2023, the binding constraint to prices in our view. This represents summer retail prices reaching levels normally associated with $160/bbl crude prices (due to strong refining utilization, gas prices and USD) to achieve the additional 0.5 mb/d of price-induced demand destruction required to rebalance the market next year in addition to (1) global GDP growth exc. China slowing to 2% yoy, (2) record output from Saudi/UAE/Iraq and (3) Iran/Venezuela/Libya production rising 1.3 mb/d.
World inventories keep sliding:

While U.S. inventories are scary low:

Bloomberg: “The rally in raw materials shows little sign of a letup, pushing the Bloomberg Commodity Spot Index to a record high. Crude is hovering around $120 a barrel, with natural gas, oil and wheat among the biggest movers this year.”

Rosie calculates that “the business implicit price deflator has boomed to a 7.3% annual rate these past three months (highest since the fourth quarter of 1981)”.
The ongoing consumer squeeze will soon be joined by the corporate margin squeeze.
Speaking of consumer squeeze, this Bloomberg chart is truly amazing. Wage growth is still rather slow in highly populated areas such as CA and the Northeast states.

But inflation rates are not so dispersed: USA in April: +8.3%; West: +8.3%, Northeast: +7.2%.
May Sees Least Affordable Housing Market in 16 Years While Existing Mortgage Holders Gain Record $1.2 Trillion in Tappable Equity in Q1 2022
Today, the Data & Analytics division of Black Knight, Inc. (NYSE:BKI) released its latest Mortgage Monitor Report, based upon the company’s industry-leading mortgage, real estate and public records datasets. While rising home prices and volatile interest rates continue to compound the affordability pressures in the housing market, the same dynamics have also served to increase the housing wealth of American mortgage holders by a significant margin. According to Black Knight Data & Analytics President Ben Graboske, tappable equity – the amount available for mortgage holders to borrow against while retaining a 20% equity stake in their homes – has reached yet another all-time high.
- The monthly principal and interest (P&I) payment on the average-priced home with 20% down is nearly $600 (+44%) more than it was at the start of the year and $865 (+79%) more than before the pandemic
- As of May 19, with 30-year mortgage rates at 5.25%, the share of median income required to make that P&I payment had climbed to 33.7%, just shy of the 34.1% high reached in July 2006
- While tightening affordability is hampering prospective homebuyers, the home price growth at the root of the issue continues to increase the housing wealth of current homeowners with mortgages
- U.S. mortgage holders saw their collective tappable equity – the amount available to borrow against while retaining at least a 20% equity stake in the home – increase by $1.2 trillion in Q1 2022 alone
- In total, mortgage holders gained $2.8 trillion in tappable equity over the past 12 months – a 34% increase that equates to more than $207,000 in equity available per borrower

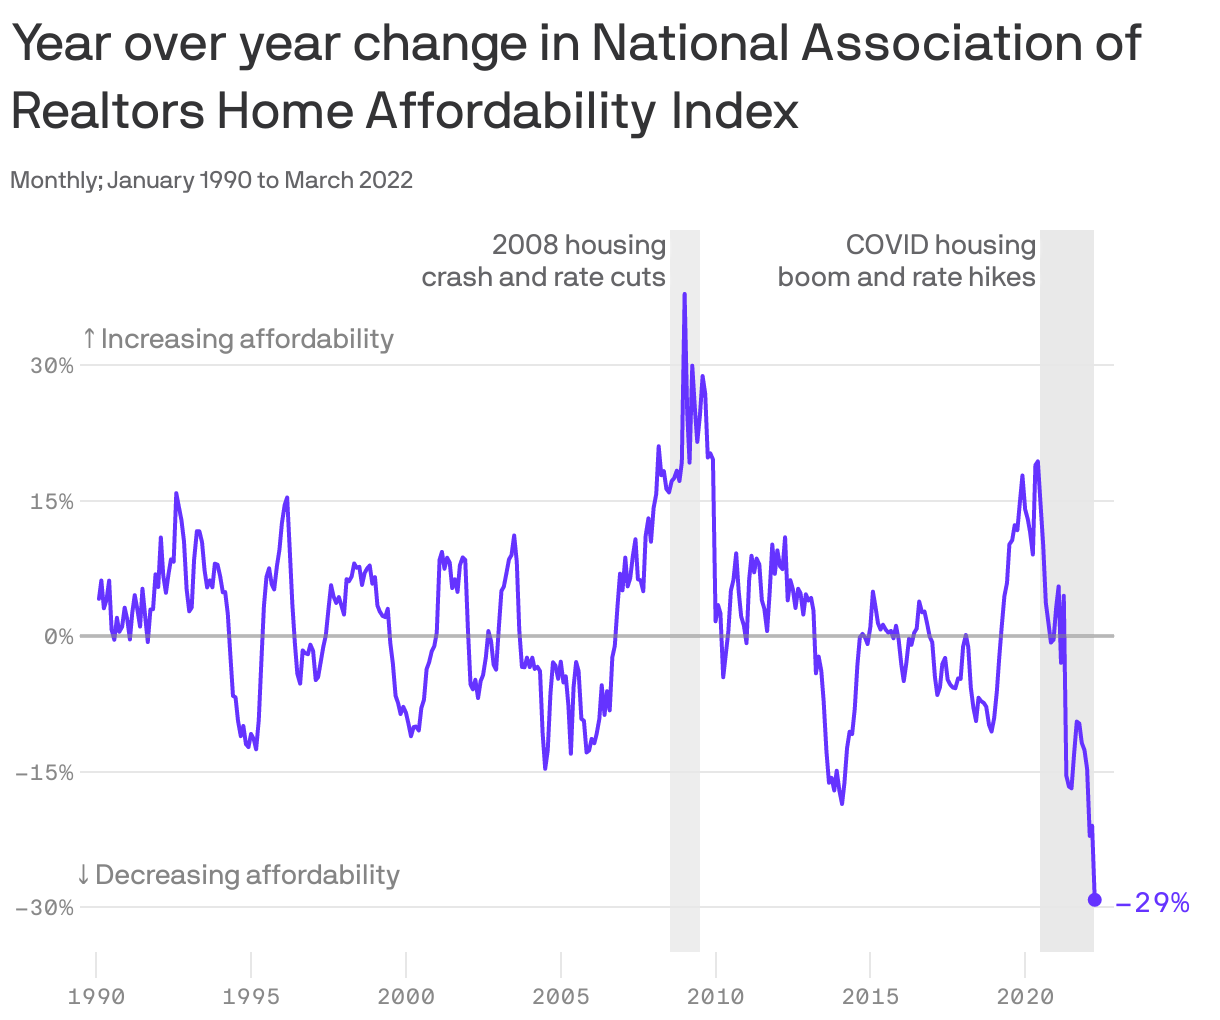
The squeeze has been sudden and brutal: Sharpest drop in house affordability on record (Axios):
Commercial Property Sales Slow as Rising Interest Rates Sink Deals The sector is showing the first signs of cooling in more than a year as higher borrowing costs lead some would-be buyers to back out.
Property sales were $39.4 billion in April, which was down 16% compared with the same month a year ago, according to MSCI Real Assets. The decline followed 13 consecutive months of increases. (…) In March, total commercial property sales had risen 57% from the same month a year before.
“To have it go from a very fast pace of growth the month before—the speed of that transition is shocking,” said Jim Costello, chief economist at MSCI Real Assets. A drop in sales can be an early indicator of stress in real-estate markets because prices are usually slower to change, he added. (…)
In some cases, investors are finding that with the increased cost to borrow, their near-term rate of return runs below the interest rate on their mortgage. Lenders, in turn, are now tightening their standards for more-speculative deals, brokers said.
In certain sectors, such as smaller industrial and retail real estate, prospective buyers that wrote letters of intent to purchase properties weeks ago are now dropping their bids because the cost to borrow has risen so quickly, said Joshua Campbell, a senior vice president at Stan Johnson Co., a commercial real-estate brokerage. (…)
“The pricing can’t be blind to changes in capital markets,” Mr. Neveloff said. (…) “It’s now turning into a buyer’s market,” Mr. Stimler said.
Global squeeze:
China’s consumers keep their wallets in lockdown as COVID curbs ease China’s retail sales shrank 11.1% in April from a year earlier, the biggest fall since the height of China’s first COVID outbreak two years ago that ravaged the city of Wuhan.
(…) China’s urban jobless rate rose to 6.1% in April, the highest since February 2020 and well above the government’s target ceiling of 5.5%. Some economists expect employment to worsen before it gets better, with graduates entering the workforce in record numbers. (…)
- UK shoppers cut spending by most since COVID lockdown in 2021 The British Retail Consortium (BRC) said total retail spending was 1.1% lower than a year earlier, the biggest fall since January last year and representing an acceleration from April’s 0.3% decline.
(…) The BRC said its ‘like-for-like’ retail sales measure, covering only outlets open in May 2021, showed a 1.5% annual fall in spending after a 1.7% contraction in April.
The figures are not adjusted for inflation – which hit 9.0% in April – which means the fall in volumes of goods purchased will have been much greater than the drop in money spent.
Data from Barclaycard, covering a broader range of spending, showed spending in May was up 9.3% from a year earlier, reflecting the rising cost of living and a bounce for travel and hospitality which were affected by restrictions last year.
Spending on essential items rose by 4.8%, pushed up by a nearly 25% leap for petrol and diesel which have soared in price. In response, consumers cut back on spending on digital content and subscriptions by nearly 6%.
Echoing the BRC data, Barclaycard said spending on furniture fell by 3.1% in May from April.
Spending at restaurants and pubs and bars fell by about 6% and 1% respectively during the month. (…)
Italy’s economy will grow by 2.8% this year, national statistics bureau ISTAT said on Tuesday, slashing a 4.7% projection made in December as high raw material prices and the war in Ukraine weigh on the outlook.
In its twice-yearly forecasting report, ISTAT projected that gross domestic product in the euro zone’s third largest economy will increase next year by 1.9%.
“The outlook for the coming months is marked by strong downside risks linked to further price rises, a decline in international trade and a rise in interest rates,” ISTAT said. (…)
- Australia raises rates by most in 22 years to battle surging inflation
- Chile’s central bank is set to deliver another rate increase in a bid to tackle surging inflation. Economists expect it’ll raise borrowing costs by 75 basis points to 9%. While smaller than the last hike, such a move would still push the key rate to its highest in more than 20 years. (Bloomberg)
Even a Soft Landing Can Be Ugly for Investors A spike in default rates and sharply lower corporate profits are among the possibilities unless inflation cools swiftly.
I really like long-term charts and John Authers offers many today:


Deutsche Bank AG
(…) default rates have been far lower since the cycle that started after the bursting of the dot-com bubble.
This was above all about low interest rates, which were held there by central banks in an attempt to keep the economy from crashing altogether. Their policies were also driven in large part by the implicit aim to minimize losses for bond investors, particularly in banks. Credit losses bring with them a far greater systemic risk than losses in an equity portfolio, which is perceived to be higher risk. “Moral hazard,” or the tendency to take on excessive risk when you know someone will rescue you from the consequences of your actions, has increased a notch after one attempt to reverse the trend led to near-disaster with the failure of Lehman Brothers. Rates have stayed low, and credit investors have perceived that they will have central banks on their side. This arguably robs capitalism of the necessary “creative destruction” and makes for a flabbier and less competitive economy. But for those on the right side of the trade, it’s been good. Both default rates and yields on debt have steadily declined, meaning a better deal for credit investors and for companies looking for finance.

If inflation does come under control quickly, then the Fed might come to the rescue once more, and the pattern of the cycles will repeat — but everything depends on rising prices. To quote Reid [from DB who made the projections on the first chart]:
Our view does depend on us being correct on inflation remaining notably above target through the end of this cycle and onto the next. If inflation does mean revert lower, then we will likely be wrong on both the 2023 recession and default cycle, and also on the start of a structural shift upwards in default rates over the years ahead.
This is Deutsche Bank’s chart of US margins since 1934:

Top Economist Urges China to Seize TSMC If US Ramps Up Sanctions
A senior Chinese economist at a government-run research group called on authorities to seize Taiwan Semiconductor Manufacturing Co. if the US hits China with sanctions on par with those leveled against Russia.
“If the US and the West impose destructive sanctions on China like sanctions against Russia, we must recover Taiwan,” said Chen Wenling, chief economist at the China Center for International Economic Exchanges. The research group is overseen by the National Development and Reform Commission, China’s top economic planning agency.
“Especially in the reconstruction of the industrial chain and supply chain, we must seize TSMC,” Chen said in a speech last month hosted by the Chongyang Institute for Financial Studies at Renmin University, which was posted online Tuesday by the nationalistic news website Guancha.
“They are speeding up the transfer to the US to build six factories there,” she added. “We must not let all the goals of the transfer be achieved.”
The comments are some of the most prominent so far showing how Taiwan’s chip industry is seen in Beijing as a key strategic asset in the intensifying rivalry between the world’s two largest economies. TSMC is the world’s largest contract manufacturer of semiconductors, accounting for more than 50% of the global foundry market, which involves businesses purely making chips for other companies. Its customers include Apple Inc., which relies on Taiwanese chips for iPhones. (…)