TRAVELING: Traveling in Peru for 2 weeks. I will post occasionally if and when time and internet availability permit.
RULE OF 20 STRATEGY: Based on the last available data, trailing EPS = $162.90 and inflation = 2.1%, the Rule of 20 Fair Value is 2916 calculated as follows: (20 – 2.1 = 17.9 x 162.90 = 2916). The Rule of 20 Strategy would be raising 20% cash at Fair Value.
U.S.: Another leading indicator flashes red
Based on the stock market rally [Friday], investors seem to have been encouraged by a consensus-topping U.S. establishment survey, the latter showing solid increases in March for non-farm payrolls, particularly in services-producing industries. That’s not to say all is rosy in the U.S. labour market. With declines during the month, both manufacturing and temporary employment had their worst quarter since 2016.
As today’s Hot Chart shows, temporary employment ─ which, like the yield curve, is a decent leading indicator ─ even registered a quarterly decline in Q1. The other report, the household survey, showed a large drop in employment driven by cuts in full-time positions. And with full-timers often better remunerated than part-timers, one should not be too surprised by the moderation in wage inflation, the latter dropping in March to 3.2% on a year-on-year basis. The only reason the unemployment rate managed to stay unchanged at 3.8% (despite sizable job losses in the household survey) was the drop in labour force participation. All told, there are reasons for the Federal Reserve to be cautious and remain in pause mode for a while. (NBF)

The red circles are from me to highlight other times when temp employment declined without a recession. The following charts show quarterly trends in manufacturing and full time.
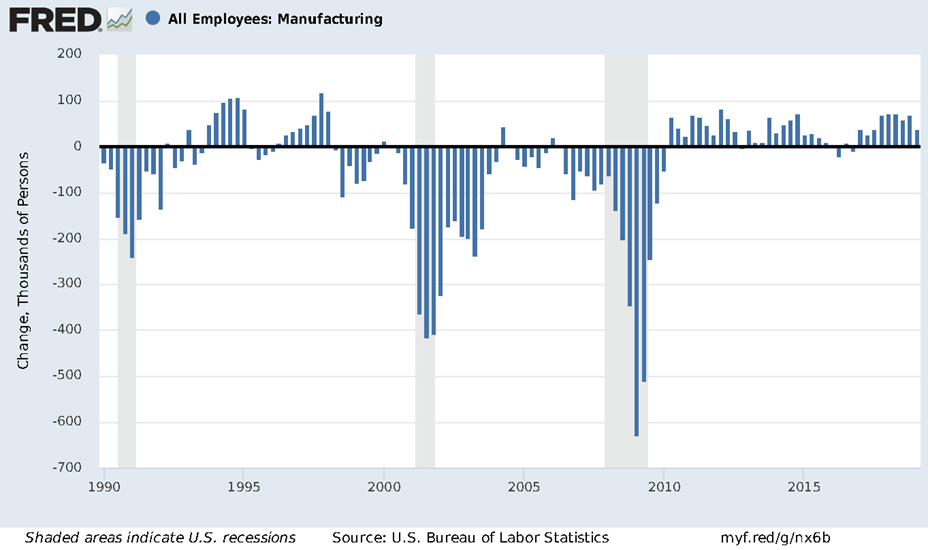
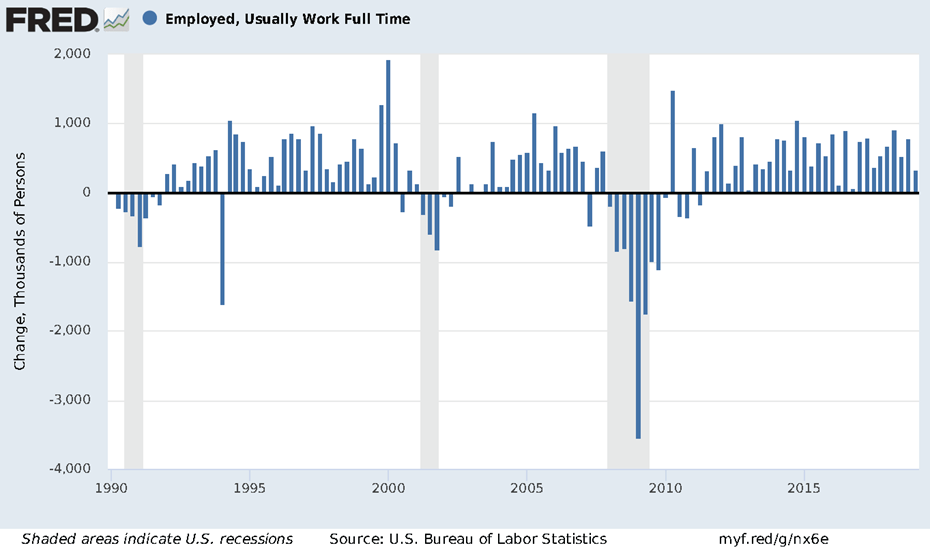
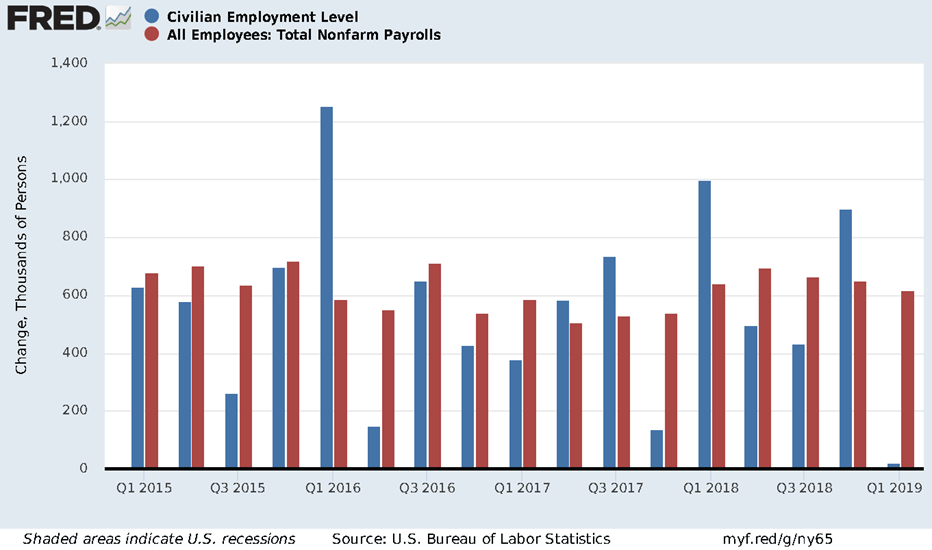
Some economists point to the near stagnation in household employment in Q1 as more significant than the continued strength in payroll employment. But household employment has shown much more volatility compared to the stable payrolls.
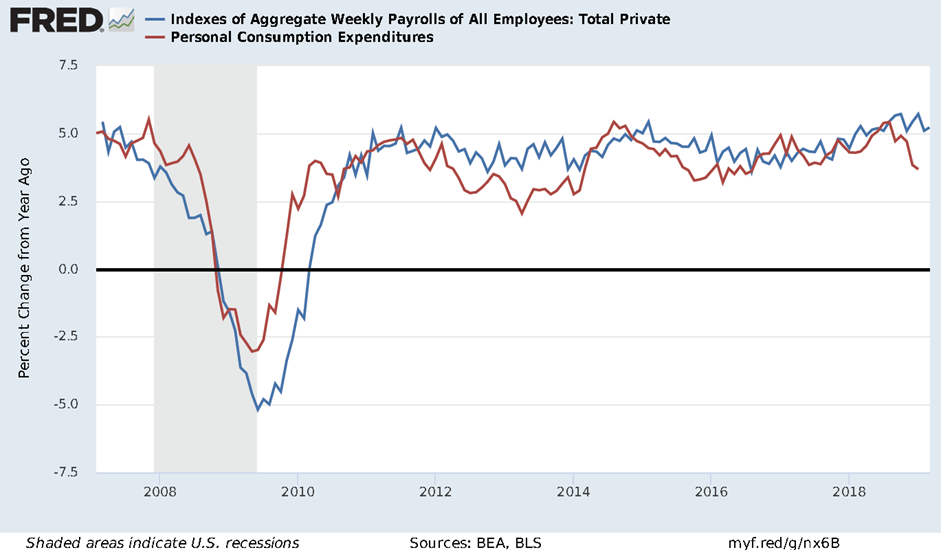
Here’s the payroll index (hourly earnings x hours worked), up 5.2% YoY in March and 4.8% annualized in Q1, same as Q4’18. Labor income growth remains strong. Will Americans grow their savings much longer?
TECHNICALS WATCH
We are in Peru mainly to visit Machu Picchu, the Inca citadel built in the 1400s. Our first thought this morning, waking up in the Sacred Valley, some 10,000 feet above sea level, was about the weather for our visit this afternoon and our trek tomorrow. From what we can see, the weather will collaborate! 
So says Lowry’s Research whose barometer, pretty good in the past year, keeps pointing FAIR. Lowry’s analysis of the forces of supply and demand continues to show declining supply and steady demand, particularly on pull-backs. Its other gauges are also positive:
In summary, clouds on the horizon can be fickle measures when attempting to discern fair or foul weather, as those clouds could develop into a storm or simply blow away. In the stock market, the forces of Supply and Demand have, over our 81 year history, proven to be much more reliable as means of identifying favorable or unfavorable market conditions than speculation and expectations about future events. And, while brief periods of market weakness are always a possibility, these forces of Supply and Demand continue to indicate a healthy bull market headed for new all-time highs in the months ahead.

1 thought on “THE DAILY EDGE: 8 APRIL 2019”
Happy travels!
==> Percent change:
10-Year Treasury Constant Maturity Minus 3-Month Treasury Constant Maturity, Percent, Not Seasonally Adjusted (T10Y3MM)
10-Year Treasury Constant Maturity Minus 2-Year Treasury Constant Maturity, Percent, Not Seasonally Adjusted (T10Y2YM)
S&P 500, Index, Not Seasonally Adjusted (SP500)
https://fred.stlouisfed.org/graph/?g=nz2f
Comments are closed.