THE EMPLOYMENT SITUATION—FEBRUARY 2019
Total nonfarm payroll employment changed little in February (+20,000), and the unemployment rate declined to 3.8 percent, the U.S. Bureau of Labor Statistics reported today.
Total nonfarm payroll employment was little changed in February (+20,000), after increasing by 311,000 in January. In 2018, job growth averaged 223,000 per month. The change in total nonfarm payroll employment for December was revised up from +222,000 to +227,000, and the change for January was revised up from +304,000 to +311,000. With these revisions, employment gains in December and January combined were 12,000 more than previously reported.

The average workweek for all employees on private nonfarm payrolls decreased by 0.1 hour to 34.4 hours in February. In manufacturing, the average workweek declined 0.1 hour to 40.7 hours, while overtime was unchanged at 3.5 hours. The average workweek for production and nonsupervisory employees on private nonfarm payrolls fell by 0.2 hour to 33.6 hours.
In February, average hourly earnings for all employees on private nonfarm payrolls rose by 11 cents to $27.66, following a 2-cent gain in January. Over the year, average hourly earnings have increased by 3.4 percent. Average hourly earnings of private-sector production and nonsupervisory employees increased by 8 cents to $23.18 in February [+3.5%].
U.S. Initial Unemployment Insurance Claims Edge Down
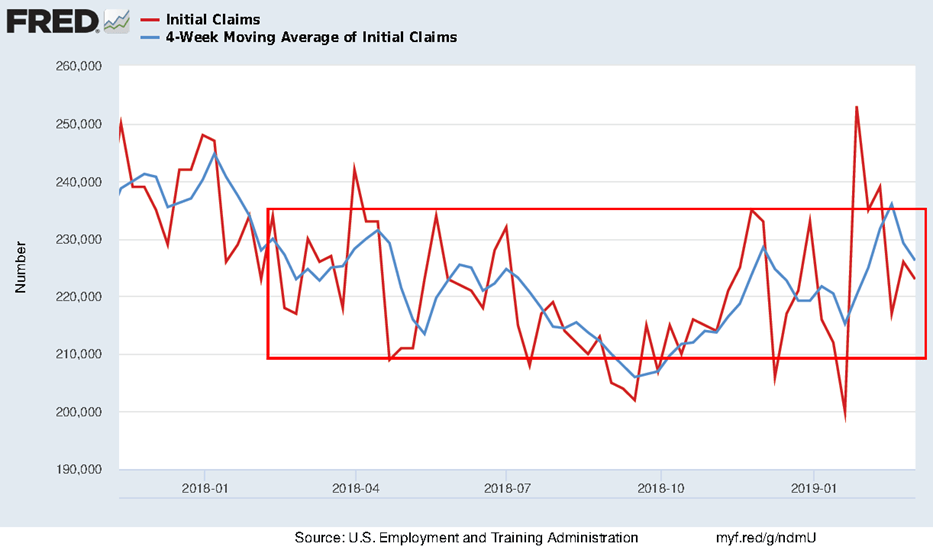
Initial claims for unemployment insurance edged down to 223,000 in the week ended March 2 from an upwardly revised 226,000 (initially reported as 225,000) in the previous week. The four-week moving average of initial claims fell further to 226,250 from 229,250 the previous week. Notwithstanding the recent decline, claims appear to be trending gradually upward since the middle of last September. (…)
Keeping track of David Rosenberg’s concerns about “forward-looking initial claims”. Back into the 2018 channel after the shutdown:
Bespoke looks at the non-seasonally adjusted data:
(…) claims rose this week to 203.1K. That 17K increase from last week is right in line with seasonal patterns. The NSA number also came in well below the average for the current week of the year since 2000, 338.8K, and as the lowest reading for the week of the current cycle.

U.S.-China Trade Deal Isn’t Imminent, Envoy Says The U.S. and China have yet to set a date for a summit to resolve their trade dispute, the U.S. ambassador to China said, as neither side feels an agreement is imminent.
Mr. Branstad said negotiators need to further narrow the gap in their positions, including on enforcement of an eventual deal, before summit arrangements are made.
“Both sides agree that there has to be significant progress, meaning a feeling that they’re very close before that happens,” Mr. Branstad said in his office at the U.S. embassy in Beijing. “We’re not there yet. But we’re closer than we’ve been for a very long time.” (…)
Speaking on Fox News on Tuesday, White House economic adviser Larry Kudlow said “there is hope that perhaps by the end of this month or early April the two leaders will get together and finalize an agreement.” He then said: “Don’t hold me to that because it’s not written in cement yet.”
For a summit, the Chinese side wants more of a signing ceremony than a final negotiation, fearing Mr. Trump could make last-minute demands, said the people familiar with the leadership’s thinking. Mr. Branstad suggested U.S. officials want some leeway at the summit. (…)
“It has been a long and difficult process,” the U.S. ambassador said of the negotiations. More positively, he said: “Considerable progress has been made. So I’m more hopeful now than I’ve been throughout the last year that we can see an effective agreement reached.” (…)
In the interview, Mr. Branstad sought to play down expectations the Communist Party would agree to significant changes in China’s industrial policy as part of the trade deal. “We’ve got to be realistic that this is a one-party authoritarian system. We don’t’ see that changing.” (…)
Chinese Exports Plunge Amid Slowdown
Exports tumbled 20.7% from a year earlier in February, after jumping 9.1% in January, according to data from the General Administration of Customs released Friday. The disappointing trade data reflect weaker global demand and distortions from the Lunar New Year holiday, said economists, who were expecting a far smaller drop for February.
Economists tend to look at the combined data for the first two months to better gauge trade at the start of the year. Customs data showed exports were down 4.6% for the January-February period [similar to December’s pace of 4.4%]. (…)
The country’s exports to the U.S. fell 26.2% last month, while imports from the U.S. dropped 28.6%, leading to a bilateral trade surplus of $14.72 billion, a two-year low. (…)
In a sign of worsening domestic demand, imports fell 5.2%, extending January’s 1.5% drop. Imports fell 3.1% over the first two months. (…)
Chinese officials, however, appeared to attribute February’s bad showing to holiday distortions. Stripping out the Lunar New Year effects, the customs said February’s exports and imports rose 1.5% and 6.5%, respectively, from a year earlier. (…)
 (zerohedge.com)
Elsewhere in the WSJ:
January-February exports in yuan terms were up 7.5% on the year, significantly slower than double-digit growth rates in mid-2018. But the trade conflict with the U.S. is now really starting to bite. January-February exports to the U.S. fell 9.9% in yuan terms. Exports to Southeast Asia, however, rose 7%—implying some rearrangement of supply chains to avoid U.S. tariffs, suggests ANZ.
From Markit’s March China PMI:
The trend in exports meanwhile deteriorated midway through the first quarter of 2019. Overall, foreign sales declined marginally, driven by a renewed fall at manufacturing companies. At the same time, new export order growth eased to a five-month low at services companies.
Although the gauge for new export business returned to contractionary territory, the one for overall new orders remained in expansionary territory and rebounded marginally, reflecting a recovery in domestic demand — especially for manufacturing.
Regarding China’s domestic demand:
The Caixin PMI surveys showed service sector growth cooling to one of the weakest seen in the near 14-year history of the survey though manufacturing stabilized after suffering the first fall in output for two-and-a-half years at the start of the year.
Slow Growth Prods Central Banks The European Central Bank made a U-turn with new plans to stimulate the eurozone’s faltering economy, while Federal Reserve officials signaled increasing reluctance to raise U.S. interest rates at all, as evidence mounts of a slowing global economy.
The ECB, acting less than three months after it phased out a €2.6 trillion ($2.9 trillion) bond-buying program, said it would hold interest rates at their current levels at least through the end of this year—months longer than it previously signaled. It also will issue a fresh batch of cheap long-term loans for banks starting in September. (…)
ECB President Mario Draghi said Thursday the likelihood of a recession is very low, but risks to the economy remain prevalent. The ECB’s decision was unanimous, he said. “We never thought we were behind the curve,” Mr. Draghi said, and “in any event today we are not behind the curve, for sure.” (…)
Still, the ECB refrained from more extreme measures such as restarting its bond-buying program or cutting its deposit rate further from minus 0.4%. These options weren’t discussed, Mr. Draghi said.
“In a dark room, you move with tiny steps,” he said.
U.S. Productivity Growth Is Solid
Output per hour in the nonfarm business sector grew 1.9% (SAAR) in Q4’18, an increase fairly stable with the Q3 gain. During the last four quarters, productivity growth picked up to 1.8%, the quickest rate of increase in three years. The latest increase reflected a 3.1% rise (3.7% y/y) in real output and a 1.2% increase (1.9% y/y) in hours worked.
The gain in productivity was accompanied by a 2.0% increase in unit labor costs. It followed a 1.6% rise in Q3. The 1.0% gain for the full year compared to a 2.2% increase during 2017. Compensation growth remained solid at 3.9% (2.8% y/y) after a 3.5% rise.
In the manufacturing sector, productivity increased 2.0% (1.0% y/y), the quickest rate of growth in four quarters. It reflected a 2.7% rise (2.9% y/y) in real output accompanied by a 0.8% gain (1.9% y/y) in hours worked.
Unit labor costs in the factory sector increased 2.2% (0.8% y/y), following a 1.8% gain. The y/y rise compared to a 5.0% peak in early 2015. Compensation per hour strengthened 4.3% (1.8% y/y), the strongest increase since Q1’18.

Chinese stocks tumble 4% as ECB and China exports spur growth concerns
The JP Morgan Global PMI signalled the first acceleration of growth for three months in February although global growth remains relatively weak.
The PMI exhibits a strong correlation with global GDP and, at these levels, historical comparisons suggest the global economy could struggle to expand at a rate in excess of 2.0% in the first quarter (measured at market prices), down from an estimated 2.3% in the fourth quarter and a peak of 2.9% at the end of 2017. (…)
The slowdown was led by a further near-stagnation of manufacturing output, the marginal increase of which was the weakest seen since June 2016. The manufacturing sector’s malaise was in turn largely attributable to a further downturn in global trade, with worldwide exports falling for a sixth straight month, dropping at the steepest rate since May 2016. Some 13 of the 30 countries surveyed by IHS Markit now have manufacturing PMIs below the 50 ‘no change’ level, up from just two this time last year.
In contrast, service sector growth perked up to a three-month high, offsetting the manufacturing slowdown. The upturn was buoyed by faster inflows of new business, suggesting domestic market demand remains encouragingly robust in many key economies.


EARNINGS WATCH
We have 493 reports in, a 69% beat rate, a +3.3% surprise factor and 16.7% growth in Q4’18 earnings, up from 15.8% estimated on Jan. 1.
Trailing EPS are now $162.86, 0.7% above the $161.66 estimate for the full year 2018.
Corporate pre-announcements worsened as the earnings season advanced:
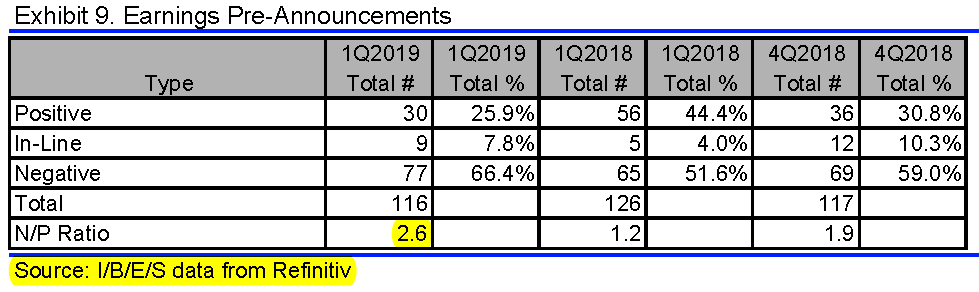
Analysts now see Q1’19 earnings declining 1.3% (-0.6% ex-Energy) but see positive growth returning in Q2 (+3.2%), Q3 (+2.9%) and Q4 (+9.3% thanks to a 20.3% jump in Financials’ earnings). Full year 2019 are expected to reach $167.94.
Stock-Market Volatility Takes a Bite Out of U.S. Households’ Net Worth After increasing in the first three quarters of 2018, household net worth fell by $3.73 trillion in the fourth quarter
Household net worth—the value of all assets such as stocks and real estate minus liabilities like mortgages and credit-card debt—declined by 3.5%, or $3.730 trillion, from the third quarter, to $104.329 trillion, according to data the Federal Reserve released Thursday.
The 3.5% decline was the largest quarterly drop in household net worth since the final quarter of 2008. (…)
The fourth-quarter decline came after household net worth had increased in the first three quarters of 2018. U.S. households ended 2018 in the black, but only just. In the year to that quarter, household net worth rose 0.8%.
The main reason for the drop in wealth in the final three months of last year was a rout in stock markets. After rising 9% through the first three quarters of the year, the S&P 500 gave up all of those gains and ended the year down 6.2%, its weakest performance since 2008. Stocks have largely recovered in early 2019.
Household wealth in the stock market decreased by about $4.57 trillion in the quarter, according to the Fed report.
The report said households’ net worth fell to 660% of their disposable personal income in the fourth quarter from a third-quarter level of 693%. That puts the level close to its earlier prerecession peak in 2006. (…)
The value of real estate increased by about $279.4 billion in the fourth quarter. That advance was larger than the $156.6 billion gain in the third quarter but smaller than the $485.7 billion in the second. (…)
Does its matter much? This is the YoY % change:
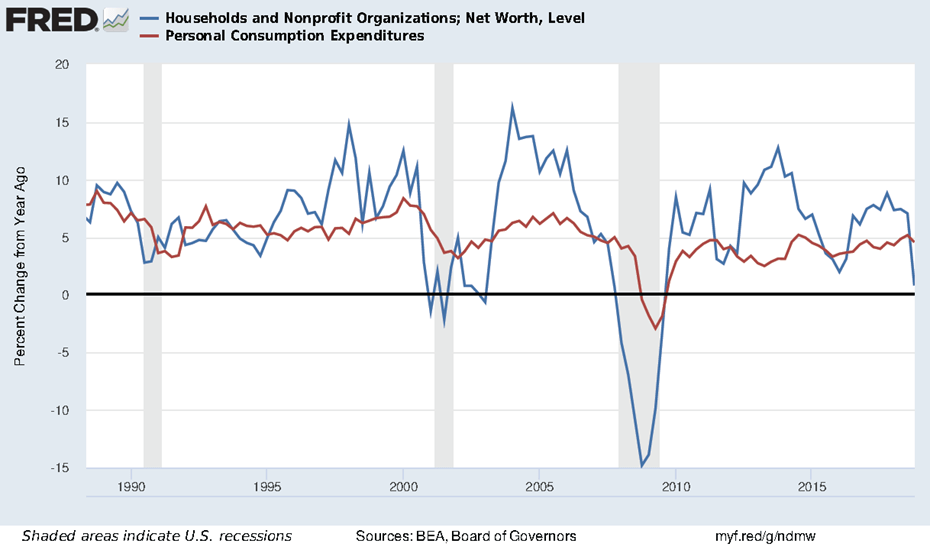
Stephanie Pomboy (@spomboy) plots the YoY dollar change with a 2Q lead…

…although the picture might change after Q1’19…if equities hold…
China Narrows GDP Gap With U.S. The Asian nation’s share of the global economy is creeping closer to its western rival’s

 Bloomberg uses China’s official data. The Brookings Institute disputes the data:
A forensic examination of China’s national accounts
China’s national accounts are based on data collected by local governments. However, since local governments are rewarded for meeting growth and investment targets, they have an incentive to skew local statistics. China’s National Bureau of Statistics (NBS) adjusts the data provided by local governments to calculate GDP at the national level. The adjustments made by the NBS average 5% of GDP since the mid-2000s. On the production side, the discrepancy between local and aggregate GDP is entirely driven by the gap between local and national estimates of industrial output. On the expenditure side, the gap is in investment.
Local statistics increasingly misrepresent the true numbers after 2008, but there was no corresponding change in the adjustment made by the NBS. Using publicly available data, we provide revised estimates of local and national GDP by re-estimating output of industrial, construction, wholesale and retail firms using data on value-added taxes. We also use several local economic indicators that are less likely to be manipulated by local governments to estimate local and aggregate GDP. The estimates also suggest that the adjustments by the NBS were insufficient after 2008.
Relative to the official numbers, we estimate that GDP growth from 2008-2016 is 1.7 percentage points lower and the investment and savings rate in 2016 is 7 percentage points lower.

But the level of debt is accurate:
Grant’s adds that “the ratio of total banking assets to reported GDP stood at 297% in 2018. Under the Brookings-tabulated GDP methodology, that ratio expands to 374%. By comparison, U.S. banking assets stood at $17.9 trillion at year-end, or 86% of GDP. Hmmm…