USD Inflation Preview: Higher but fading momentum
Our calculations suggest that headline and core inflation will print at 7.4% y/y and 5.9% y/y, respectively. The consumption patterns of American households is slowly but surely set to converge towards its pre-pandemic normal, which should alleviate price pressure for goods. Yet, last year’s joker – the used cars and vehicles component – rose again in January and lifts US inflation to new cycle-highs.
For the January print we expect the used car inflation component to have risen by approximately 40% y/y. Furthermore, changes to CPI basket weights were updated 8 February and show an increase in the weights of used cars and shelter costs and hence towards the prices that are rising the most and, in turn, skewing the risk to the upside and underscoring the larger uncertainty for Thursday’s release.
Looking into monthly changes, our preferred leading indicator for used vehicles prices – the Manheim Index – points to a moderation in car prices over the coming months. The monthly changes in the Manheim index have been sliding since October. In January, this index only showed an increase of 0.04% m/m substantially lower than the last monthly peak of 9.2% m/m in October. The closely related wholesales car price index also points to moderation. Nonetheless, slowing car prices increases is first likely to be a determining factor in some months’ time if the used cars inflation continues to follow the Manheim index with a small lag.
(…) the million dollar question for 2022 remains whether wage growth will persist as base effects start to kick in. While the employment headline was stellar it masks underlying slowing. Aggregate production hours are down and so are weekly hourly earnings deflated by CPI. The story was similar for the 6.9% annualized Q4 GDP – inventory growth contributed with more than 2/3 of the total growth as consumption slowed. (…)
Chipotle CEO Says Another Menu-Price Increase Likely The burrito chain said it raised prices again, a moved that helped boost sales in recent months, and is likely to increase them further as it looks to build hundreds more stores this year.
(…) It raised prices by 4% in December, with menu prices now up around 10% overall compared with last year, the company said. Chipotle’s same-stores sales were up 15.2% for the period compared with last year. (…)
“I just don’t see the inflation, unfortunately, going away anytime soon,” said Mr. Niccol. He said he’s “chuckled” about comments made earlier in the pandemic about cost increases being short-term: “It sure doesn’t look transitory to me.”
Starbucks Corp. , McDonald’s Corp. and many other chains said they have increased prices as costs have grown and expect inflation to continue to be a concern this year.
Chipotle raised prices on its meals last year, saying it was particularly to help cover the cost of wage increases for hourly workers. [Somebody please forward this the Jerome Powell]. (…)
The company said Tuesday that the Omicron variant of Covid-19 began to weigh on its sales growth in December and last month. (…)
Canadian banks increased their pay per worker 6.3% in fiscal 2021, more than twice the average boost in the previous three years, as inflation and competition make it costlier to attract and retain employees.
The gain was driven in large part by last year’s 18% increase in bonuses as financial firms rewarded investment bankers and traders who had posted two straight years of strong results. With those workers in especially high demand, banks are opening their wallets to keep top talent from jumping to rival firms. (…)
Royal Bank of Canada CEO David McKay said earlier this month the battle for tech talent was among his top concerns for the year, and that banks have never faced more competition for workers in engineering, artificial intelligence, data, mathematics and coding. (…)
- Apple Ups Benefits for Retail Workers in Tightening Labor Market Apple Inc. plans to significantly increase its benefits for U.S. retail store workers as it grapples with a tightening labor market and the ongoing Covid-19 pandemic
- Peloton’s Famous Instructors, Who Can Make Upwards of $500,000 a Year, Escape Layoffs
Toyota Cuts Production Target Due to Chip Shortages but Keeps Profit Outlook
-
Bosch CEO expects chip shortage to ease significantly in second half Bosch CEO Stefan Hartung expects the chip shortage to lessen significantly in the second half of this year, he said at a press conference on Thursday, adding he hoped businesses could operate as normal by 2023.
- Maersk expects supply chain problems to ease this year Revenues at container shipping group rose 55% last year
U.S. Households Took On $1 Trillion in New Debt in 2021 The increase, the largest since 2007, was largely the result of a big jump in mortgages and auto loans.
Total household debt rose by $1.02 trillion last year, boosted by higher balances on home and auto loans, the Federal Reserve Bank of New York said Tuesday. It was the largest increase since a $1.06 trillion jump in 2007. Total consumer debt now sits at around $15.6 trillion, compared with $14.6 trillion a year earlier.
The increase is largely a function of a sharp rise in prices for homes and cars. (…)
Delinquency levels on consumer loans are still hovering around record lows.
What’s more, some 87% of the new debt is tied to homes that can appreciate over time, allowing borrowers to build wealth. Today’s home buyers also are in better financial shape. Subprime borrowers accounted for just 2% of the mortgage debt originated in the fourth quarter of 2021, down from an average of 12% in the years before the financial crisis.
Americans added $52 billion to their credit-card balances in the fourth quarter, the largest quarterly jump on record, the New York Fed said in its quarterly report on household debt and credit, which is based on data from Equifax Inc. credit reports. Pent-up demand for travel and entertainment purchases that consumers were unable or willing to make earlier in the pandemic boosted credit-card balances in the final three months of the year. (…)
EARNINGS WATCH
We now have 298 reports in, a 78% beat rate and a +5.2% surprise factor.
Trailing EPS are now $208.63, forward: $224.98.
So far this week, 7 companies offered guidance, 2 up, 4 down:

Rosenberg Research’s own tally reveals that of 41 sales guidance for Q1, 32% were weaker and 68% unchanged. None increased.
Q4 2021 Retail Preview: Supply Chain Problems Continue
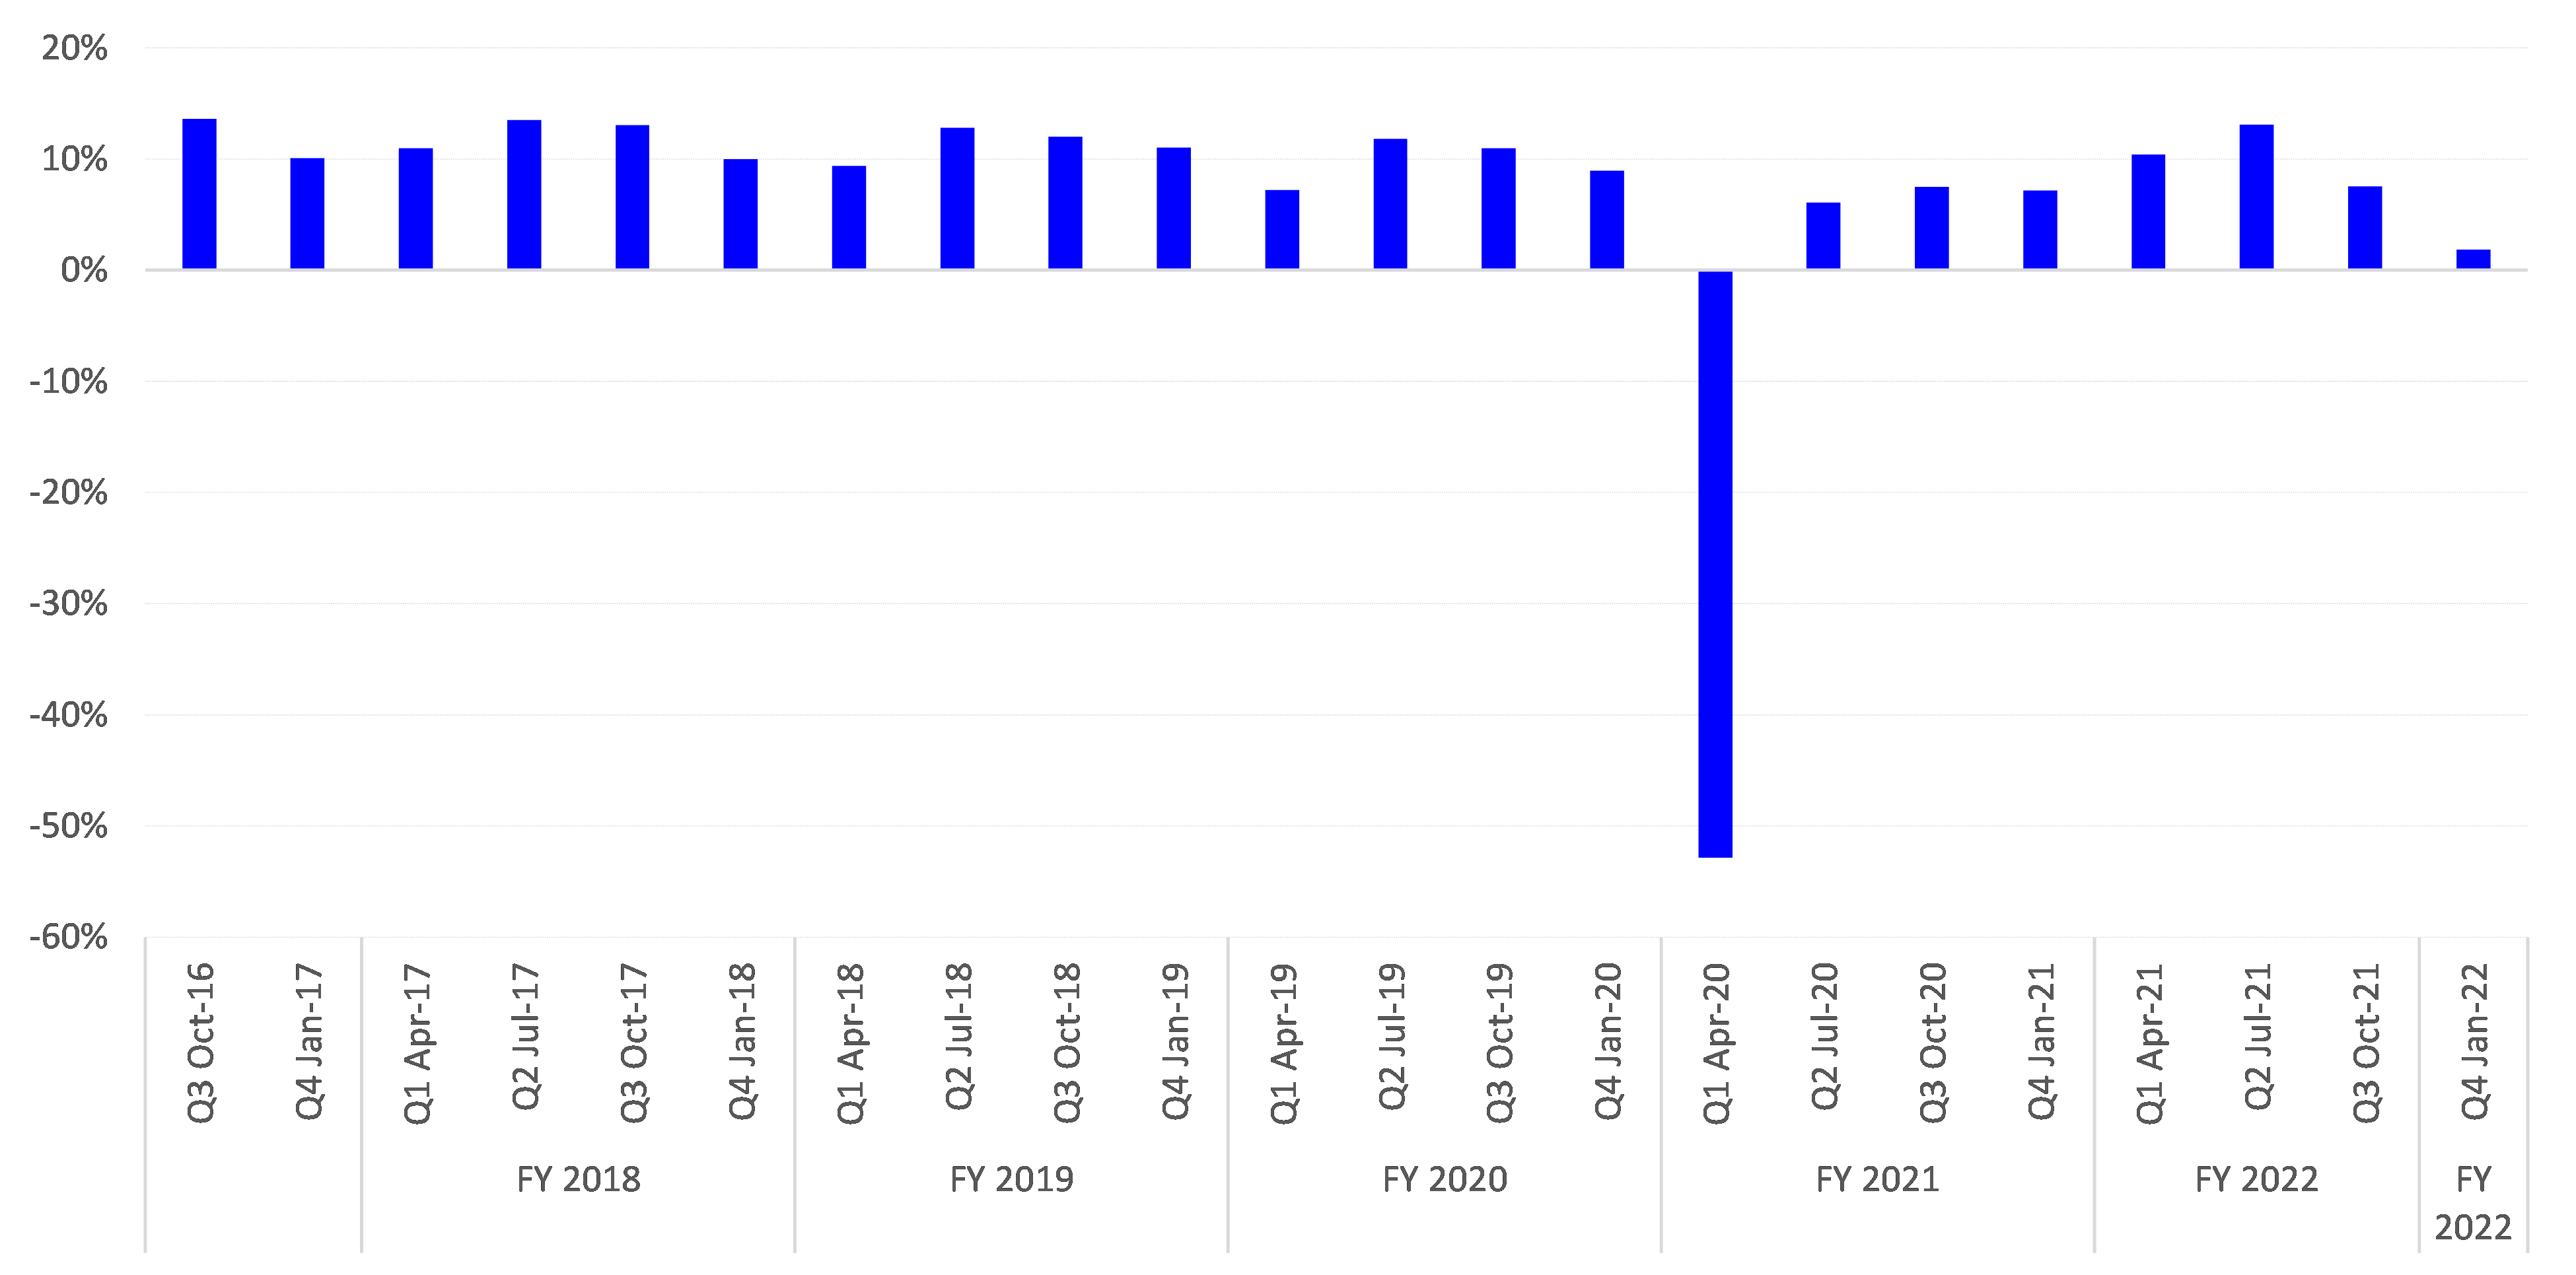
In its last earning call, Gap said it incurred approximately $450 million in airfreight costs to meet customer demand. The retailer had to deliver by air approximately 35% of its holiday product due to delays from its Vietnam manufacturing closures in Q3 and the West Coast port delays (Source: Gap Q3 2021 Earnings Call).
Although these costs are deemed necessary to move inventory, they inflict a huge hit on a retailer’s profitability. Gap reported a 7.6% EBITDA margin in Q3 2021. However, this is expected to drop to 1.8% in Q4 2021, according to Refinitiv I/B/E/S estimates. This would mark its lowest EBITDA margin since the first quarter of 2020.
Gap EBITDA Margin
Source: I/B/E/S data from Refinitiv
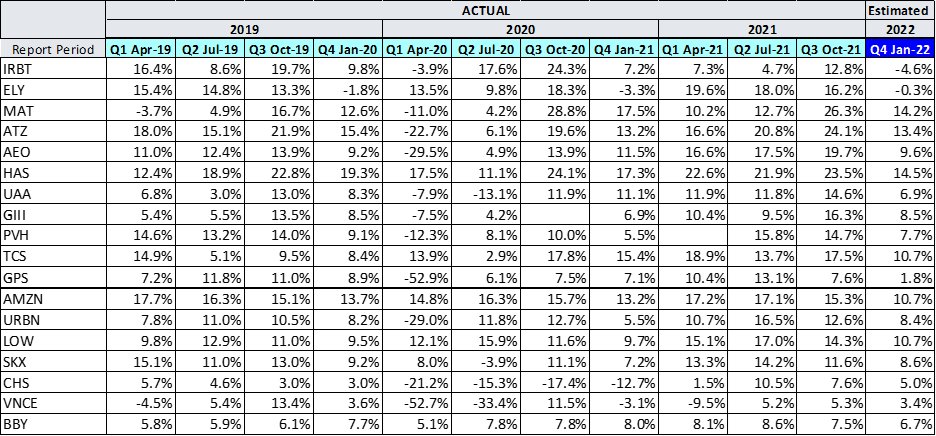
Similarly, Refinitiv data shows that supply issues continue to hit the companies below and are also expected to see a decline in EBITDA in the current quarter. (…)
Decline in EBITDA Margins
Source: I/B/E/S data from Refinitiv
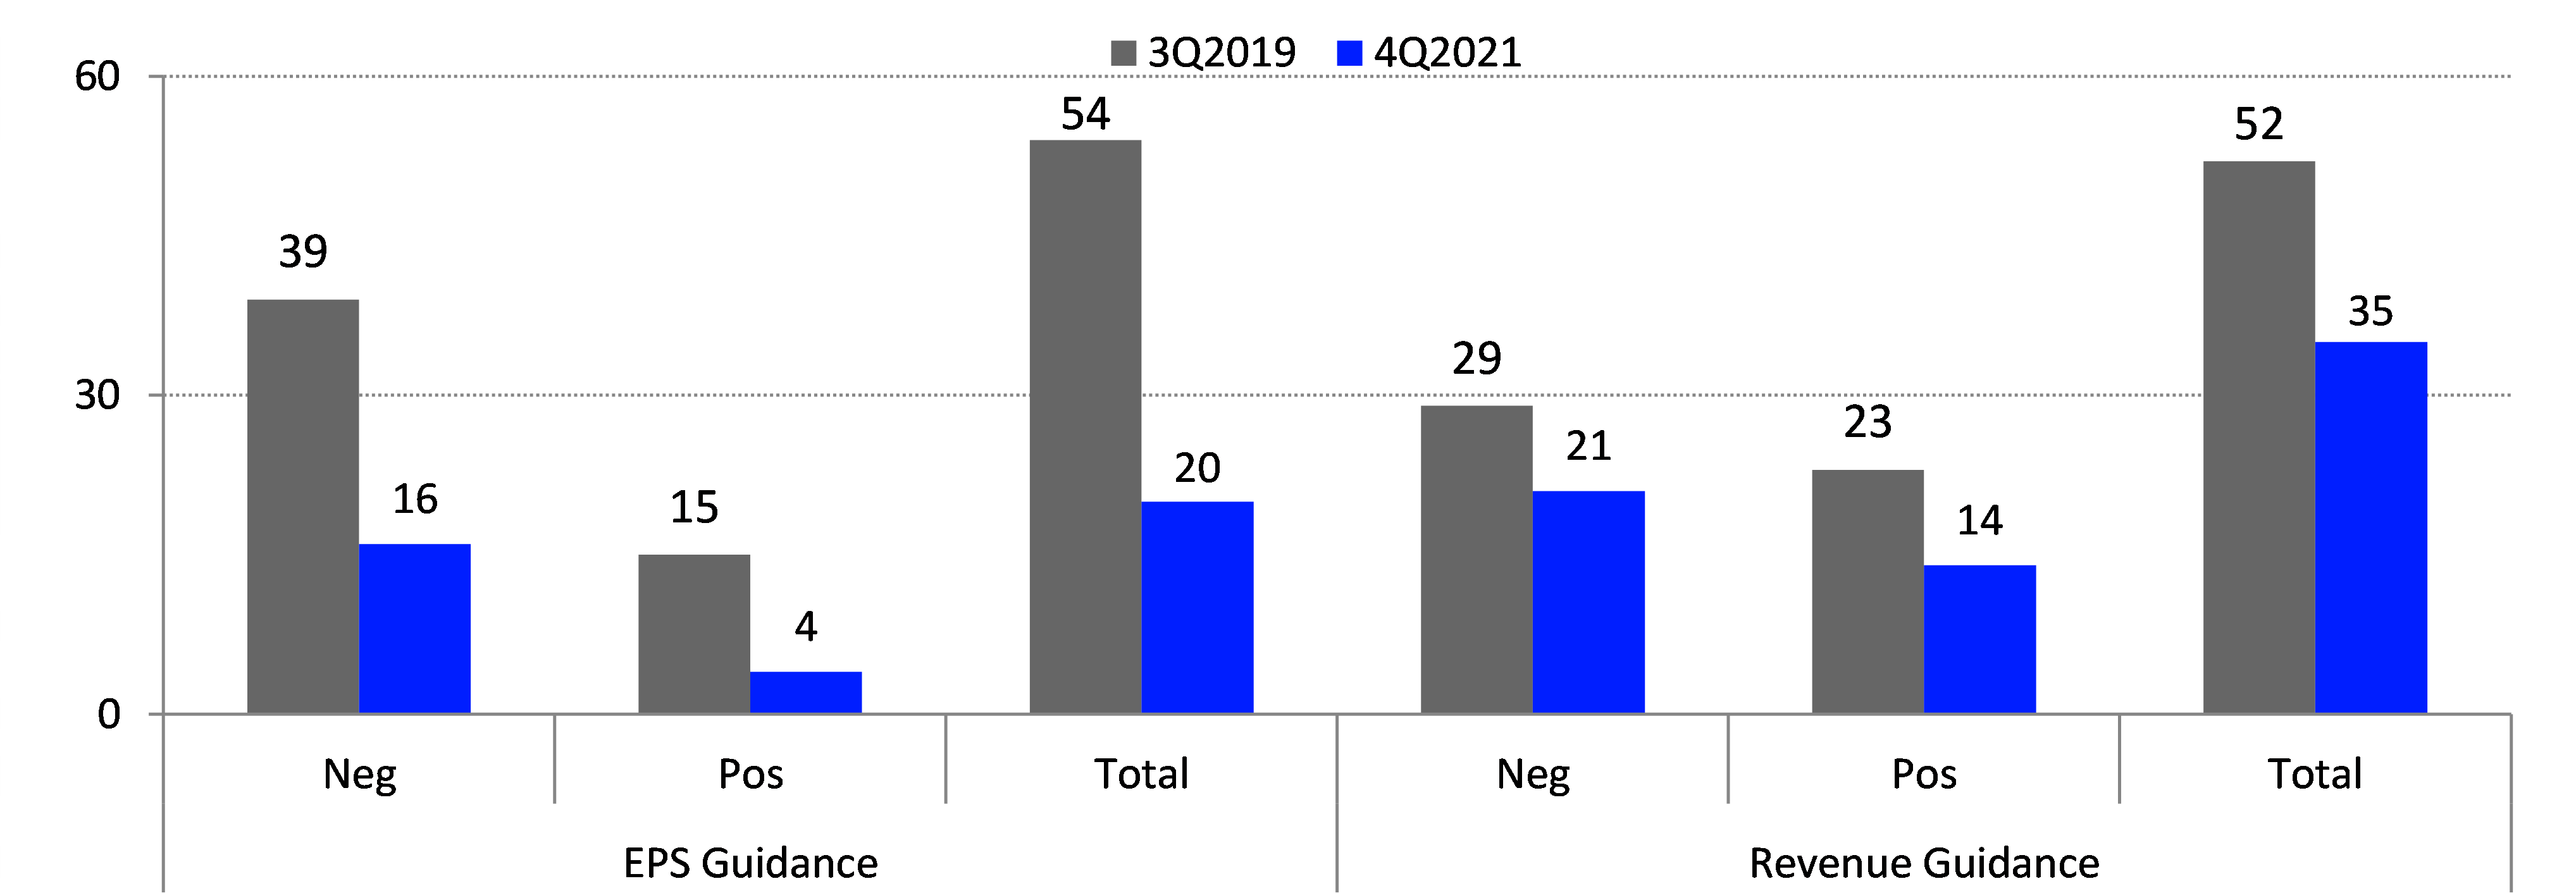
In addition to the 16 Q12022 negative preannouncements and four positive for EPS, retailers posted 21 negative and fourteen positive revenue forecasts. The bulk of the Q1 2022 negative guidance (43.8%) comes from the household durables sector.
Q4 Earnings and Revenue Guidance
Source: I/B/E/S data from Refinitiv
A look at ‘FAANMG’ Stocks vs. S&P 500: Margins, Valuation, Earnings
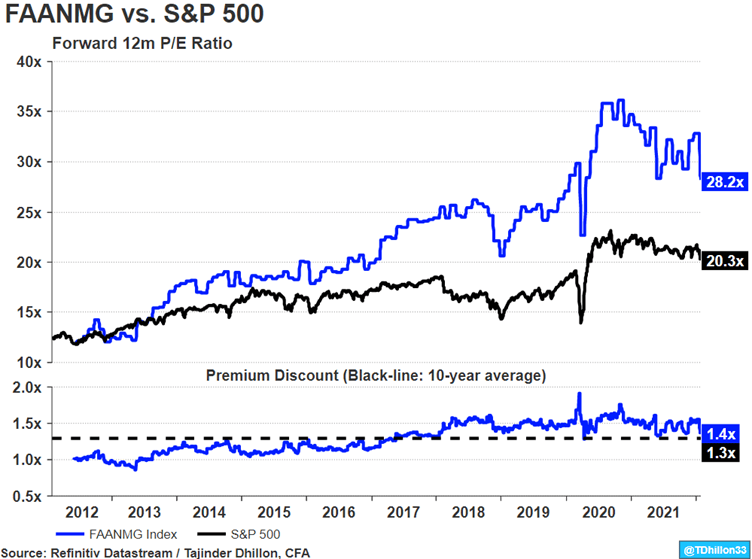
(…) Year-to-date, the FAANMG index declined 9.7% on a cap-weighted basis vs. a decline of 6.5% for the S&P 500. On an equal-weight basis, the FAANMG index declined 14.0% vs. a decline of 4.4% for the S&P 500 equal-weighted index. (…)
With the January sell-off, the forward 12-month P/E ratio for the FAANMG Index declined almost five turns from 32.8x to 28.2x. This compares to a forward P/E of 20.3x for the S&P 500, marking a 38.9% premium which is slightly above the historical 10-year average premium of 29.2%. (…)
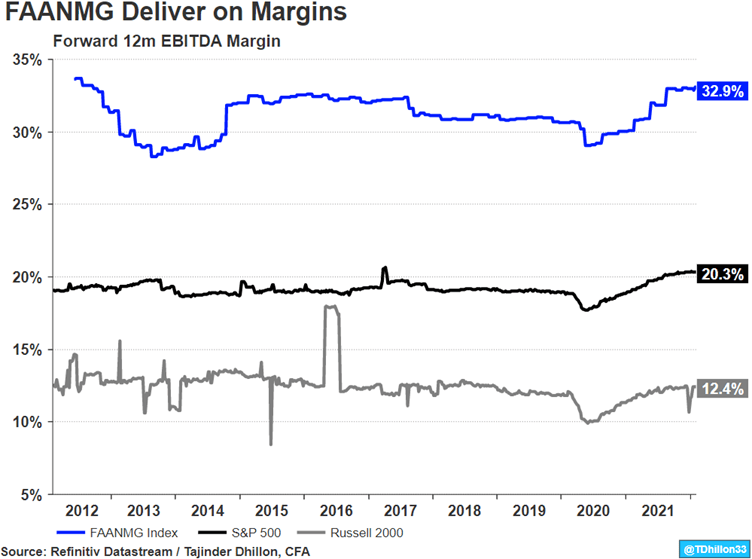
FAANMG stocks continue to deliver robust top-line growth and strong margins. Exhibit 3 shows how strong EBITDA margins are for the FAANMG index, which currently reads 33.0%, dwarfing the average EBITDA margin of 20.3% for the S&P 500 and 12.4% for the Russell 2000 Index. (…)
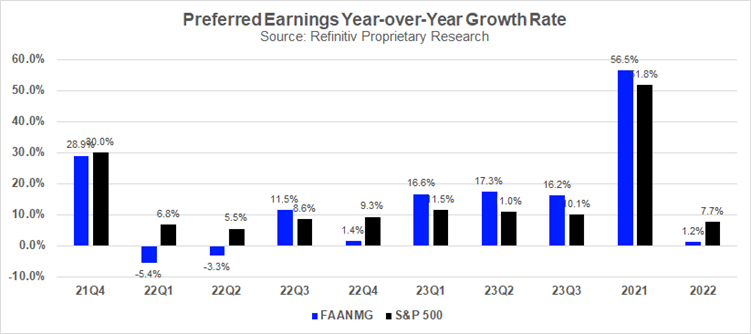
2022 looks to be a tough year for FAANMG from an earnings growth perspective, mainly due to difficult year-over-year comparisons. It is currently expected to deliver weaker earnings growth compared to the S&P 500 in three of the four quarters (22Q1, 22Q2, and 22Q4). Looking at FY2022 growth rates, S&P 500 is expected to deliver earnings growth of 7.7% compared to 1.2% for FAANMG on an aggregated basis. (…)
Earnings Growth for FAANMG and S&P 500
TECHNICALS WATCH
More tech stocks try to make longer-term recoveries
(…) While the Nasdaq is considered a tech index, that’s not entirely accurate. Even so, there has been a recovery in long-term trends, specifically among Technology stocks. After fewer than 25% of Technology sector stocks were trading above their 200-day moving averages, enough recovered so that most of them were above their averages. (…)
It’s generally better for Tech stocks if we see a thrust with more than 60% of them trading above their 200-day averages. So far, it’s been hovering below 60%, which is what an unhealthy market does. We can see from the chart above that the total return on Technology stocks since 1952 was only 7.7% when the percentage of members was neutral, between 40% – 60%.
When it was below 40%, we got the opportunity to enjoy oversold snapbacks. When it was above 60%, the zone where the stocks saw their best annualized returns, it coincided with periods of positive momentum. We have neither right now. (…)
The selling pressure this year, especially in stocks that inhabit the Nasdaq exchange, including Technology stocks, has been extreme. We’ve now seen a modest recovery, suggesting the worst could be over. But it’s not a strong signal. We haven’t seen an opposing reaction, a multi-day move with an overwhelming amount of buying interest. So far, it looks like an oversold relief rally, and while returns after similar moves were positive, it would be better if we see more of a surge in interest among buyers.

The Case Against a Bear Market, Per Ned Davis Stocks have had a rotten start this year, but they won’t get too much worse, the research firm says.
(…) “The January market decline is thus better described as a stiff rotational correction than the start of a new bear market,” wrote Tim Hayes, the firm’s chief global investment strategist.
He noted that not all countries’ equities are doing this poorly. “If a cyclical bear was getting started, we would not expect such bifurcated performance,” Hayes said. “Typically, in a developing bear, worries about a deteriorating macro environment spread globally, sending markets downward in sync.”
He’s got a point: Britain, Singapore, and Hong Kong are all positive. And the MSCI All World Index ex-USA is off 4.9%, a much better showing than the US’s market. Among MSCI indexes, 17 are ahead this year, and 14 of them are in emerging markets (EMs), the report indicated. Examples: Nigeria, up 8.5% for 2022, and Brazil, ahead 7.4%.
Ned Davis’ in-house indicators don’t show that the market will descend to a bearish level. “Oversold with pessimism extreme, the major equity benchmarks have been testing Monday’s intraday lows this [past] week, apparently building a base to be followed by renewed rallying,” Hayes declared. “The global bull market uptrend remains intact.”
To bolster his correction-only thesis, Hayes argued that what has happened to once-dominant tech stocks underscores that the sector’s prices were simply too lofty to be sustained. And don’t betoken a pan-market dive.
“In bailing out of technology, investors have sold the sector that’s been the most overvalued and most prone to underperform when bond yields are rising,” he wrote.
Certainly, the Nasdaq 100, home to the tech leaders such as Apple and Microsoft, is in correction turf, down almost 13% from its November high, much lower than the S&P 500.
“And that makes it likely that the bad news has been priced in and that a bottoming process is under way,” Hayes contended. “The indicator mix is currently more consistent with the end of a correction than the onset of a new bear.”
How much the Federal Reserve will boost interest rates, which could crimp stocks, is a matter of much debate and trepidation. Hayes conceded that rates could mess things up and “could lead to warnings.” Some indicators that Ned Davis watches might then take a bad turn, he said.
But the chief gauge of market unrest, the CBOE Volatility Index or VIX, has yet to reach “the level that would add a bearish signal to the report.”
Note: Yes, the MSCI All World Index ex-USA did better than the US’s market in January but that was after dropping 6.1% in the second half of 2021. Nigeria? Brazil? Down 30% and 33% respectively during 2021. And both up last month on commodity rallies.


 WILL YOU MARRY ME? PLEASE! PLEASE!
Goldman Sachs says that “more than 500 active SPACs with $144 billion in equity capital are currently searching for a target. 88 active SPACs are set to expire this year and 318 are set to expire in 1H 2023, presenting the possibility of a logjam of deal closures. The median active SPAC is 13 months away from expiration. (…)
238 SPACs completed an acquisition in 2021, by far the largest year ever. The median de-SPAC in our universe has declined by 43% during the last 6 months, in line with the longest duration or unprofitable stocks. The typical de-SPAC has had its EV/Sales nearly cut in half since the start of 4Q 2021 (from 2.8x to 1.5x EV/Sales). (…)
Only 19% of de-SPACs were profitable over the last 12 months and consensus expects just 28% will be profitable in the coming year. (…)
Many of these de-SPACs are likely to undergo significant share offerings relative to their float caps in the coming years as management teams, the SPAC sponsors, and existing holders have their first opportunities to sell down. Since the start of 2020, de-SPACs in our universe have typically returned -10% and -22% in the one and six months after a follow-on equity offering. (…)
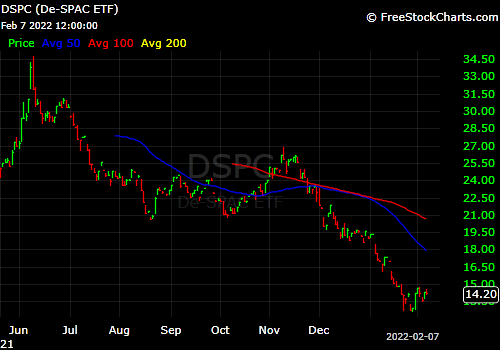
A bunch of horny and well-endowed grooms “Desperately Seeking Susan” within a very short time window. Many embellished Susans will jump to the occasion and write their own prenup. Dangerous liaisons, getting more and more dangerous as we approach expiry dates…
Spac, crackle…and pop!
There Are Now 1,000 Unicorn Startups Worth $1 Billion or More Almost a decade after the term “unicorn” was coined to describe a rare breed of private company, about two new companies are joining the herd daily.
(…) In January, 42 startups became unicorns and four became “decacorns”—the clumsy nickname given to startups worth $10 billion or more. “When you have 1,000 unicorns,” says Brian Lee, who oversees research at CB Insights, “that’s almost an oxymoron.” (…)
Even in the face of volatile public markets, inflation, and rising interest rates, the mood among private market investors appears to be as ebullient as ever. Some of that undaunted growth is valid, says Lee: As more of the world’s services become digital, software companies become more valuable, and infrastructure such as Amazon Web Services makes it easier than ever to start a tech business. (…)
There’s a shocking amount of investment money looking for a home—$621 billion into startups of all kinds in 2021. That’s more than double the 2020 amount and exceeds the capital raised through IPOs over the same period, which itself was a record. Low interest rates and record-breaking paydays when private companies finally go public or get acquired have caught the hungry eyes of investors who have traditionally focused on public markets. (…)
FYI
