If you own these 6 MAGNAFicient horses, MSFT, AAPL, GOOG, NFLX, AMZN, FB (or MAGNAF), you will surely boast about your returns this summer while serving porterhouse steaks with a nice Six Horse Zinfandel. Some jealous guest might warn you of the portfolio risk you are taking and suggest you switch to the more appropriate Wild Horse Cabernet-Sauvignon.
Not at all! you might reply with your most confident smile, the whole market is on fire. Another year like that and you will be pouring Burgundy wines from Christophe Chevaux or, who knows how wild you’ll be able to get, even a Chateau Cheval Blanc.
You will add that the whole NASDAQ 100 is up 17% YtD and that even the more mundane S&P 500 Index is up 7.4% this year.
And why not display your wit with your best horse smile and trot along with the notion that this is truly a new era: from now on, years will begin November 9. Since the beginning of Trump 1 year, the S&P is +12.6% and the NDX +19.3%. The proof is in the pudding, the bull is strong and running but your six-horse hitch is galloping freely ahead.
Your clearly envious guest will surely balk right there and maybe you should unsaddle and listen a little:
-
65% of Nasdaq’s gain this year is courtesy of your 6 MAGNAFicient stocks.
-
They also account for 40% of the S&P 500 advance this year, and 65% of its 17% growth since 2015.
-
The remaining 494 stocks are up 6% in total over 2.5 years, less than 2.5% per year on average.
-
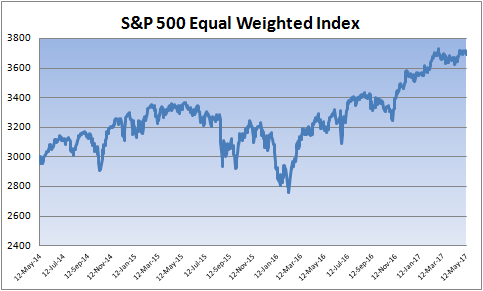
The S&P 500 Equal Weight Index is up 13.4% since 2015 but 85% of that gain occurred during Trump 1.
-
The equal weighted index peaked March 1, 2017 going more or less sideways since.
Without these 6 stocks, U.S. equities would be way, way down the list of summer discussion topics, if at all.
Given their pulling capability way beyond their 13% collective weight in the S&P 500 Index, let’s look at each of these six horses in more detail to assess their ability to go the distance (charts courtesy of CPMS/Morningstar; all prices and data as of May 11):
MICROSOFT
- Operating EPS and CFS growth flattened 2011 and 2015 but reaccelerated in the last 12 months.

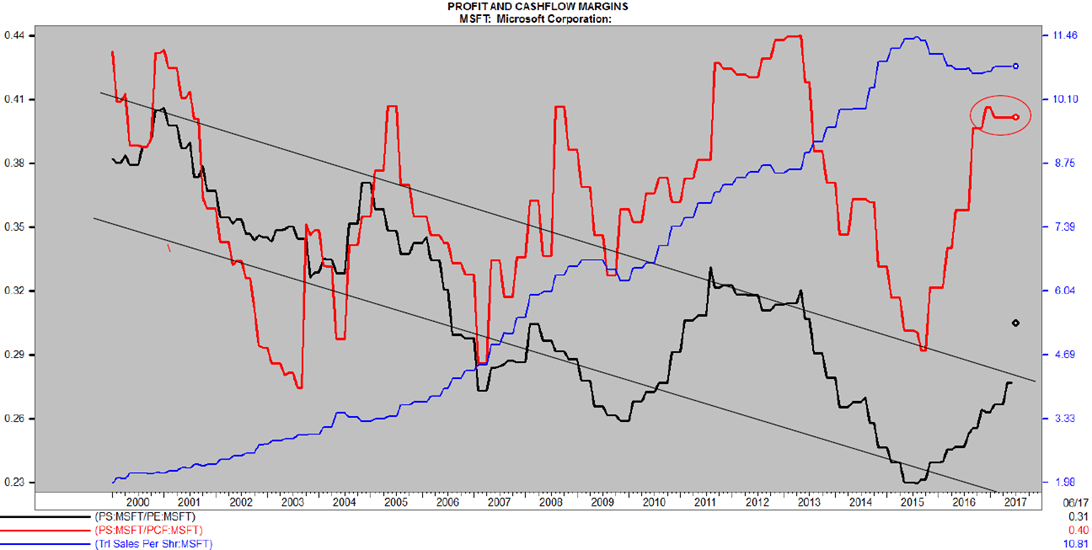
- Why? Not because sales growth reaccelerated (blue line below), rather because margins turned back up. CF margins (red) are back to the top of their historically stable range but net margins are not. Note that the consensus expects net margins to rise above this LT range (dot), but CF margins have been flat in the last 2 quarters…
- ROE and ROTA (return on assets) have been on a steep downtrend since 2009. ROE turned back up in 2015, without support from ROTA…

- MSFT’s book value/share has declined 20% since 2014, mainly because of asset impairment charges related to Microsoft phone business (remember NOKIA?). ROTA kept slowing, in part because of the huge buildup in cash which doubled since 2012 and now accounts for 50% of Microsoft assets while returning practically nothing.
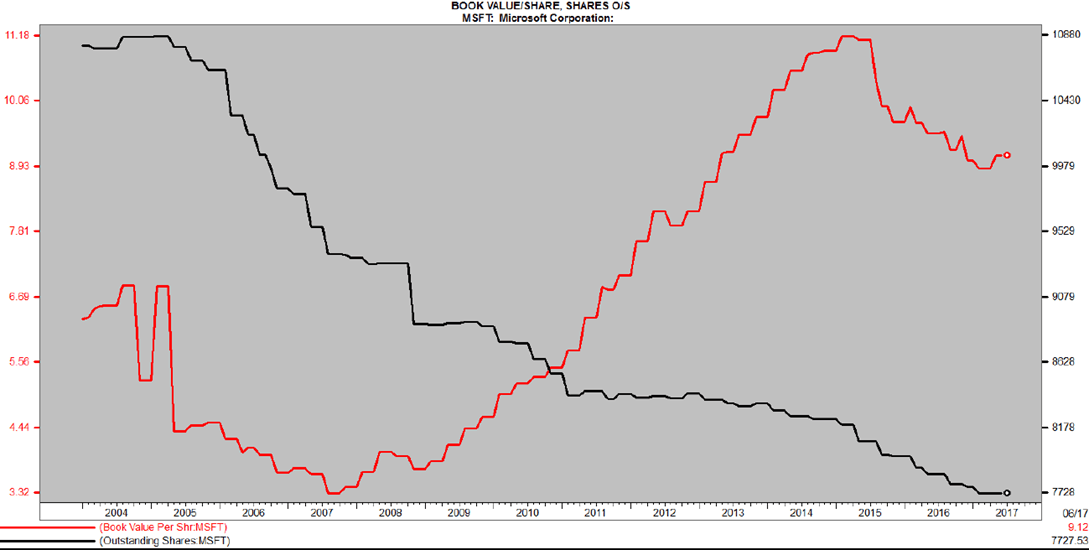
- Microsoft growth is clearly slowing and management has yet to demonstrate it can improve margins beyond their recent cyclical highs AND smartly reinvest its huge cash trove other than thru repurchasing its own shares at 7 times book value.
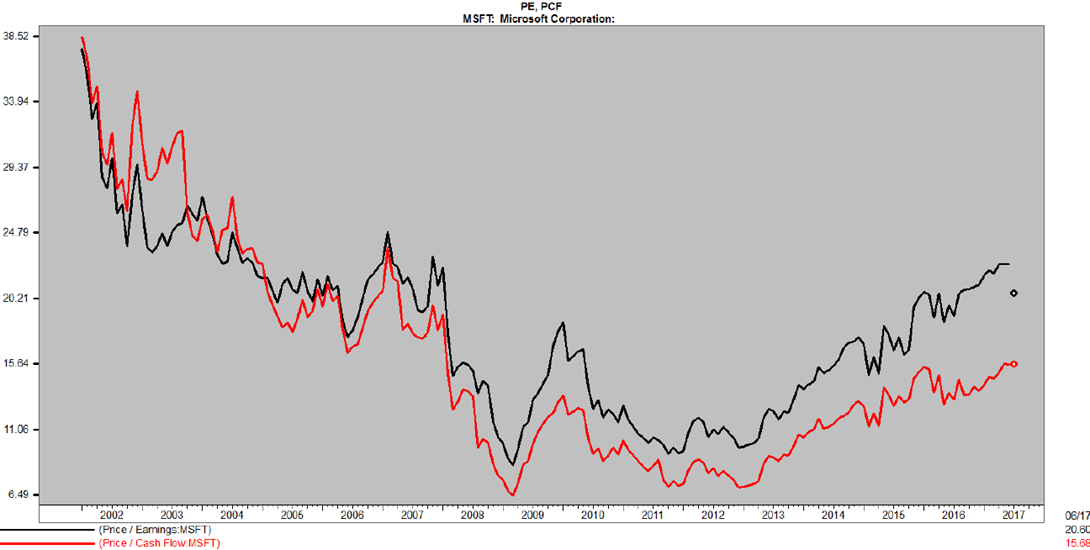
- Nonetheless, MSFT’s PE and PCF have been rising since 2012 and even more so since the elections. Not the strongest horse.
APPLE
- Apple’s net margins have been under pressure since 2012 while CF margins (red) have stabilized. Sales/sh. (blue) have plateaued since 2015.

- CFS is thus stable but EPS have declined in spite of a 20% drop in shares O/S.

- ROE and ROTA are slipping although they remain high at 34% and 14% respectively. Book value (blue) keeps rising however.

- AAPL is trading at the high end of its 8-year valuation ranges. This will be challenging given slower growth rates and declining rates of returns. Good horse but seems out of breadth.

ALPHABET
- Fairly similar situation with GOOG valuations parameters hitting the high end of their recent ranges.

- GOOG’s net margins (black) have declined from the 30% level to the 22% level but CF margins remain within their 10-year range although near the high end. GOOG’s top line growth (blue) is still robust.

- ROE has dropped from 23% to 15% and P/BV (blue) stands at the high end of its 8-year range. However, ROE and ROTA are trending slightly up. Strong horse but on the expensive side.

NETFLIX
- Fortunately, NFLX is the smallest of the MAGNAF stocks. Ratio analysis does not work well on this fast poney due to its biz mix and its accounting methods.

- Investors are obviously seeing strong earnings somewhere down the streaming road. Hopefully, they are not wearing blinkers. Long shot!

AMAZON
- Perhaps investors see NFLX as another AMZN which also invested heavily for years before cashflow (red) growth stepped up in 2013-14 and really jumped in 2015-16. EPS declined between 2011 and 2015 but growth turned definitely positive in the last 18 months while revenues remained on a tear.

- Margins have been rising in 2015-16 even though CF margins may have peaked at 10%.

- AMZN’s PE is in the stratosphere. Its P/S is at the high end of its 12-year range with possibly peaking margins. P/CF is in the middle of its range even though CF margins are much higher than ever and quite respectable at 10%.

- AMZN’s problem now is its size which is dragging its revenues growth rate down towards the more “mundane” 15% level. This expensive draft horse remains very solid and dependable but is obviously slowing down under its own weight.

- Short history as a public company. Sales keep soaring, selling at 16x revenues.

- Margins are rising, even at these amazingly high levels

- ROE and ROTA are also improving on already high levels (22% return on assets!).

- Valuation parameters are all selling at the low end of their short historical ranges, surprising given trends in FB’s growth, margins and returns. This amazing mustang is really challenging GOOG as the “Secretariat” of the group.

These six very different horses were running freely prior to 2015, actually trailing behind the whole market before 2014. But they really teamed up starting in 2015 when they literally left everybody else in the dust, even more so since Trump 1. This market would have been quite underwhelming without these six horses (indexed to 100 end of 2013).

This chart from Gluskin Sheff’s David Rosenberg illustrates how IT in general really outperformed since Trump 1:

Only 3 of the 6 horses displayed rising trailing 12-month EPS in the last 6 months and only one (NFLX) increased its trailing CF in the last quarter. Excluding NFLX and AMZN, which both trade at over 100 times earnings, P/Es range from 18.3 for AAPL (from 13.4 on Nov. 30, 2016), 22.6 for MSFT (21.2), 31.6 for GOOG (27.7) and 39.2 for Facebook (42.5). For PCF: AAPL 13.1 (9.3), MSFT 15.7 (13.8) ,GOOG 19.9 (16.4), FB 29.9 (27.0) and AMZN 37.1 (29.1).
Meanwhile, the S&P 500 trailing PE rose from 19.5 to 20.1 and its PCF from 12.6 to 13.6.
In all, this has been a rather narrow market, even more so during Trump 1. The MAGNAFicient horses in this six-horse hitch are actually very different one from the other, making it highly unlikely that they can remain synchronized for very long. Their pull could become much more difficult and erratic.
This could well apply to the whole Technology sector which now comprises 21% of the S&P 500 Index. RBC Capital notes that after Energy (in the early 1980s), IT (in the late 1990s), and Financials (in the mid-2000s) exceeded 20% of the index, their returns averaged +3% in the next 12 months, –3% in the next 3 years and –47% in the next 5 years. In each instance, this 20% sectorial weight eventually led to a bubble burst.
1 thought on “THE SIX-HORSE HITCH”
Amazing post Denis! Amazing graphs. One of the best articles I have seen in some time.
Comments are closed.