We value investors have bored momentum investors for decades by trotting out the axiom that the
four most dangerous words are, “This time is different.” For 2017 I would like, however, to add to this warning: Conversely, it can be very dangerous indeed to assume that things are never different.
This is from GMO’s Jeremy Grantham’s recent letter in which the value investor laments that things are not like in the good old days and that
it seems likely that we will have a longer wait than any value manager would like (including me) [before getting attractive valuations back].
Coming from such a well known and savvy investor, it is worth reviewing his arguments.
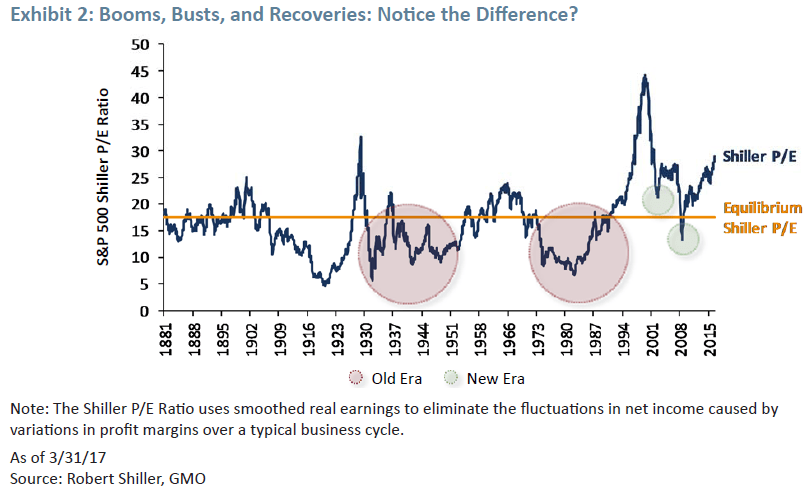
Exhibit 1 shows what happened to the average P/E ratio of the S&P 500 after 1996. For a long
and painful 20 years – for someone betting on a steady, unchanging world order – the P/E ratio
stayed high by 1935-1995 standards. It still oscillated the same as before, but was now around a
much higher mean, 65% to 70% higher! This is not a trivial difference to investors, and 20 years is
long enough to test the apocryphal but suitable Keynesian quote that the market can stay irrational
longer than the investor can stay solvent. (…)

After the bursting of the tech bubble, the failure of the market in 2002 to go below trend even for a minute should have whispered that something was different. (…) So, we have actually spent all of six months cumulatively below trend in the last 25 years! The behavior of the S&P 500 in 2002 might have been whispering in my ear, but surely this is now a shout? The market has been acting as if it is oscillating normally enough but around a much higher average P/E.
Grantham also uses the Shiller P/E to illustrate the apparent post-1997 era, even though many of the CAPE drawbacks are now well known (The Shiller P/E: Alas, A Useless Friend, “LEAVING CAPE TOWN”)
But Grantham should also know that something else happened after 1997: very low inflation rates with very tame cyclicality:

If you adjust P/E ratios for fluctuations in inflation rates, you get the Rule of 20 (fair P/E is 20 minus inflation) which has displayed continuous rationality throughout the period. Value conscious investors needed to go on an extended fishing trip between 1996 and 2004, missing that incredible roller coaster ride, but were given a nice window for a +30% ride through mid-2007 and the once-in-a-generation triple between March 2009 and December 2014 as well as a +12% “quicky” in 2016.
In effect, while absolute P/Es and most other valuation gauges got out of their historical range, the Rule of 20 P/E continued to fluctuate around its “20 fair level” throughout the last 20 years, much like it has been doing historically, adequately gauging the “normal” fluctuations in investor greed and fear moods which value investors enjoy exploiting.

For more on the Rule of 20:
- The Rule Of 20 Equity Valuation Method
- Understanding The Rule Of 20 Equity Valuation Barometer
- The Rule of 20: The Historical Record
As it stands now, the Rule of 20 totally disagrees with Jeremy Grantham. From a valuation view point, this time is really no different at all. Investors might have been slow to push valuations into the “extreme risk” area, but greed is finally taking over after the fearful previous decade with most of the usual attributes of a bubbling market.
Grantham continues:
How about profit margins, the other input into the market level? Exhibit 3 shows the return on sales
of the S&P 500 and Exhibit 4 shows the share of GDP held by corporate profits. Compared to the pre-1997 era, the margins have risen by about 30%. This is a large and sustained change.
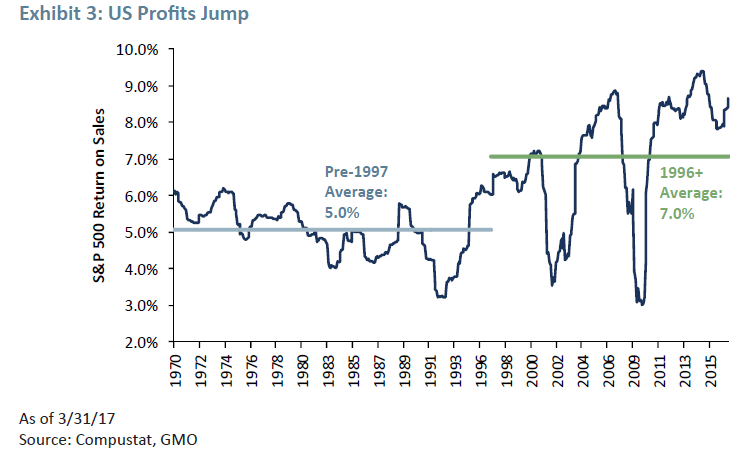

(…) With higher margins, of course the market is going to sell at higher prices. So how permanent are these higher margins? I used to call profit margins the most dependably mean-reverting series in finance. And they were through 1997. So why did they stop mean reverting around the old trend? Or alternatively, why did they appear to jump to a much higher trend level of profits? It is unreasonable to expect to return to the old price trends – however measured – as long as profits stay at these higher levels.
(…) Here are some of the influences on margins (in thinking about them, consider not only the possibilities for change back to the old conditions, but also the likely speed of such change):
Increased globalization has no doubt increased the value of brands, and the US has much more than its fair share of both the old established brands of the Coca-Cola and J&J variety and the new ones like Apple, Amazon, and Facebook. (…)
Steadily increasing corporate power over the last 40 years has been, I think it’s fair to say, the defining feature of the US government and politics in general. This has probably been a slight but growing negative for GDP growth and job creation, but has been good for corporate profit margins. And not evenly so, but skewed toward the larger and more politically savvy corporations. (…)
Previously, margins in what appeared to be very healthy economies were competed down to a remarkably stable return (…) driven by waves of capital spending just as industry peak profits appeared. But now in a very different world to that described in Part 1, there is plenty of excess capacity and a reduced emphasis on growth relative to profitability. (…)
The general pattern described so far is entirely compatible with increased monopoly power for US corporations. Put this way, if they had materially more monopoly power, we would expect to see exactly what we do see: higher profit margins; increased reluctance to expand capacity; slight reductions in GDP growth and productivity; pressure on wages, unions, and labor negotiations; and fewer new entrants into the corporate world and a declining number of increasingly large corporations. And because these factors affect the US more than other developed countries, US margins should be higher than theirs. It is a global system and we out-brand them for one thing.
The single largest input to higher margins, though, is likely to be the existence of much lower real interest rates since 1997 combined with higher leverage. Pre-1997 real rates averaged 200 bps higher than now and leverage was 25% lower. At the old average rate and leverage, profit margins on the S&P 500 would drop back 80% of the way to their previous much lower pre-1997 average, leaving them a mere 6% higher. (Turning up the rate dial just another 0.5% with a further modest reduction in leverage would push them to complete the round trip back to the old normal.)
Great analysis, reinforced by his conclusion…
I believe it was precisely these other factors – increased monopoly, political, and brand power – that had created this new stickiness in profits that allowed these new higher margin levels to be sustained for so long.
…followed by his reasoning why interest rates are likely to be low for longer resulting in P/E multiples being higher for longer.
All of our reasoning ends in surrender to feeling
(Blaise Pascal)
During 2016, I have written extensively on possible reasons behind the rise in profit margins (CETERIS NON PARIBUS, Certain Uncertainties, HARD HAT ZONE), including “increased globalization”, “increasing corporate power” and “monopolistic behaviour”.
However, Grantham’s assertion that the single largest input to higher margins is “likely” lower interest rates does not verify.
Here’s a Moody’s chart plotting corporate leverage and net interest expense as a % of sales, showing that the 25% jump in leverage has meaningfully offset the drop in rates over time and that net interest expense currently at 3.4% of sales is actually 25% higher than in 1997 (though lower than at the two previous recession peaks of 4.3%).

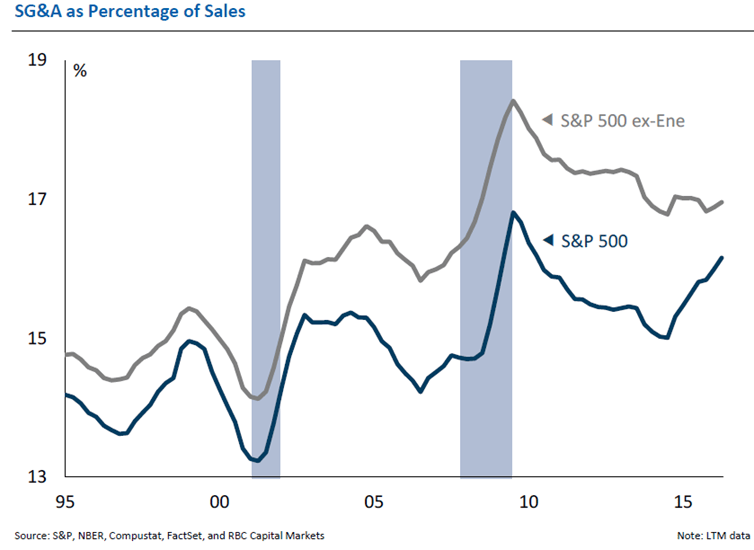
Furthermore, Grantham says nothing of the significant rise in SG&A costs as a % of sales between 1997 and 2009 as this RBC chart illustrates.
There is no such thing as a S&P 500 company. Looking at each of the major sectors contributing to the Index, the true reasons behind rising margins can perhaps be narrowed down. These CPMS/Morningstar charts plot net profit margins for each of the S&P 500 sectors since 1994 (black = average, red = median):
- Energy: strong uptrend until 2008

- Materials: no uptrend

- Industrials: no uptrend

- Consumer Discretionary: no uptrend

- Consumer Staples: significant uptrend post 2001

- Health Care: slight uptrend post 2009

- Financials: no uptrend

- Information Technology: no clear uptrend

- Telecoms: downtrend

- Utilities: big U shape bottoming in 2002

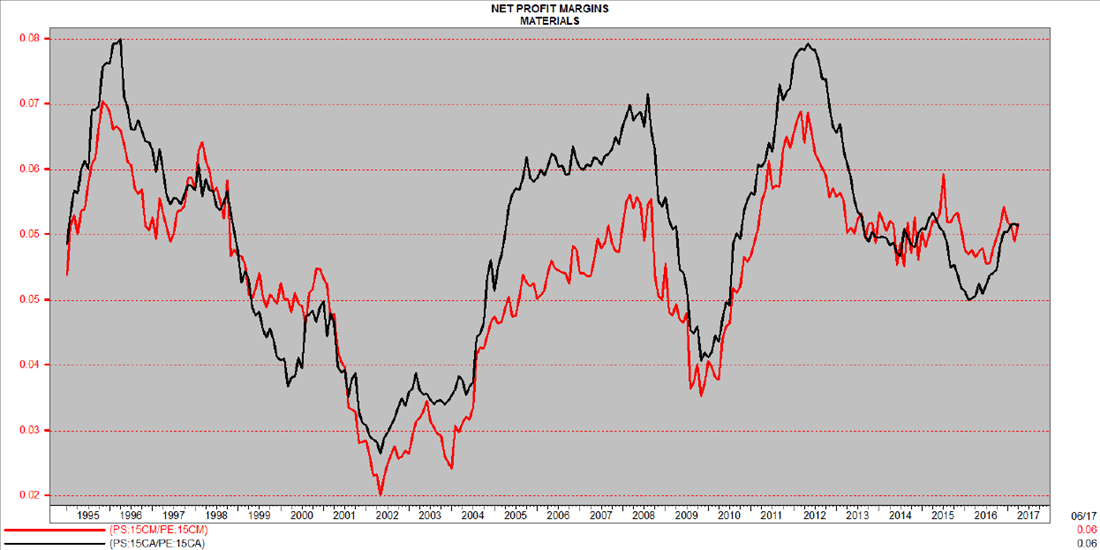

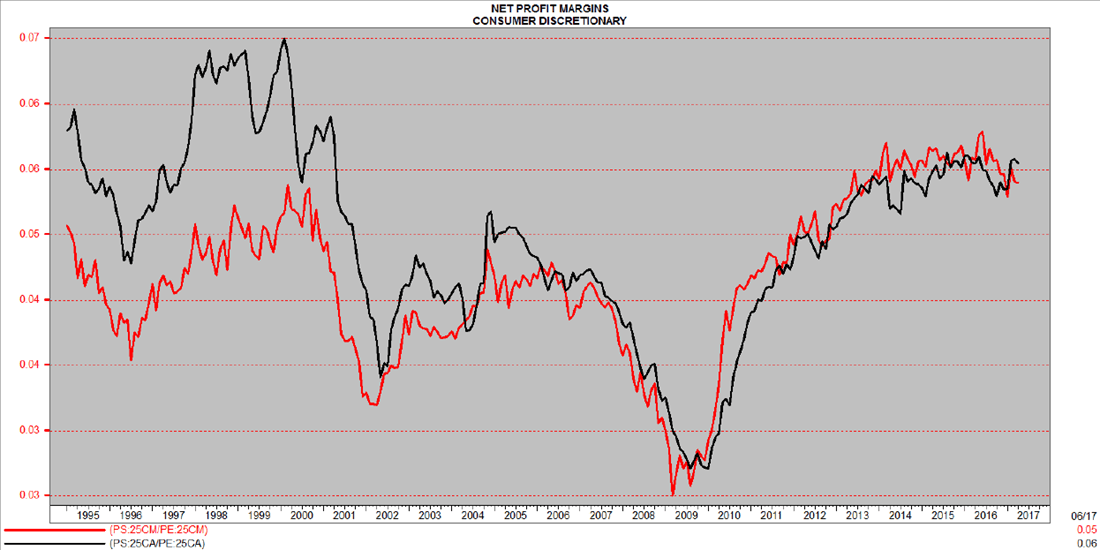


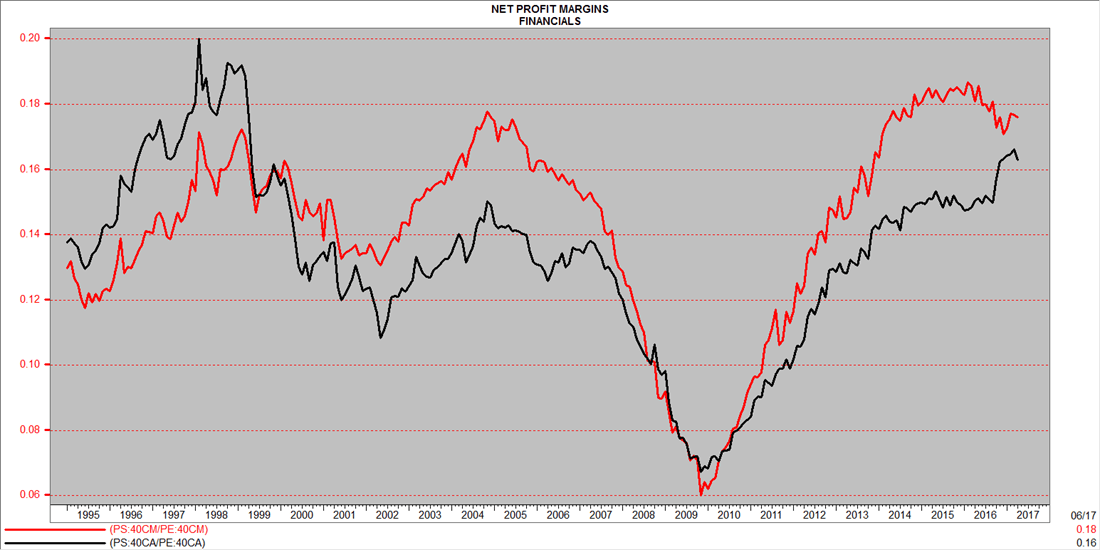

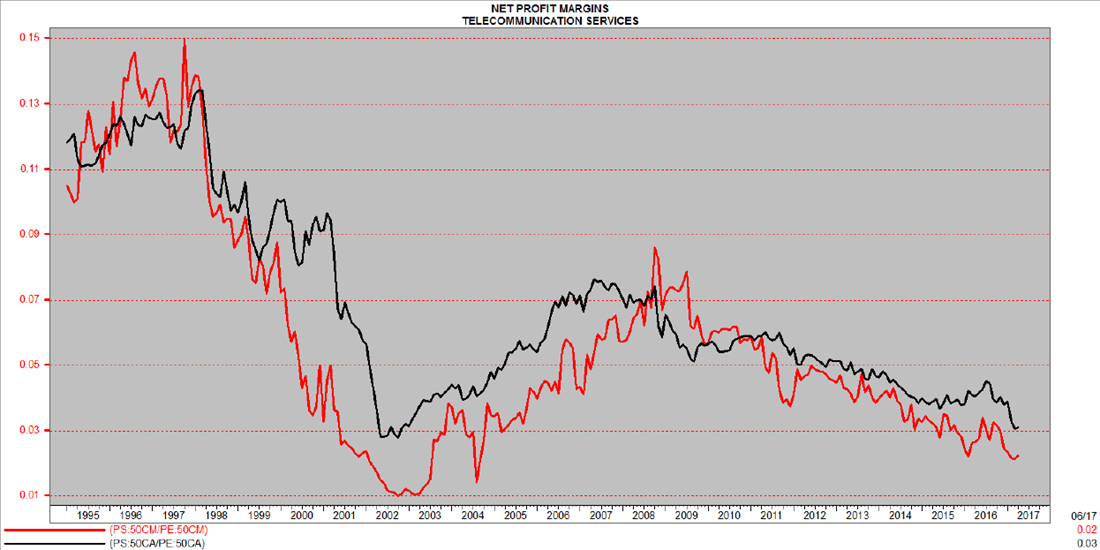

Prior to 2009, only two sectors showed clear and meaningful margins improvements since 1997: Energy and Consumer Staples. All other sectors experienced flat or lower margins.
The spectacular rise in the net margins of Consumer Staples companies has a lot to do with increased globalization, corporate power and monopolistic behaviour. Of the 37 companies in the sub-index, I have identified 13 which have more than doubled their net margins, on average, since 1997.

The rising margins of Energy companies between 1995 and 2008 is essentially the result of sharply higher oil prices as is the more recent decline due to collapsed prices. Interestingly, fluctuations in total S&P 500 Index net margins since 1997 are very much in synch with movements in oil prices (lagged 6 months) as this chart demonstrates (black: S&P 500 net margins, red: oil prices, blue: Cons. Staples margins):

The impact of oil prices on corporate margins also verifies on the total U.S. corporate sector:
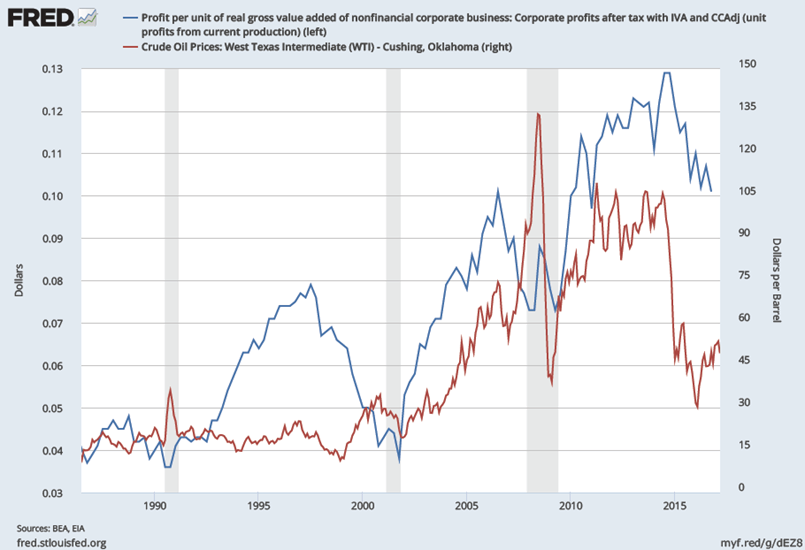
The rise in S&P 500 margins since 1997 is not the result of a widespread margin boost, nor of lower interest rates, but rather the result of increased concentration in the Consumer Staples industries and the five-fold jump in oil prices between 1997 and 2014. No other sector has shown meaningful uptrends in margins during that period, although Consumer Discretionary, Health Care and IT companies have recently been increasing their margins but mainly through higher debt leverage and greater concentration.
Looking forward, I offer the following thoughts and observations:
- Total S&P 500 net margins have been fairly steady near their new peak levels since 2012.
- Most industries have been unable to boost their margins in spite of subdued labor costs and much lower energy prices.
- Even the oligopolistic consumer staples companies have experienced margins compression.
- Oil prices remain under pressure from rising non-OPEC (mainly U.S.) production and weakening consumption.
- Wages are on an uptrend.
- Interest expense will surely bite into margins given the increased leverage.
- SG&A costs appear to have stabilized (at best).
- On the positive side, deregulation and tax reform could eventually help.
Regarding corporate taxation, the next chart plots pretax (blue) and net after tax margins (black) for corporate USA, as a percentage of revenues, as well as the effective corporate tax rate (red, rhs). Pretax margins have not recovered yet (through Q4’16) post the collapse in oil prices and currently sit at their 2006 and 2010 levels. The effective tax rate has been creeping up from its 70-year low of 21.2% reached in 2012.

Capacity utilization is one of the prime factors impacting operating margins but, for reasons mentioned above, the relationship broke in the last 10 years. However, trends in capacity utilization continue to impact margins trends.

S&P 500 companies ROE peaked in 2008 and has been on a downward slope even with increased debt leverage.

This next chart plots the S&P 500 Index Return on Equity (black) and its Reinvestment Rate since 1980. The spectacular long-term uptrend in ROEs came to a screeching halt in 2008. The Financial Crisis was brutal but its aftermath did not allow ROEs to return even close to their previous peak. Same thing for RRs which have clearly broken their long-term trend. (The RR is a measure of profitability, similar to ROE with the exception that paid dividends are subtracted: RR = ((EPS – DIV) / BV). It measures the rate at which earnings are reinvested to grow book value.)

The popularity of yield stocks provided a strong incentive to raise dividend payout ratios well above previous peak levels…

…which, coupled with declining RR, put the brakes on book value growth since 2015 (log scale).

To conclude and close the margins-valuations loop, Jeremy Grantham misses the main point when analysing the rise in profit margins. He is thus also wrong in assuming that margins will stay high for a good while if interest rates also remain lower for longer.
- The fact is that if lower for longer also applies to oil prices (it should), overall margins will be under pressure for longer.
- The fact also is that excessive returns always beget more capital which generally results in lower marginal rates of returns. This may well be happening now given the weak margins trends since 2012 under very favorable operating conditions for any industry outside of energy.
- Moreover, globalization and digitalization are destroying physical borders and helping competitors rapidly and effectively attack and disrupt high margin sectors.
- Increased industrial concentration was helped in no small way by rising regulations which impede smaller companies to effectively compete against their more powerful competitors. Deregulation could change that.
- Wages are on a clear uptrend and it remains to be seen if companies will be able to pass these higher costs on to consumers in a decidedly slow going economy.
- Interest rates are also on the rise and higher leverage will amplify their P&L impact.
- Tax reform remains a possibility but what and when? Will its eventual benefits get competed away like low wages and oil prices have?
In all, without crystal balling, there are enough facts to discredit the notion that higher margins are here to stay. Time will tell but 8 years into this recovery, with rock bottom interest rates, very slow wage growth and collapsed energy prices, there have been no new highs in corporate margins in recent years.
Which brings us to Grantham’s main existential problem: valuations.
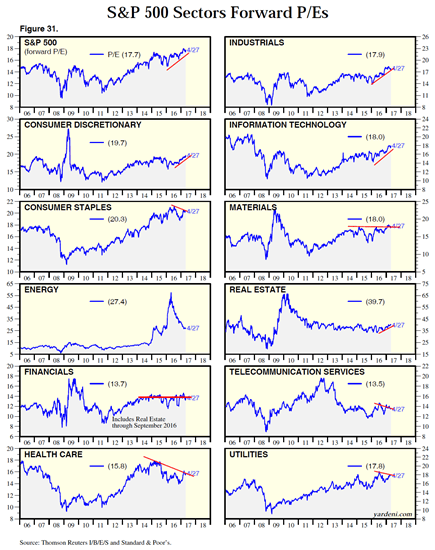
- P/E ratios (absolute, CAPE and Rule of 20) have all recently risen into bubbling territory but, in reality, only 3 sectors led them upwards: Industrials, Consumer Discretionary and IT for reasons that have much to do with President Trump’s electoral platform. Time will tell if such revaluation is warranted. For now, let’s just note that in Q1’17, only IT is providing strong EPS growth (+18.6%) while Industrials (+2.9%) and CD (+4.1%) are underwhelming. Furthermore, profit margins are falling in HC, CS, CD, I, U and T.

- Energy companies are still selling at historically very high P/Es on hopes of higher oil prices. We shall see.
- High dividend yield stocks are also selling at historically high P/Es, right when interest rates are on the rise. We shall see.

P/E ratios are not displaying any secular uptrend when inflation is factored in. It is thus wrong to assume this is a new era. The fact is that when incorporating inflation in the valuations equation like the Rule of 20 does, we see that the current uptrend is but a normal end-of-cycle phenomenon. So is capitulation.
There are no new eras — excesses are never permanent
Whatever the latest hot sector is, it eventually overheats, mean reverts, and then overshoots. As the fever builds, a chorus of “this time it’s different” will be heard, even if those exact words are never used. And of course, it — Human Nature — never is different. (Bob Farrell’s rule 33)
Fear and greed are stronger than long-term resolve
Investors can be their own worst enemy, particularly when emotions take hold. (Rule #6)
8 thoughts on ““This Time Seems Very, Very Different.” Really?”
Well thought out, convincing analysis, Denis. Love these analytical posts of yours. I bookmark them and often re review them from time to time. Great work. Thank you for your effort.
Thank you Jey.
Globalization is coming after the staples industry too… Aldi and Lidl are in the midst of a huge expansion in the US. Their emphasis on low-cost, high quality, private-label staples is going to crush the margins of the brand-name staple companies. Within 5 miles of where I live for example there are two Aldis and two Lidls currently under construction.
Today’s post could be your Magnum Opus. What a fantastic and thoroughly supported analysis!
Comments are closed.