US Payrolls Marked Down a Record 911,000 in Preliminary Estimate
US job growth was far less robust in the year through March than previously reported, adding to mounting pressure on the Federal Reserve to lower interest rates.
The number of workers on payrolls will likely be revised down by a record 911,000, or 0.6%, according to the government’s preliminary benchmark revision out Tuesday. The final figures are due early next year.
Before the report, the government’s payrolls data indicated employers added nearly 1.8 million total jobs in the year through March on a non-seasonally adjusted basis, or an average of 149,000 per month. The revision showed average monthly job growth was roughly half that. [71k] (…)
Payrolls were marked down in nearly every industry and most states. Combined payrolls at wholesale and retail establishments led the downward revision, followed by leisure and hospitality. Professional and business services as well as manufacturing were also notably marked down. (…)
Adjustments have been bigger than usual in recent years, which some economists attribute to unique post-pandemic dynamics. (…)
“In an economy where 163.3 million individuals are employed, a downward revision of 911,000 distributed over the space of twelve months is not that large from a quantitative point of view,” Brusuelas said in a note. “We will not know the monthly distribution of those downward revisions until February 2026.” (…)
The preliminary figure applies to the total level of payrolls in March 2025. The final numbers, which are released with the employment report due next February, will break out the revisions by each month. (…)
Several economists said the initial payrolls data may have been impacted by a number of factors, including adjustments for the creation and closure of businesses and how unauthorized immigrant workers are counted. (…)
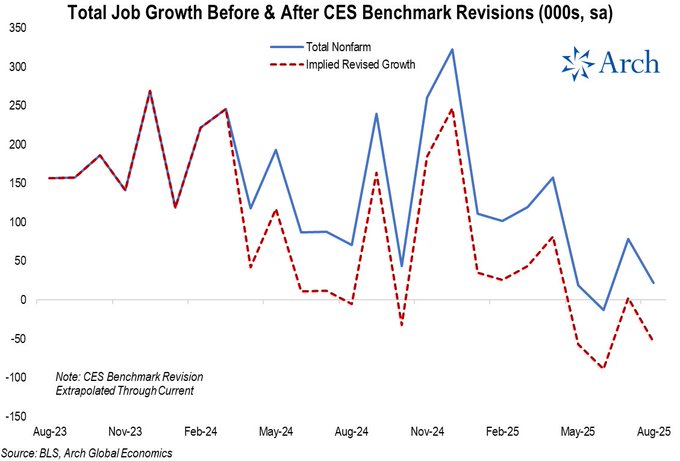
- Here’s a look at monthly job growth if we include the revised data and carry forward that monthly pace of negative revisions through August. @Econ_Parker
- Just over half of the revision was in Leisure and hospitality (-176k), Professional and business services (-158k), and Retail trade (-126k) @Econ_Parker

Ed Yardeni:
The negative spin is obvious: The labor market is weak, and so is the economy. Our positive spin is that the revisions confirm that the monthly “breakeven” payroll gain may be 75,000 rather than 150,000. This revision won’t change the unemployment rate, which had been running around 4.0% during the revision period. Furthermore, the benchmark revision implies a significant upward revision in productivity over the past few quarters!
Goldman Sachs:
We think that today’s downward revision to payroll growth could somewhat exaggerate the degree to which job growth has been overstated, both because the QCEW source data itself has persistently been revised upward and because it may have difficulties accounting for unauthorized immigrants.
Our own model of net job gains from firm births and deaths—one of the key points of uncertainty in monthly payrolls growth that the benchmarking process corrects for—suggests a downward revision of around 550k or 45k per month via that channel, which would imply that monthly job growth over this period was closer to 100k than the initially reported 147k, but not as low as the 71k pace implied by the revisions.
While the BLS’s birth-death adjustment for nonfarm payrolls was probably too generous in 2024H2, we estimate that the overstatement has since narrowed to around 10k jobs/month, cautioning against extrapolating too much from the benchmark revision.
Today’s revisions provide limited information about the current state of the labor market: in addition to applying to a long-ago horizon, they have no impact on the signal provided by estimates in the household survey (e.g., the unemployment rate) or other labor market data. That said, we continue to believe that the labor market has softened materially.

-
Indeed Job Postings, after recovering since mid July, slumped in late August Through September 4:

China Factory Deflation Eases But Not Enough to Call Turnaround
The producer-price index decreased 2.9% in August from a year earlier, the National Bureau of Statistics said Wednesday, remaining in negative territory for the 35th straight month but narrowing its decline from July’s 3.6% drop.
In month-on-month terms, output prices in some upstream sectors such as the mining and processing of metals rose for the first time in months.
But deepening food deflation meant the consumer-price index turned negative for the first time in three months, with a drop of 0.4% in August from a year earlier. (…)
A drop in food prices and the effect of a high base from last year were the main cause of the CPI decline in August, according to Dong Lijuan, chief statistician at the NBS.
Food costs declined 4.3% year-on-year, with the cost of fresh vegetables plunging over 15% — the most since November 2022.
But core CPI, which excludes volatile items such as food and energy, rose to an 18-month high of 0.9%. Dong said its increase shows policies to boost demand and consumption are taking effect. (…)
And despite indications that a boost from the government’s subsidies for consumer goods was fizzling out, prices for durables such as household appliances surged in August, jumping 4.6% from a year earlier in the biggest increase since records began in 2001. (…)

- Non-Food CPI was +0.5% YoY in August (+0.7% MoM annualized) vs +0.3% YoY in July. Core goods and services are back in positive territory.

Source: CEIC, Goldman Sachs Global Investment Research