U.S. Initial Jobless Insurance Claims Rise Modestly but Prior Week Revised Up 55,000
Initial claims for unemployment insurance rose 13,000 in the week ended February 13 to 861,000. The previous week, initially reported at 793,000, was revised to 848,000. Thus, the decline then of 19,000 evolved into an increase of 36,000. The four-week moving average of initial claims eased to 833,250, a decrease of 3,500 and a five-week low. The Action Economics Forecast Survey expected 775,000 for the latest week.
Initial claims for the federal Pandemic Unemployment Assistance (PUA) program climbed to 516,299, up 174,427 on the week and the largest number since September 19. The PUA program covers individuals such as the self-employed who are not included in regular state unemployment insurance.
Continuing claims for regular state unemployment insurance decreased to 4.494 million in the week ended February 6 from 4.558 million in the prior week, which was revised from 4.545 million; the not seasonally adjusted series in the February 6 week fell to 5.003 million from 5.157 million. Continuing PUA claims for the week of January 30 decreased to 7.685 million from 7.943 million in the prior week. The Pandemic Emergency Unemployment Compensation (PEUC) claims declined to 4.061 million in the January 30 week from 4.779 million the week before. This program covers people who were unemployed before COVID but exhausted their state benefits and are now eligible to receive benefits through March 14, 2021.
The total number of all state, federal and PUA and PEUC continuing claims fell by 1.326 million to 18.340 million in the January 30 week from 19.666 million the week before. This grand total is not seasonally adjusted.
U.S. Housing Starts Decline in January
Strength in home building waned last month. Housing starts declined 6.0% (-2.3% y/y) during January to 1.580 million (AR) from 1.680 million in December, revised from 1.669 million. November starts were revised to 1.553 million from 1.578 million. The Action Economics Forecast Survey expected 1.658 million starts in January.
Starts of single-family homes declined 12.2% (+17.5% y/y) to 1.162 million from 1.323 million in December, revised from 1.338 million. Offsetting this decline was a 17.1% increase (-33.4% y/y) in multi-family starts to 418,000 from 357,000 in December, revised from 331,000. It was the highest level of multi-family starts in six months.
A 10.4% January increase (22.5% y/y) in building permits to 1.881 million suggests that weakness in housing starts overall will not be long-lived. The January level of permits was the highest since May 2006, increasing from December’s 1.704 million. Permits to build single-family homes rose 3.8% (29.9% y/y) to 1.269 million following a 7.6% December gain. Permits to build multi-family homes surged 27.2% (9.5% y/y) to 612,000 from a little-revised 481,000 in December.

CONSUMER WATCH
Chinese Consumers Were Big Spenders During the Lunar New Year Holiday Chinese consumers opened up their wallets over the weeklong Lunar New Year holiday, energizing a domestic retail and service sector that has proved a stubborn laggard in China’s economic recovery.
Consumption at major retailers and restaurants over the seven-day holiday, from Feb. 11 to Feb. 17, hit 821 billion yuan, China’s Commerce Ministry said Wednesday. That figure, equivalent to about $127 billion, represented a 29% jump from last year’s pandemic-disrupted holiday, and a 4.9% increase from the same period in 2019, long before the coronavirus swept across China.
The rise in spending came as tens of millions of Chinese residents heeded authorities’ call to stay put during the Lunar New Year holiday because of the coronavirus, denting what is traditionally the busiest travel season of the year. Instead, they redirected their disposable income to gifts, food, entertainment and other sectors that suffered during the height of the pandemic last year. (…)
As a result of the admonitions from authorities, travel by rail, air, road and other modes of transport fell 77% from pre-coronavirus levels and economists began adjusting forecasts for consumption to take a hit more broadly.
Instead, the latest official data suggest that the stay-in-place policies—combined with the cash handouts and a successful taming of the latest wave of infections—helped resuscitate consumption by keeping people in big cities and freeing them up to splurge on meals and entertainment.
Across China’s 10 biggest cities, official data showed consumer foot traffic at shopping malls was triple last year’s levels, though still below 2019 levels.
Chinese consumers’ willingness to spend powered a surge in China’s box-office revenues, which set a holiday record of 7.5 billion yuan, equivalent to $1.1 billion. Less than two months into the new year, 2021’s box office revenues are already near half of 2020’s full-year total, China’s Commerce Ministry said. (…)
Even with cinemas restricted to occupancy of 75%—and just 50% in big cities like Beijing and Shanghai—the number of Lunar New Year moviegoers surpassed 2019’s numbers by 22%, according to analysts at investment bank China International Capital Corp. , though they also warned that fewer Hollywood blockbusters this year could hurt summer box-office receipts.
Another beneficiary of the Lunar New Year restrictions were jewelry and fashion outlets, which reported year-over-year sales jumps of 161% and 107%, respectively, during the weeklong holiday, according to the Commerce Ministry.
Those outlets were boosted by Valentine’s Day, a Western holiday that is increasingly celebrated by younger Chinese, and which fell during this year’s Lunar New Year. (…)
Shanghai’s commerce bureau, which surveyed more than 100 restaurants in the affluent coastal city, reported a 79% jump in Lunar New Year sales compared with last year’s holiday. (…)
David Rosenberg is a vocal bear, primarily with his call for weak consumer spending post normalization and continued lowflation. But recent data seem to be shaking his confidence somewhat. About whether Americans will keep saving their stimmies, Rosie notes that:
Despite the fact that consumer sentiment in February sagged to a six-month low, households wasted no time in spending the renewed giveaway from Uncle Sam. Thing is —from our back-of-the-envelope calculations, 86% of the total stimulus has already been spent. At the same time, more help in terms of government fiscal stimulus is coming our way, and double what was doled out in late December.
And, based on our estimate of the direct impact of the stimulus checks and what organic income seems to have done in January, it looks to us as if the personal savings rate plunged from 13.7% to 9.8%. If you recall, our “new normal”precautionary savings equilibrium is around 10%, and we are pretty well there (for now).
The fact that Americans would have already used 86% of their January rescue checks goes against the idea that they want to keep high precautionary savings. The next, even larger, “rescue checks” could come in March or April.
On inflation, he now admits that “We do have some cyclical pressures, don’t get me wrong —but each time they come and they go.” Not if rescue checks are spent.
FLASH PMIs
Eurozone service sector weakening cushioned by manufacturing gains
Eurozone business activity fell for a fourth successive month in February, driven lower by a further slump in the service sector as virus-related restrictions continued to affect many businesses. The service sector downturn was offset, however, by faster manufacturing growth, led by Germany. Business expectations also improved to the highest for nearly three years as companies looked ahead to vaccine roll-outs allowing an easing of restrictions.
Rising price pressures were evident, however, as surging demand for raw materials led to near-record supply constraints, driving manufacturing input prices up at a rate not seen for almost ten years.
The headline flash IHS Markit Eurozone Composite PMI® edged higher from 47.8 in January to 48.1 in February. By remaining below 50.0, the latest reading indicated a fourth consecutive monthly contraction of business activity, but also registered a slight easing in the rate of decline compared to January.
Despite the rise in the PMI, the average reading of 47.9 for the first quarter so far is marginally lower than the average of 48.1 seen in the fourth quarter of last year. The sustained downturn therefore hints at a further deterioration in the economy as measures to control the coronavirus disease 2019 (COVID-19) pandemic continue to disrupt business activity across the region.
Importantly, however, the last four months have seen the PMI remain far higher than during the initial months of the pandemic in the spring of last year, suggesting that the economic impact of the second wave of virus infections has so far been much less severe than during the first wave.
The deterioration in output was driven by the service sector, where activity fell at the fastest rate since November, registering the second-steepest fall since last May largely in response to COVID-19 related restrictions. Steepening declines were seen in Germany and France, though the rest of the region as a whole reported some cooling in the downturn compared to January.
In contrast to the further weakening of service sector activity, manufacturing output growth accelerated to the fastest since October, and the second-fastest in three years, buoyed by surging inflows of news business. Especially strong manufacturing growth was again recorded in Germany, though France also saw production return to modest growth after a brief hiatus in January and the rest of the eurozone enjoyed the strongest factory production gains since last August.
The strength of its manufacturing sector meant overall business activity rose in Germany, although at 51.3 (up only modestly from 50.8 in January) the composite index registered only a marginal expansion due to the offsetting impact of weaker services.
At 45.2, down from 47.7, the equivalent composite index for France meanwhile signalled the steepest deterioration since November due to the faster service sector downturn. Business activity also declined across the rest of the eurozone as a whole, albeit at a reduced rate.
The stronger growth of eurozone manufacturing output occurred despite increasingly widespread shortages of inputs, demand for which continued to outstrip supply in many cases. The amount of inputs bought by manufacturers rose at the sharpest rate for just over three years, putting further pressure on supply chains. February consequently saw supplier delivery times lengthen to the greatest extent since survey data were first available in 1997 with the exception of last April, when global factory closures hit supply lines. Record supply delays were reported in Germany.
Surging demand and constrained supply contributed to a further marked rise in prices during the month. Average prices paid for inputs by manufacturers rose at a rate not seen since April 2011, in turn feeding through to the steepest rise in prices charged at the factory gate since May 2018.
A more modest rise in costs was seen in the service sector, where weak demand encouraged further discounting and pushed average rates charged lower for a twelfth successive month.
Measured overall, average rates charged for both goods and services were unchanged, contrasting with the declines seen over the prior 11 months.
A further drop in backlogs of work meanwhile meant employment across the eurozone fell for a twelfth straight month. Job losses in the service sector outweighed a modest return to hiring in manufacturing, which saw headcounts rise for the first time since April 2019.
Employment rose modestly in Germany and France, the latter reporting the largest rise for a year, while job losses continued across the rest of the region as a whole.
Finally, business expectations grew more optimistic in February. Sentiment regarding output in the coming 12 months rose to the highest since March 2018, improving in both manufacturing and services. Brighter prospects were primarily linked to hopes of successful vaccine roll-outs in the coming months.


Japan: Private sector downturn extends to February
Flash Composite Output Index, Feb: 47.6 (Jan Final: 47.1)
The headline au Jibun Bank Japan Manufacturing Purchasing Managers’ Index™ (PMI)® rose from 49.8 in January to 50.6 in February, indicating a renewed improvement in the manufacturing sector. Both output and new orders expanded, and at the fastest rates seen since December 2018. New export business also recorded growth, rising for the first time in four months and at the quickest pace since March 2018. Business optimism strengthened in February, which marked the ninth consecutive month of positive sentiment among Japanese manufacturers.
At 45.8 in February, the au Jibun Bank Flash Japan Services Business Activity Index fell from 46.1 in January to signal a quicker deterioration in business activity across the service sector. New business contracted sharply, with the pace of decline the fastest for nine months. Despite weaker demand conditions, Japanese service providers expanded their workforce for the first time since February 2020. Business expectations also strengthened in February, with the level optimism rising to the highest for three months.


COVID-19
We’ll Have Herd Immunity by April Covid cases have dropped 77% in six weeks. Experts should level with the public about the good news.
Dr. Makary is a professor at the Johns Hopkins School of Medicine and Bloomberg School of Public Health, chief medical adviser to Sesame Care, and author of “The Price We Pay.”
(…) Cases are down 77% over the past six weeks. If a medication slashed cases by 77%, we’d call it a miracle pill. Why is the number of cases plummeting much faster than experts predicted?
In large part because natural immunity from prior infection is far more common than can be measured by testing. Testing has been capturing only from 10% to 25% of infections, depending on when during the pandemic someone got the virus. Applying a time-weighted case capture average of 1 in 6.5 to the cumulative 28 million confirmed cases would mean about 55% of Americans have natural immunity.
Now add people getting vaccinated. As of this week, 15% of Americans have received the vaccine, and the figure is rising fast. Former Food and Drug Commissioner Scott Gottlieb estimates 250 million doses will have been delivered to some 150 million people by the end of March. (…)
At the current trajectory, I expect Covid will be mostly gone by April, allowing Americans to resume normal life. (…)
But the consistent and rapid decline in daily cases since Jan. 8 can be explained only by natural immunity. Behavior didn’t suddenly improve over the holidays; Americans traveled more over Christmas than they had since March. Vaccines also don’t explain the steep decline in January. Vaccination rates were low and they take weeks to kick in.
(…) countries where new variants have emerged, such as the U.K., South Africa and Brazil, are also seeing significant declines in daily new cases. The risk of new variants mutating around the prior vaccinated or natural immunity should be a reminder that Covid-19 will persist for decades after the pandemic is over. It should also instill a sense of urgency to develop, authorize and administer a vaccine targeted to new variants. (…)
")
")
- Single Dose of Pfizer Vaccine Is 85% Effective, Study Shows A single shot of the Pfizer-BioNTech vaccine is 85% effective in preventing symptomatic disease 15 to 28 days after being administered, an Israeli study found, a development that could help in setting vaccine priorities world-wide.
 Can a Vaccinated Person Still Spread the Coronavirus?
(…) Results so far are preliminary. The most extensive data released concern the vaccine made by AstraZeneca Plc. In a study in the U.K., volunteers are checked for SARS-CoV-2 infections using weekly self-administered nose and throat swabs. According to results as of Dec. 7, after a single dose, the group that received the vaccine had 67% fewer positive swabs than the placebo group, suggesting the vaccine cuts down on infections as well as disease. Earlier, Moderna Inc. reported similar results from people who had received a single dose of its vaccine as of November.
Data from Israel, which has inoculated a higher percentage of its population than any other country, provide clues that the vaccine in use there, from Pfizer Inc. and BioNTech SE, may reduce transmission even if it doesn’t protect against infection. After more than 75% of people age 60 or older had received one vaccine dose and only 25% of those between the ages of 40 and 60 had, researchers from Israel’s biggest coronavirus testing lab looked at their data. For those who tested positive for SARS-CoV-2, there was a notable difference between the two age groups in the average amount of virus found in test swabs. The researchers estimated that vaccination reduces the viral load by 1.6 to 20 times in individuals who become infected despite the shot.
Another study in Israel, following people who became infected after inoculation, found the vaccine reduced their viral load fourfold. Also, a study of Moderna’s Covid vaccine in monkeys suggested that it will reduce, if not completely prevent, onward transmission of the virus. (…)
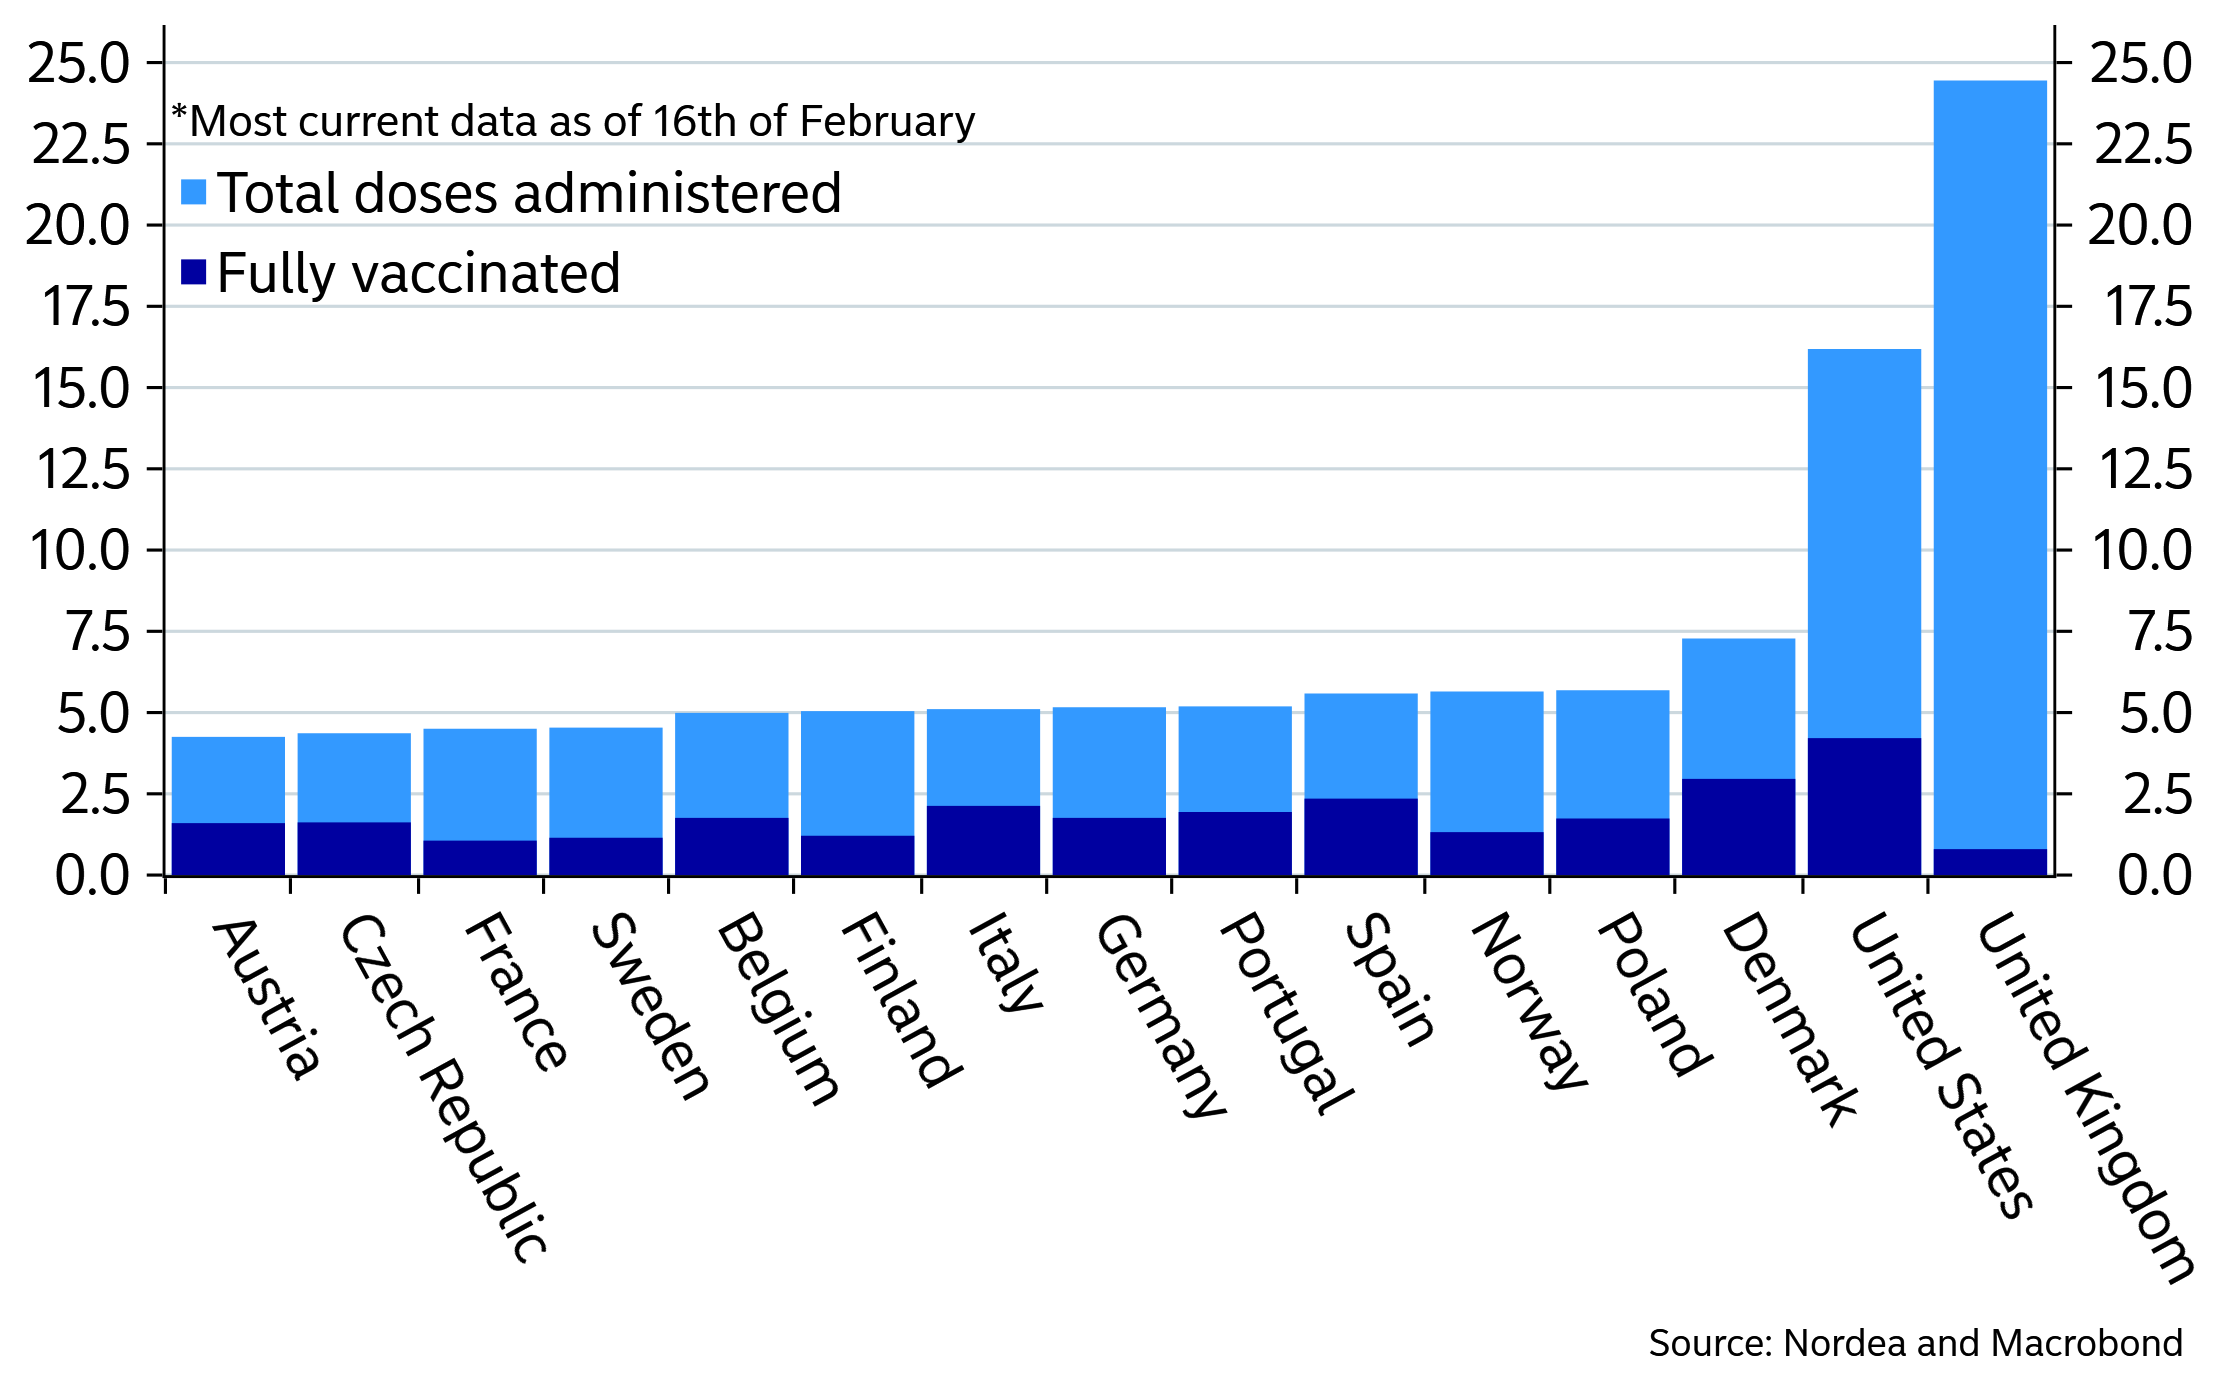
Doses administered and fully vaccinated people as percent of population
- A U.S. Vaccine Surge Is Coming, With Millions of Doses Promised The U.S. vaccine supply is expected to double quickly enough that there will be enough doses to vaccinate all Americans before the end of July.

CEO confidence hits 17-year high
- Overall, 82% of CEOs expect economic conditions to improve over the next six months, up from 63% last quarter, the Conference Board reported.
- The percentage of CEOs expecting conditions to worsen was cut in half, dropping to 7% from 15%.
- Similarly, 78% of CEOs anticipate short-term prospects in their own industries to improve, up from 65% in September. (Axios)

Data: The Conference Board; Chart: Andrew Witherspoon/Axios
SENTIMENT WATCH
Global Value Rotation Has Morphed Into Chasing Risk at Any Price
(…) “The demand so far this year has really been for the riskier stocks, be they expensive and exciting technology names or cheaper names beaten up by the economic slump,” wrote strategists including Andrew Lapthorne on Thursday. “While you might then conclude there has been a rotation out of low volatility names, it is only the expensive, more glamorous part of the high-quality segment of the market that is suffering.” (…)
John Authers today:
(…) the single worst-performing factor of the last 12 months for U.S. stocks of all capitalizations has been profitability, according to the wonks at Bloomberg. Holding all else equal, companies that do a really good job of squeezing out earnings have been punished for it. The best factor has been volatility; all else equal, the more a stock’s price tends to swing around, the better it has done, particularly since Vaccine Day. When large numbers of people truly believe that “stocks only go up,” perhaps this is inevitable. It may not be pretty when they discover that volatile stocks also go down. (…)
Tiny-Company Boom Makes Markets Look Silly Fourteen members of the Russell Microcap index have risen so much that they are now larger than the smallest S&P 500 stocks.
(…) Within the Russell 2000 index of small companies, the bottom half of which overlaps with the Microcap measure, an astounding 302 stocks are bigger than at least one S&P 500 member. The largest is Plug Power, up 973% last year and another 48% this year to make the fuel-cell developer big enough to be in the top half of the S&P, worth about the same as State Street Corp. or Kroger Co. (…)
The biggest of the microcap stocks have far outperformed the rest, with the 100 largest in the Russell Microcap index averaging a gain of 56% this year, after tripling last year. (…)
The 40% or so of the Russell 2000 index of smaller companies that have no earnings have beaten the profitable stocks. (…)
Palantir Becomes an Unlikely Darling of the GameStop Crowd Quarterly results and a lock-up expiration hit shares of the richly valued software maker, but it is finding support in online forums
(…) the shares are still trading around 30 times forward sales even with this week’s losses. As stonks go, this one isn’t a bargain.
BTW, Palantir has never made a profit in 17 years, despite dealing almost exclusively with governments…
Metals Are Soaring on a Green Frenzy and Global Recovery
Copper charts from Bloomberg and Goldman Sachs:


Copper mine supply growth, yoy an
FYI:
How are bitcoin created? An illustrated guide to bitcoin mining, blockchains, and the “minting” process of cryptocurrency’s most popular coin.
Coming bill would allow U.S. news publishers to team up when negotiating with Facebook, Google
Bipartisan members of Congress plan to introduce a bill in coming weeks to make it easier for smaller news organizations to negotiate with Big Tech platforms, said Rep. Ken Buck, the top Republican on the House Judiciary Committee’s antitrust panel.
Buck, who was named the ranking member this month, told Reuters on Thursday the panel would bring out a series of antitrust bills and the first one in the coming weeks would allow smaller news organizations to negotiate collectively with Facebook and Alphabet’s Google. (…)
Uber Loses U.K. Court Battle Over Worker Rights The U.K.’s top court ruled that a group of former Uber drivers were entitled to a minimum wage and other benefits while working for the company, dealing a setback to gig-economy firms in battles world-wide over their employment model.
Lawmakers Push for Wealth Tax on New York Billionaires A coalition of unions, progressive advocacy groups and Democratic officials has endorsed a slate of six revenue bills, including a so-called mark-to-market tax on billionaires.
(…) The tax menu also includes increases to income and capital-gains taxes as well as a proposed tax on financial transactions. Gov. Andrew Cuomo, a Democrat, proposed a $1.5 billion income tax hike as part of his $193 billion budget plan, but hasn’t embraced a mark-to-market tax.
Democrats who control the state Assembly and Senate said all measures—including the mark-to-market tax—remain on the table in fiscal talks. The state faces an $8.2 billion deficit. (…)
Supporters said the mark-to-market tax would bring in the most revenue—an estimated $23 billion—in the coming state fiscal year that could be used to fund education and healthcare that would otherwise face cuts because of the pandemic. (…)
Personal income tax collections currently fund about half of New York’s operating budget, and are disproportionately drawn from the filers with the highest income. According to state officials, the top 2% of taxpayers—about 188,000 filers—account for just over half of the state’s income taxes. (…)
Ms. Ramos said fears of migration are unfounded, and that she continues to talk to colleagues about her bill, which is part of the union-backed “Invest in Our New York” campaign. (…)
David Gamage, a professor at Indiana University law school who helped draft Ms. Ramos’ bill, said the proposal was constitutional in New York because it taxed changes in the value of assets, not simply the value of assets themselves. He said the valuations were possible because the number of affected taxpayers was likely below 200. (…)
So, $23B from less than 200 taxpayers, annually…
New York State had the largest population loss of any of the 10 states that saw declines between July 2018 and July 2019, as New York and the Northeast region as a whole continued to see people leave for other parts of the United States, according to new census data released Monday. (…)
New York was one of 10 states that had population declines during the one-year period. The others were Illinois (-51,250), West Virginia (-12,144), Louisiana (-10,896), Connecticut (-6,233), Mississippi (-4,871), Hawaii (-4,721), New Jersey (-3,835), Alaska (-3,594) and Vermont (-369).
The top five states that had the largest numeric population growth between 2018 and 2019 were Texas (367,000), Florida (233,000), Arizona (121,000), North Carolina (106,469) and Washington State (91,000). (…)
Must be because of the weather, although Texas may have slipped lower on the list…


")


