The enemy of knowledge is not ignorance, it’s the illusion of knowledge (Stephen Hawking)

It ain’t what you don’t know that gets you into trouble. It’s what you know for sure that just ain’t so (Mark Twain)

Invest with smart knowledge and objective odds

THE DAILY EDGE: 23 FEBRUARY 2021

Consumer Demand Snaps Back. Factories Can’t Keep Up. Snarled supply chains, labor shortage thwart full reopening; ‘everyone was caught flat-footed’

(…) Without restaurants to visit and trips to take, Americans bought out stocks of cars, appliances, furniture and power tools. Manufacturers have been trying to catch up ever since. Nearly a year since initial coronavirus lockdowns in the U.S., barbells, kitchen mixers, mattresses and webcams are still hard to find. A global shortage of semiconductors has forced many car makers to cut production in recent weeks. (…)

Consumer spending on long-lasting goods in the U.S. rose 6.4% last year but domestic production of those goods fell 8.4%, according to federal data, leading to shortages and higher prices.

(…) companies are placing supersize orders to compensate for the extra time it takes to procure supplies from factories and freight operators constrained by global efforts to contain the coronavirus. That’s exacerbating the strain on supply chains. (…)

“The global supply chain is not as strong as people thought,” Mr. Pin said. (…) “The entire supply chain was stressed in 2020 and is still in a bad spot,” founder Bill Henniger said. “The machinery, workforce and facilities are all running 24 hours a day.” (…)

Stanley’s tools business reported a 57% increase in profit for the fourth quarter on a 25% increase in sales, partly fueled by its ability to boost prices. Sales of electric sanders so far during the first quarter of 2021 are fourfold higher than the same time last year. (…)

Mr. Greenblatt said finding steel in the U.S. to increase his production has been a challenge. Prices for steel, copper and other industrial commodities are at the highest point in years. That is putting pressure on profit margins for Marlin and other manufacturers. (…)

The reduction in domestic production of specialty metals including stainless steel is even more acute. By the end of the year, just three companies in the U.S. will supply stainless steel. (…)

Domestic steel prices have risen more than 160% since last August, leaving steel consumers in a quandary – whether to absorb or pass along the increased cost.

“We’ll be lucky if we break even at this price,” said Stuart Speyer, president at Tennessee-based Tennsco. Steel costs for the manufacturer of lockers, bookcases and cabinets are up 98% in the past six months.

Whirlpool last month said increased steel costs would shave 150 basis points from its profit this year. Farm equipment maker AGCO and crane maker Terex have announced price increases to offset material costs. (…)

U.S. steel prices are 68% higher than the global market price and almost double China’s, even with prices in both China and Europe up over 80% from their pandemic-induced lows.

The price gap is so wide that even with a 25% tariff, it would be cheaper to import than buy from domestic mills. The United States imported 18% of its steel needs last year.

Logistical challenges, like container shortages, and thin overseas supply are keeping imports in check. But some distributors expect imports to pick up by June if the domestic market remains tight. (…)

How AIT hesitancy can turn into JPOWs taper tantrum

It is very easy to defend an average inflation targeting regime as long as you are not overshooting. BUT (!) will it be as easy when core inflation prints around 2.75% by summer? We doubt it, which is why a taper tantrum 2.0 is a clear risk. (…)

There are reasons to be more structurally upbeat on inflation this time around compared to earlier reflationary cycles. China’s output prices are rising, supply chains have been disturbed, freight rates are elevated, but more importantly the policy mix has changed. Mechanisms that ensured a transfer of freshly printed USD to households/corporates were put in place through most of 2020, not least due to direct transfers of money but also due to publicly backed credit programmes. QE is not inflationary unless the USD or EUR actually reach the real economy, which actually happened in 2020. Bidenomics may further reflate this story, with even bigger direct cheques in store for the average American household.

(…) As long as bond yields rise for the right reasons, then they will be allowed to go higher. In other words, if spreads remain compressed, equity multiples (forward P/Es) increase and inflation expectations increase, then higher bond yields will be accepted. So far so good; of course the cocktail of higher long bonds yields, higher multiples and lower spreads will not last forever, but it may continue in a peaceful way until the re-opening actually happens, and therefore the Fed may be stuck behind the curve, if they actually want to prevent a tightening of financial conditions. (…)

The Fed keeps repeating that the “appropriate monetary policy will likely aim to achieve inflation moderately above 2% for some time”, but we are not any wiser on what exactly that means after the FOMC minutes this week. This is the KEY question for 2021 and it will be tested as early as in Q2. Will the Fed for example accept core inflation overshooting by e.g. 0.5-0.75% point? (…)

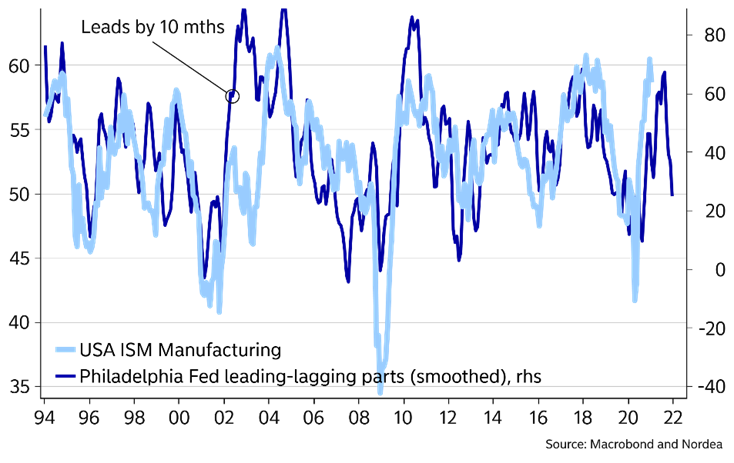
No matter whether the Fed actually takes the decision to taper purchases (or decide to sound “hesitant” on accepting too much inflation overshooting), the mere risk of it happening will influence markets into Q2, and several of our leading indicators have already started to warn of peakish key figure momentum by the middle of this year, with potential new setbacks into 2022, not least as the impulse from higher rates and energy prices will dampen momentum 9-12 months from now. (…)

Some trouble brewing during H2-2021 according to our Philly Fed subcomponent indicator

BTW, FYI, simple exercise assuming CPI and Core CPI rise 0.2% MoM throughout 2021: CPI reaches +3.3% YoY in May and retreats to +2.5% in December; Core CPI reaches +2.5% in May and retreats to +2.2% in December. Get ready to hear the word “transitory” ad nauseam.

Nordea continues:

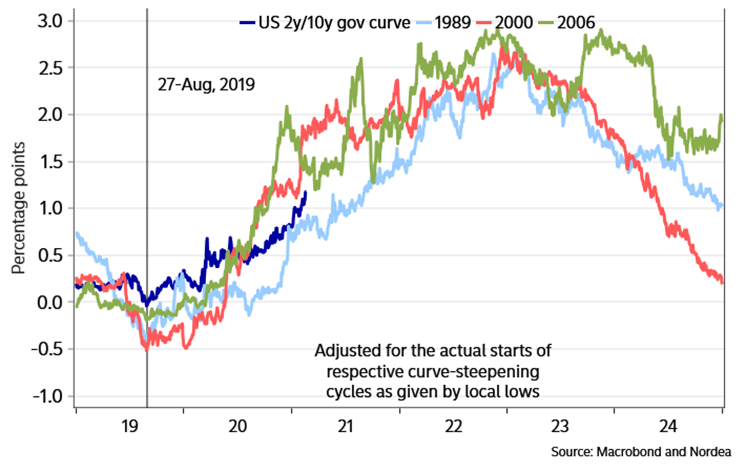
All of the above will furthermore be unfolding amidst talking points such as a “roaring 20s” and “cracks in secular stagnation”. And the US curve isn’t that steep, so why not just keep your steepeners on and hope for the best? That’s what we would do.

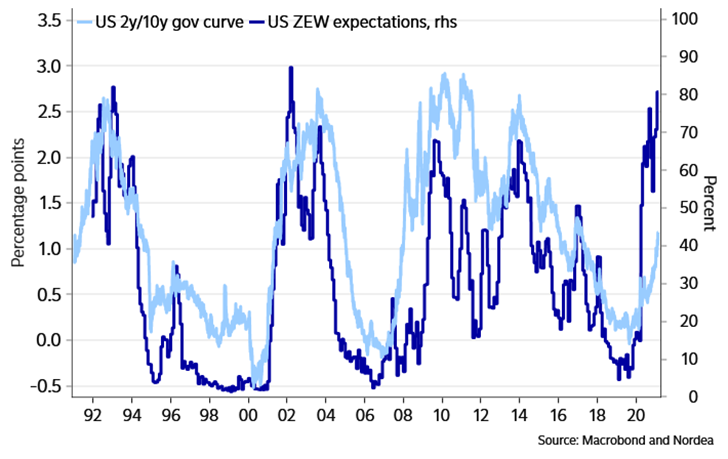
US curve lagging behind sentiment survey indicators

If for instance the Fed manages to tighten policy by a cumulative 225bps as they did in the last tightening cycle, why shouldn’t the curve look at least as steep as during that cycle? (AIT and MMT-like politics if anything suggest even more risk premiums today than back then, we believe). The last time we had US ZEW expectations at today’s stellar levels – in 2002, the curve traded at 170bps and was on track for a move to 275bps(!).

Not even half-way there, given previous big steepening trends

  • Mind the gap between the PMI and the US10YR. The gap is impressive. The 10-year US Treasury Yield has further to rise.2. Tactical turning point: manufacturing is reaccelerating. Without central bank intervention, the 10y Treasury yield would be close to 3%. (The Market Ear)

And while Nordea is “clearly on the US outperformance side of the [EUR/USD] bet over the coming 6-9 months”…

In the longer run, we are not too upbeat on the dollar. Did you for instance notice that the CNY’s share of global swift payments rose to its highest share since 2016 in January? And what if China is successful in its DC/EP roll-out (which we will hear much more about around the Winter Olympics of 2022)? We actually see four reasons why the dollar smile could move to the dollar’s detriment over the coming decade: i) Biden “bananafying” the Fed, ii) China’s DC/EP and the weaponisation of the dollar, iii) energy politics, iv) regulation and taxes. You can read more on the dollar smile and its future here.

John Authers: How Much Do Central Banks Fear the Bond Toddler? So far, it looks like they will give the market what it wants.

(…) Markets are looking for a parental response. Central banks have said they are going to leave rates lower for longer this time. Do they really mean it? If yields go up half a percentage point in short order (the monetary equivalent of threatening to scream until you’re sick), will central banks relent at the risk of an even bigger tantrum next time, or opt to draw the disciplinary line, and put up with the screaming?

We’ve had two skirmishes between central bankers and markets already this week, with another to follow Tuesday as Federal Reserve Chairman Jerome Powell testifies to Congress. So far, it looks as though all of them will opt for giving the market what it wants, and risking spoiling the child. (…)

[Monday, Christine Lagarde] told the European parliament that the ECB was would maintain “favorable financing conditions” throughout the pandemic period. “Banks use those yields as a reference when setting the price of their loans to households and firms,” Lagarde said. “Accordingly, the ECB is closely monitoring the evolution of longer-term nominal bond yields.”

(…) That leads to the widespread presumption that Powell will have to say something to pacify the markets when he talks to Congress (…).

There is a rotation going on within the market, but it isn’t affecting the overall level of equities. While this continues to be true, the Fed won’t be too alarmed. It is when bond yields have risen too much for the stock market that they will also have risen too much for the Fed. So the chance of any fresh policy action or new money that hasn’t already been announced is very low.

CONSUMER WATCH

Sales have bounced back from the April low, but will likely be down around 7% year-over-year in February. The weather has impacted sales this month. The Wards forecast of 15.6 million SAAR, would be down about 6% from January.

CHINA WATCH

The Market Growth Services sector Index is now at a 42 month high, although the manufacturing sector Index remains some way behind.

The Sales Growth Index backs up the buoyancy of business confidence, with data relating to actual revenues as opposed to beliefs about the future. Both Manufacturing and Services Indexes show very positive numbers well above the 50 “no growth” line.

Unlike in the USA, where price movements are starting to look suspiciously like turning into renewed inflation, prices appear more under control in China, and indeed in the manufacturing sector are actually falling as production is ramped up.

However, the Jobs Index does not suggest that recruitment levels are back to pre Covid levels in the manufacturing sector. As in the USA, it appears that the experience of Covid has left many companies still very cautious and as yet  reluctant to recruit. However in the Services sector the Jobs Index is now at an 80 month high, reflecting the recovery to positive  levels of the Sales and Market Growth Indexes.

ISRAEL WATCH

A new WATCH given Israel’s huge lead in vaccination, perhaps offering clues for the ROW.

(…) The rise in the rate of saving, despite the high level of unemployment in the Israeli economy, which reached 18% in January, is a probably a result of two parallel forces. One is the money that the government distributed to all citizens indiscriminately last year, because it was unable to distinguish between those in need of aid and those who were not. The other is the lockdowns, which reduced private consumption by more than 9% in 2020. (…)

The Central Bureau of Statistics figures show that net saving by households in Israel in 2020 rose to a record 31.2% of disposable income. For the sake of comparison, in 2019, the rate of private saving was 21.3% of disposable income. Elsewhere in the world, saving rates were lower. In Canada, for example, the rate of saving as a proportion of disposable income was 15% in 2020 and 6.7% in 2019, and in the US the figures were 13.7% and 7.5%. (…)

(…) Between the end of that lockdown [April] and last November, home prices rose by 3.6%, giving an annualized rate of increase of 6%, much of which, as mentioned, occurred starting from the second lockdown. (…)

The housing prices index, which is separate from the CPI, continued to rise in the period November-December, in comparison with October-November, climbing by 0.9%, after rising 1%% the previous month. Housing prices have risen 4% over the past 12 months.

The prices of new homes rose by 0.5% in November-December, in comparison with October-November, and have risen by 3.1% over the past 12 months.

Tech Stocks Drop Amid Rising Bond Yields The Nasdaq Composite declines as rising government-bond yields prompted concern that technology shares are looking too expensive.

Market divergence continues

The benchmark 10-year Treasury yield rose to 1.37%, a fresh one-year high, showing investors remain bullish on the economy and a recovery in inflation. (…) Along with the jump in bond yields, oil jumped by nearly 4%, gold and silver rose and commodities rose to their highest in almost eight years, as investors continued to buy assets that will benefit from reduced COVID-19 cases and a growing economy.

unnamed - 2021-02-23T073412.498

Data: FactSet; Chart: Axios Visuals

  • The stock market’s highest flyers remain under pressure this morning. Futures for the tech-heavy Nasdaq 100 dropped 1.5%, after the index slumped 2.6% in trading yesterday on a selloff in some of the hottest pandemic buys such as Peloton Interactive Inc. which sank 10%. Tesla Inc. shares are set to tumble again at the open with futures trading well south of $700. CEO Elon Musk’s bet on Bitcoin also took a hit with the cryptocurrency dropping significantly again this morning. (Bloomberg)
Yellen Favors Higher Company Tax, Signals Capital Gains Worth a Look

Treasury Secretary Janet Yellen said President Joe Biden favors boosting taxes on companies, and signaled openness to considering raising rates on capital gains, while steering clear of a wealth levy.

“A wealth tax has been discussed but is not something President Biden” favors, Yellen said at a virtual conference on Monday hosted by the New York Times. She said such a tax would have significant implementation problems.

The administration is looking to boost the corporate tax to 28%, Yellen said. The Treasury chief said last week that revenue measures would be needed to help pay for Biden’s planned longer-term economic reconstruction program to help address concerns about debt sustainability.

Yellen also said that a hike in the capital-gains tax might be something “worth considering.” Asked about a financial-transactions tax, she said, “One would have to examine closely what effect it would have” on ordinary investors. (…)

Yellen separately signaled the Biden administration supports research into the viability of a digital dollar. “Too many Americans don’t have access to easy payments systems and banking accounts, and I think this is something that a digital dollar, a central bank digital currency, could help with,” she said.

  • Treasury Secretary Janet Yellen said “people should be aware” of bitcoin’s extreme volatility, saying it’s “an extremely inefficient way to conduct transactions” and calling the amount of energy needed to mine bitcoin “staggering.” (New York Times)
COVID-19
  • In the U.S., the latest vaccination rate is 1,365,820 doses per day, on average. At this rate, it will take an estimated 10 months to cover 75% of the population with a two-dose vaccine. (…) So far, 44.1 million have received at least one dose. At least 19.4 million people have completed the two-dose vaccination regimen. Globally, the latest vaccination rate is 6,242,182 doses per day, on average. At this rate, it will take an estimated 5 years to cover 75% of the population with a two-dose vaccine. (Bloomberg)
  • The vaccines are working

Long-term care facilities have been responsible for 35% of all coronavirus deaths in the U.S., despite accounting for less than 1% of the population. (Axios)

unnamed - 2021-02-23T073745.334

Data: The COVID Tracking Project. Chart: Michelle McGhee, Andrew Witherspoon/Axios

THE DAILY EDGE: 22 FEBRUARY 2021: Supply And Demand

Supplying more demand:

Democrats begin the final push for President Joe Biden’s $1.9 trillion stimulus bill this week, dropping any pretense of bipartisanship to quickly pass the package before an earlier round of benefits runs out.

This will be the first real test for Democrats’ full control of government since former President Donald Trump’s impeachment trial, with implications for the rest of Biden’s agenda and the pandemic-battered economy. The House plans to vote as soon as Friday on Democrats’ stimulus package, setting up a Senate vote as soon as next week. (…)

“The Senate is on track to send a robust $1.9 trillion package to the president’s desk before the March 14 expiration of unemployment insurance benefits” from the last round of stimulus, Senate Majority Leader Chuck Schumer said in a Friday letter to colleagues. “We will meet this deadline.” (…)

Democrats have said they didn’t have time to negotiate with Republicans. The current federal unemployment supplement of $300 per week expires March 14, though some jobless individuals will continue to receive benefits until April 11. Missing this deadline would cut off assistance for more than 10 million people.

With that in mind, Democrats are using a fast-track budget procedure to enact the bill without needing at least 10 Republicans. That means, though, the bill must comply with instructions in the recently adopted fiscal 2021 budget resolution, the total cost can’t exceed the $1.9 trillion, and all provisions must be fiscal in nature. (…)

KEY PROVISIONS IN THE $1.9 TRILLION PLAN

  • $422 billion for stimulus checks to individuals
  • $246 billion for supplemental unemployment insurance
  • $350 billion for state and local governments
  • $160 billion to combat virus, including vaccines, testing, tracing
  • $130 billion to reopen K-12 schools
  • $7.25 billion for small business via Paycheck Protection Program

The vaccine developed by Pfizer Inc. and BioNTech SE generates robust immunity after one dose, according to new research out of Israel, and further data showed that the University of Oxford and AstraZeneca PLC vaccine similarly prevented Covid-19 when doses were spaced three months apart.

The findings could boost arguments in favor of delaying the second dose of the two-shot vaccine, as the U.K. has done. They could also have substantial implications on vaccine policy and distribution around the world, simplifying the logistics of distribution. (…)

Rival vaccines are still easier to store. Moderna Inc.’s vaccine can be stored at standard freezer temperatures for up to six months and remain refrigerated for up to 30 days. Johnson & Johnson’s vaccine, which U.S. regulators are weighing authorizing and which has been shown to safely protect against Covid-19, can be kept in normal freezers for up to two years, with at least three months in the fridge. (…)

The Pfizer Inc. and BioNTech SE Covid-19 vaccine appeared to stop the vast majority of recipients in Israel becoming infected, providing the first real-world indication that the immunization will curb transmission of the coronavirus.

The vaccine, which is being rolled out in a national immunization program that began Dec. 20, was 89.4% effective at preventing laboratory-confirmed infections, according to a copy of a draft publication that was posted on Twitter and confirmed by a person familiar with the work. The companies worked with Israel’s Health Ministry on the preliminary observational analysis, which wasn’t peer-reviewed. Some scientists disputed its accuracy. (…)

“That means that the true reduction in transmission is lower than the estimate of 89.4%,” McLaren said. “How much lower? We need more evidence to know for sure. But I expect that, once we account for the bias, we’ll still find that this vaccine does reduce transmission. And that would be very good news.” (…)

If confirmed, the early results on lab-tested infections are encouraging because they indicate the vaccine may also prevent asymptomatic carriers from spreading the virus that causes Covid-19. (…)

Separately, Israeli authorities on Saturday said the Pfizer-BioNTech shot was 99% effective at preventing deaths from the virus. (…)

U.S. Flash Composite PMI: Price gauges hit record highs as businesses report fastest growth for almost six years

Businesses in the U.S. reported the strongest monthly expansion in output for almost six years in February, spurred by accelerating service sector activity and sustained robust growth of manufacturing output.

Adjusted for seasonal factors, the IHS Markit Flash U.S. Composite PMI Output Index posted 58.8 in February, up slightly from 58.7 in January. The upturn was the sharpest since March 2015.

image

Service sector growth hit the fastest since March 2015, with firms often reporting higher activity as virus-related restrictions were partially eased and inflows of new business picked up, notably among domestic customers. Exports of services fell, largely reflecting ongoing restrictions on travel and tourism.

While manufacturing output growth moderated during the month, it remained among the highest seen over the past decade, thanks to a further marked increase in new orders and exports.

The slower manufacturing growth was often blamed on extreme weather and existing widespread supply shortages. Supplier delays hit a record high during the month.

Input costs across manufacturing and services soared higher as demand outstripped supply, rising at by far the steepest rate since comparable data were first available in 2009. Service providers registered the steepest increase in cost burdens since October 2009, while manufacturers recorded the quickest rise since April 2011.

As a result, firms raised their selling prices at the sharpest rate on record (since October 2009), with panellists stating the increase was due to the partial pass-through of greater costs to clients.

In line with strong demand conditions, firms registered another monthly increase in backlogs of work. Nonetheless, employment growth remained relatively muted, as service providers were reluctant to expand workforce numbers amid efforts to cut costs and uncertainty about the near-term outlook due to the pandemic. Manufacturing job creation accelerated, however, reaching the highest for just over three years.

Meanwhile, business confidence remained upbeat and among the brightest seen over the past two years, albeit down from recent highs. Although service providers noted slightly weaker expectations, manufacturing firms signalled the strongest degree of confidence for three months.

The seasonally adjusted IHS Markit Flash U.S. Services PMI™ Business Activity Index registered 58.9 in February, up from 58.3 in January. The rise in business activity was the strongest for almost six years, as service sector firms noted greater client demand.

Driving the faster increase in output was a steeper expansion in new business. The rate of growth was the sharpest for three months. That said, foreign client demand weakened in February, as new export orders fell for the second time in three months amid ongoing coronavirus disease 2019 (COVID-19) restrictions.

Substantial price increases for inputs such as PPE led to the fastest rise in cost burdens since data collection began in October 2009. That said, more encouraging demand conditions allowed firms to pass on a greater proportion of the cost increase to clients through a marked rise in selling prices. The rate of charge inflation was the second-fastest on record (behind only November 2020).

Service providers continued to expand their workforce numbers only marginally in February, however, amid efforts to control outgoings. Pressure on capacity was evident nonetheless, as backlogs of work rose modestly.

Ongoing COVID-19 restrictions led to hesitancy regarding the year-ahead outlook, as service providers registered softer output expectations.

Manufacturing firms signalled a marked improvement in operating conditions in February, as highlighted by the IHS Markit Flash U.S. Manufacturing Purchasing Managers’ Index™ (PMI™) posting 58.5, down slightly from 59.2 in January. The headline index reading was buoyed in part due to a substantial deterioration in vendor performance (ordinarily a sign of improving manufacturing conditions).

Although expansions in production and new orders softened, rates of growth were still steep overall, as manufacturers noted stronger client demand. New export orders also rose further, and at a solid pace.

Nevertheless, supply chain disruption remained apparent, as suppliers’ delivery times lengthened to the greatest extent since data collection began in May 2007. Key raw material and component shortages, alongside transportation delays, were often cited as factors behind worsening vendor performance. Longer lead times also led to declines in stocks of purchases and finished goods.

As a result, cost burdens were pushed higher. The rate of input cost inflation was the sharpest since April 2011, while firms raised their selling prices at the fastest pace since July 2008 in an effort to partially pass on greater input prices.

A strong rise in backlogs of work led firms to increase employment in February. The rate of job creation was the quickest since December 2017.

Finally, output expectations among manufacturers improved in February. The degree of optimism was the highest since November 2020 amid hopes that client demand will remain strong and COVID-19 restrictions will come to an end during 2021.

Robert Brusca analysed these 2 very different trends for Haver Analytics:

 image image

(…) These are extremely unusual dynamics. (…) The graphic clearly shows that in EMU the virus struck and then manufacturing recovered and built its progress steadily. For services the virus struck, the sector rebounded, but could not sustain itself and has had ongoing erosion.

The U.S. situation has been different and it has been fed by rounds of government stimulus and special programs. This intervention has succeeded in putting both sectors into ongoing improvement and recovery. Still, it has been an expensive process and there are still some who have fallen through the cracks. The U.S. and Europe now are having very different recoveries despite being buffeted by very similar forces.

Caveat: I have taken these data at face value to analyze them. However, with so many service sector firms shuttered and out of business in the U.S., this diffusion index is subject to how the collection agency treats non-respondents. It is somewhat suspicious that the U.S. shows such incredible strength in the services sector with some 10 million people (mostly service sector workers) still unemployed and with countless businesses- many of them small businesses- closed. I am somewhat suspicious of the very high readings in the services sector. Although remember that these are only breadth statistics and even if the sector is smaller if the breadth is better the diffusion index will be higher.

U.S. Existing Home Sales Edge Higher in January and Supply Tightens

The market for previously owned homes remains strong. The National Association of Realtors (NAR) reported that sales of existing homes rose 0.6% (23.7% y/y) during January to 6.690 million (SAAR) from 6.650 million in December, revised from 6.760 million. November sales also were revised lower to 6.590 million from 6.710 million. The Action Economics Forecast Survey expected January sales of 6.65 million. Data are compiled when existing home sales close.

Housing supply continues to decline. The number of homes on the market fell 1.9% (NSA) last month (-25.7% y/y) to a record low of 1.04 million units. (The figures date back to January 1999.) The months’ supply of homes on the market remained at the record low of 1.9 months, below a recent high of 4.6 months in May and 10.4 months averaged during all of 2008.

Sales were mixed last month across the country. In the South, sales increased 3.2% (25.1% y/y) to 2.940 million units after a 1.1% December rise. Sales in the Midwest gained 1.9% (22.7% y/y) to 1.570 million after improving 0.7% in December. To the downside, exiting home sales in the West weakened 4.4% (+21.3% y/y) to 1.310 million after slipping 0.7% in December. In the Northeast, sales were off 2.2% (+24.3% y/y) to 870,000 units after a 3.5% December rise.

The median price of an existing home fell 1.7% (+14.1% y/y) to $303,900, the lowest price in six months. (…)

Sales of existing single-family homes improved 0.2% (23.0% y/y) to 5.930 million units after gaining 0.7% during December. Sales of condos and co-ops rose 4.1% (28.8% y/y) to 760,000 units after December’s 2.8% increase. The increase left sales at the highest level since December 2006.

 image image

MORE DEMAND AND SUPPLY

Demand issue:

Crude prices may rally faster and harder than previously thought. So says Goldman Sachs, which noted that a demand recovery will outpace any supply response from OPEC+, shale and Iran. The bank sees consumption getting back to pre-virus levels in July and raised its Brent price forecast by $10 a barrel for the second and third quarters.

Supply issue:

The New Commodity Super Cycle May Not Have Wheels Short-term imbalances between supply and demand may justify a 10-year high for copper prices, but staying there would prove more challenging

(…) During that post-financial-crisis surge in copper prices, China began perhaps the most rapacious expansion of construction in its history: The amount of real estate floor space on which construction began rose by more than 40% in 2010. In 2011, real estate starts were more than twice what they were in 2007.

There is little prospect of a repeat performance now. China’s recovery owes more to its near-eradication of Covid-19 for most of 2020 than the sort of no-holds-barred stimulus seen in the U.S. and other developed economies. Indeed, Chinese M2 money supply rose slower than that of the U.S., eurozone, U.K. or Japan last year. The government is concerned with the leverage of major real-estate companies, and households in general, and won’t permit another debt-driven surge in building. Nor is there likely to be a boom in infrastructure investment above what was expected before the pandemic. (…)

The metal is needed for electric and hybrid vehicles. But that doesn’t explain why copper is up 45% from pre-pandemic levels, when those long-term applications already were well-known—nor why it is rallying with oil, which certainly won’t benefit from a more decarbonized future. (…)

A short-term supply gap is a more logical explanation for surging prices, and Goldman Sachs analysts suggest weak copper production could continue, in part due to lockdown conditions in Peru. But that imbalance won’t last forever. (…)

Like always in commodities, price eventually solves any demand/supply problems.

  • Bloomberg: “The UAE, Russia and Iraq have substantial spare capacity and are likely candidates to seek increases. If output-cut fatigue grows, things may get very ugly, very fast.”

Here’s a demand/supply combo, focused on the Eurozone but likely universal:

One concern is the further intensification of supply shortages, which have pushed raw material prices higher. Supply delays have risen to near-record levels, leading to near-decade high producer input cost inflation. At the moment, weak consumer demand – notably for services – is limiting overall price pressures, but it seems likely that inflation will pick up in coming months.

unnamed - 2021-02-22T082422.483

Demand:

Bubble Warnings Go Unheeded as Everyone Is a Buyer in Stocks

Equity funds are drawing fresh money at an unprecedented pace and hedge funds are boosting their stock exposure to a record. Companies themselves are re-emerging as big buyers, with share repurchases doubling from a year ago.

The affection underscores growing confidence in an economic recovery, buttressed by government support and vaccines. While aspects of the craze — the growing obsession with penny stocks and options, primarily — are the basis for daily warnings about a bubble, bulled-up positioning is proving a sturdy backbone for the rally. (…)

“It’s been truly amazing,” said Brian Culpepper, a money manager at James Investment Research. “Everyone just thinks the stock market is going to go, go, go,” he added. “Whether it’s herd mentality, or fear of being left behind, that’s what you’re seeing.” (…)

Indeed, a majority of money managers in a Bank of America poll this month viewed the current bull market as being in a late stage. (…)

Bears are almost nowhere to be found, with short sales dwindling to fresh lows amid January’s retail-driven short squeeze. In fact, according to a survey by the National Association of Active Investment Managers, the most-bearish group that typically has a net-short position was 80% long in stocks earlier this month before turning neutral. (…)

Add corporate America to the growing army of buyers. Companies — a reliable ally of the last bull market — were forced to retreat and preserve cash during the 2020 pandemic, but are splurging on their own shares again. Their announced buybacks have averaged $6.9 billion a day this earnings season, the most since at least 2006, according to quarterly data compiled by EPFR. (…)

image

Some supply issues:

Meanwhile, corporate execs are managing their own exposure down:

unnamed - 2021-02-22T081707.056

(…) retail investors are far and away the biggest buyers of SPACs, as a cohort. This won’t surprise anybody who patrols the WallStreetBets forum on Reddit.

unnamed - 2021-02-22T081801.372

And I spare you the number of secondaries…23 new ones just last week.

Sprechen Sie Stonks? Inspired by America’s Reddit brigade, a new generation of stay-at-home investors in Europe are hoping to get rich quick on the next GameStop—one that’s closer to home. Alas, it’s not going all that well over there, Eric J. Lyman reports in a story for Fortune.

Now, that’s demand!

image

What’s happening in bonds exactly? Less demand, more supply? Where’s the Fed?

The bond selloff continues. Ten-year Treasury yields climbed to the highest in about a year and a key part of the curve steepened to the most since 2014 as investors priced in bets for inflation and faster economic growth.

The wrap-up:

My favorite technical analysis service is seeing “selective equity selling emerging”, likely because of “leadership and market cap rotations”. However, broad-based demand remains, “notwithstanding some short-term
turbulence and imperfections”.

How To Get WallStreetBets Realtime Sentiment For Free

(…) There is now a website – call it a Robintrack for the WallStreetBets crowd – called SwaggyStocks.com which scours through the popular forum and publishes “the top trending stocks mentioned by the popular sub-reddit, WallStreetBets, over the last 24 hours.” (…)

While it remains to be seen how useful this data will be to other traders, both retail and institutional, we will remind readers that at one point in the summer of 2020, RobinTrack – which provided a similar view of activity on the notorious Robinhood brokerage, became one of the most popular websites across trading desks before it suddenly stopped publishing any data in August, after Robinhood (or one of its biggest clients winkwink) decided that the value the site was providing was too much to be handed out for free public consumption. Should SwaggyStocks prove to be just as popular and useful, we expect it will similarly disappear.