U.S. Retail Sales Rose Strongly on Stimulus in January Sales rose 5.3% after three consecutive months of declines during the 2020 holiday shopping season
(…) The retail sales increase followed three months of decline during the holiday season, the Commerce Department said on Wednesday. (…) Spending rose across the board, according to the report, including in categories hit hard by social distancing and pandemic-related restrictions, such as bars and restaurants. (…)
The strongest month-over-month retail sales gains came in categories related to home improvement and work-from-home, such as furniture and electronics. (…)
The Federal Reserve Bank of Atlanta’s GDPNow model on Wednesday predicted the economy will grow at a 9.5% seasonally adjusted annual rate in the first quarter, up sharply from a 4.5% estimate a week ago.
Haver Analytics adds:
The retail control group, the component of retail sales used to construct the monthly consumption figures in the national accounts and excludes autos, gas stations, building materials and food services, soared 6.0% m/m (+11.8% y/y), auguring a strong gain in monthly consumption in January to be released on February 26. Consumer spending slowed sharply in Q4. So, the January rebound in retail sales likely means that consumption in the national accounts got off to a great start for the first quarter.
Sales of motor vehicles increased a more modest 3.1% m/m in January (+13.0% y/y). Sales at furniture and home furnishing stores surged 12.0% m/m and sales at electric appliance stores soared 14.7% m/m. Sales of building materials and garden supplies rose 4.6% m/m. Gasoline sales increased 4.0% m/m. Department store sales exploded 23.5% m/m in January after having declined in four of the previous five months. Even though consumers appeared to have returned to bricks and mortar stores in January, sales by nonstore retailers were also very strong, rising 11.0% m/m.
Sales at restaurants and drinking establishments rebounded 6.9% m/m (-16.6% y/y) in January after increased social distancing and new restrictions on in-restaurant dining had led to sharp declines in November (-3.6% m/m) and December (-4.6% m/m). The accelerating pace of vaccinations could initiate a more sustained revival in eating out going forward.
The effects of stimulus (or rescue) checks are easy to spot on these charts of control sales: on a MoM basis, January was up 6.1% following -3.6% in the previous 3 months:


We can expect consumer expenditures (red line below) to turn positive YoY in January given the recent trend in payrolls.

The big debate about consumers saving or spending keeps tilting toward the latter.
- Goldman Sachs economists wasted no time upgrading their forecast, predicting the U.S. economy will grow 7% this year with the unemployment rate falling to 4.1% and core PCE inflation rising to 1.85% by year-end. (Axios)
Are Americans using stimulus cheques to pay down debt? (NBF)
Are American households using the money they receive from the federal government to pay down debt? The general idea that this is the case seems at least partially wrong judging from the most recent data released by the Federal Reserve. Indeed, total household debt increased 1.4% in the last quarter of the year (the fastest pace recorded since 2018Q3), capping a year in which total borrowing rose 3.3%, a number roughly in line with the average for the 2014-2019 period (+3.5%). These figures contrast with
the sizeable deleveraging process that took place following the Great Recession. Recall that total household credit fell at an average pace of 2.2% between 2009 and 2013. This speaks to the effectiveness of Fed policy in the current crisis and the smooth transmission of monetary policies to the real economy in a context where the banking system has been little affected by the pandemic.If household debt continues to rise, its composition is slowly being altered. Since the beginning of the crisis, credit card balances have shrunk no less than 11.7% (-108 billion) but this decrease has been more than offset by a 4.5% rise in residential credit (+445 billion), which includes mortgage debt and HELOCs. As a result, credit card balances now account for just 5.6% of total household credit (the lowest share on record) while residential debt accounts for 71.4% of the total (the highest ratio since 2017Q1).
This transfer of debt towards the residential sector is a good thing for households, as mortgage interest rates are much lower than those paid on credit card balances. And for those worried of seeing past mistakes being repeated in the United States, keep in mind that mortgage loans are now being directed towards the most creditworthy individuals. Case in point, 72% of mortgage loans originated in 2020Q3-Q4 were for people with a credit score of 760 or above. A sharp contrast with the 26% observed during the formation of the real estate bubble (2003-2005).

U.S. Home Builder Index Edges Higher During February
The Composite Housing Market Index from the National Association of Home Builders-Wells Fargo improved 1.2% (13.5% y/y) to 84 during February following January’s 3.5% decline and December’s 4.4% drop. The index reached a record of 90 in November. (…)

The important stat is highlighted below:

Here’s the long-term view, displaying how strong demand is:

U.S. Industrial Production Beats Expectations in January
Industrial production increased 0.9% m/m (-1.8% y/y) in January. The Action Economics Forecast Survey had expected a more modest 0.4% m/m gain. Manufacturing output rose 1.0% m/m (-1.0 y/y), about the same as its average gain over the previous five months. Mining production advanced 2.3% m/m (-11.5% y/y), while the output of utilities declined 1.2% m/m (+6.6% y/y).
Durable manufacturing advanced 0.9% m/m (-1.4% y/y) in January while nondurable manufacturing recorded a stronger advance of 1.2% m/m (-0.2% y/y). Among durables, the largest gain was posted by primary metals (3.9% m/m), while the only declines were posted by nonmetallic mineral products (-1.8% m/m) and by motor vehicles and parts (-0.7% m/m). The output of motor vehicles was reportedly held down by a global shortage of semiconductors used in vehicle components. Most nondurable sectors recorded growth rates in the 1% to 2% range. The only exceptions were the indexes for paper (-0.7% m/m) and for printing and support (-0.6% m/m). (…)
Total industrial production has yet to return to its pre-pandemic levels of early last year. In January, the indexes for about half of the market groups were still below their year-earlier readings. Notably, weakness in the oil patch during most of last year has left the production of energy materials 6.2% below its level of twelve months earlier. (…)
Output of selected high technology equipment rose 1.5% m/m (6.8% y/y) in January, more than reversing the 0.4% m/m decline in December. Excluding these products, overall production expanded 0.9% m/m (-2.0% y/y). Excluding both high tech products & motor vehicles, factory production rose 1.1% m/m (-1.5% y/y).
Capacity utilization for the industrial sector increased 0.7%-point in January to 75.6%. Factory sector utilization also rose to 0.7%-point 74.6%, its highest point since February 2020 and only 0.6%-point below its pre-pandemic level.
Pretty remarkable: manufacturing production has totally recovered its March-April drops and then some (+1.2% since March).

This chart indexes manufacturing IP, employment and hours to January 2020 = 100. Employment should gradually recover with normalization.

U.S. PPI Advances 1.3% in January
The Producer Price Index for final demand rose 1.3% (1.7% y/y) in January following 0.3% in December and 0.1% in November. Energy prices surged 5.1% m/m (-3.0% y/y) in January following a 4.9% advance in December. Food prices edged up 0.2% in January (1.4% y/y), reversing a 0.2% decrease in December. Prices of trade services turned higher by 1.0% (2.3% y/y) after December’s 0.8% decline.
Excluding foods, energy and trade service, the “core” advance was 1.2% in January, with 0.4% in December and 0.2% in November. The Action Economics Forecast Survey had looked for a 0.4% increase in the total index in January with the core rate forecast at 0.2%. (…)

Core PPI is up 1.8% in the last 3 months, +7.4% a.r.. Core Goods are up 1.5% (+6.1% a.r.), while processed goods are exploding.
- Fed officials see greater risk to US economy from low inflation Central bank policymakers debated inflationary trends as Congress weighs Biden’s stimulus plan
- Investors seem to be seeing greater risk to their portfolios from high inflation:

From the Money and Banking blog:
(…) Before we get started, we should say a few words about the mechanism behind last year’s surge in the stock of broad money. Five factors are at play. First, demand for currency rose by 15%, more than double the pace of the previous decade. The 2020 increase was $275 billion. Second, as a precaution early in the pandemic, businesses drew down lines of credit by something in the range of $600 billion. When this happens, the lending bank credits the borrowing firm’s deposit account, which is a part of M2. Third, spurred by fiscal transfers and diminished spending opportunities, household savings skyrocketed, rising by more than $1 trillion. Fourth, the Federal Reserve’s bond purchase programs mechanically boosted both commercial bank reserves (an asset) and (at least initially) customer deposits (a liability) of those who sold securities to the Fed. Finally, with interest rates so close to zero, firms and households faced virtually no opportunity cost of keeping funds in a bank deposit.
Will the 2020 M2 spike lead to substantially higher inflation? As we discuss in an earlier post, the simplest version of monetarism states that controlling money growth is both necessary and sufficient to control inflation. So, if we see money growth rise, then inflation must be on the horizon. The following chart is Exhibit A in the case for this view. Using data for 90 countries on average annual inflation and money growth over nearly four decades, we can see that there are no examples of countries with either sustained rapid money growth and low average inflation or the converse. And, if we were to assume that the 2020 M2 growth rate in the United States were the new average—rather than a temporary spike—then this picture would lead us to anticipate U.S. inflation beyond anything we have seen since the end of World War I.
Average Annual Consumer Price inflation and Broad Money Growth, 1980 to 2017
Source: IMF World Economic Outlook, World Bank, and authors’ calculations.
However, this conclusion is profoundly misleading. First, no one seriously believes that U.S. monetary aggregates will continue to grow rapidly and unabated for years. Consistent with the relative stability of inflation expectations, there seems to be agreement that the 2020 jump is a one-off shock (see the chart here). Second, at low levels of inflation, the short-run link between money growth and inflation is loose, at best. Our recent post shows how in recent years, fluctuations in the two have been pretty much independent. Third, and related to the previous point, low nominal interest rates favor holdings of deposits included in M2. (…)

What is clear from this post is the link between money growth and inflation. What is unclear is how the current bulge in money will get normalized.
NY Fed’s Business Leaders Survey
Covering service firms in New York, northern New Jersey, and southwestern Connecticut
Activity in the region’s service sector continued to decline significantly, though at a slower pace than last month, according to firms responding to the Federal Reserve Bank of New York’s February 2021 Business Leaders Survey. The survey’s headline business activity index rose ten points to -21.5. (…)
The index for future business activity rose eleven points to 32.5, and the future business climate index rose to 34.4, both reaching their highest level since the pandemic began. Just over 50 percent of firms expect activity to expand and conditions to be better than normal in six months. Employment levels, wages, and prices are all expected to rise, and firms expect to increase capital spending in the months ahead.
")

Kraft Heinz, Conagra may raise some product prices as grains, edible oil costs surge
Kraft Heinz Co and Conagra Brands Inc said they may choose to raise prices this year on some products that use wheat, sugar and other commodities that are becoming increasingly expensive due to high demand. (…)
Ingredient and packaging costs represent 60% to 65% of Conagra’s total cost basket, Finance Chief Dave Marberger said on the sidelines of the Consumer Analyst Group of New York virtual conference.
With people on lockdown cooking more at home – and still stockpiling in some parts of the world – prices for commodities like sugar, wheat and soy are surging, forcing food companies to absorb higher costs. (…)
“Where we are seeing (inflation) is in grains and everything related to grains … It’s across the board. Sugar has big inflation; mac & cheese because it has wheat; mayo because it has oil; salad dressing because it has oil; all sweet products like desserts,” Patricio said.
Kraft Heinz – which makes Jell-O, Kraft Macaroni & Cheese and a slew of Heinz mayonnaise products and salad dressings – said it did not increase prices in the most recent quarter, but did cut down on promotions and discounts. (…)
“We’ve got some inflationary pressures coming forward. And we do expect mid-to-high single-digit commodity inflation in the first half. So we have to be at the top of our game in pricing going forward,” Unilever Chief Financial Officer Graeme Pitkethly said on a recent earnings call. (…)
Saudi Arabia Set to Raise Oil Output Amid Recovery in Prices The world’s largest oil exporter plans to increase production, say advisers to the kingdom, a sign of growing confidence in an oil-price recovery.
-
Oil Prices Are Up, but Frackers Stay on the Sidelines—for Now Oil’s recent rise above $60 a barrel will test the willpower of shale companies that pledged to slow drilling and repair balance sheets battered by the pandemic.
(…) In earnings calls this week, shale executives said they are sticking to capital discipline, which has become a mantra of the industry following a yearslong push by investors. Some said they plan to restrain growth this year in spending, drilling and production, anticipating they will reinvest roughly 70% of their cash flows from operations back into drilling, with the rest paying for debt and shareholder dividends. (…)
Global Covid Infections Drop to Slowest Pace Since October Daily fatalities have averaged less than 10,000 over the past five days, down from a peak of more than 18,000 in mid-January.
- BioNTech/Pfizer vaccine is less potent against South African variant Covid-19 jab still works but produces only a third of the antibodies it did for original virus, study finds
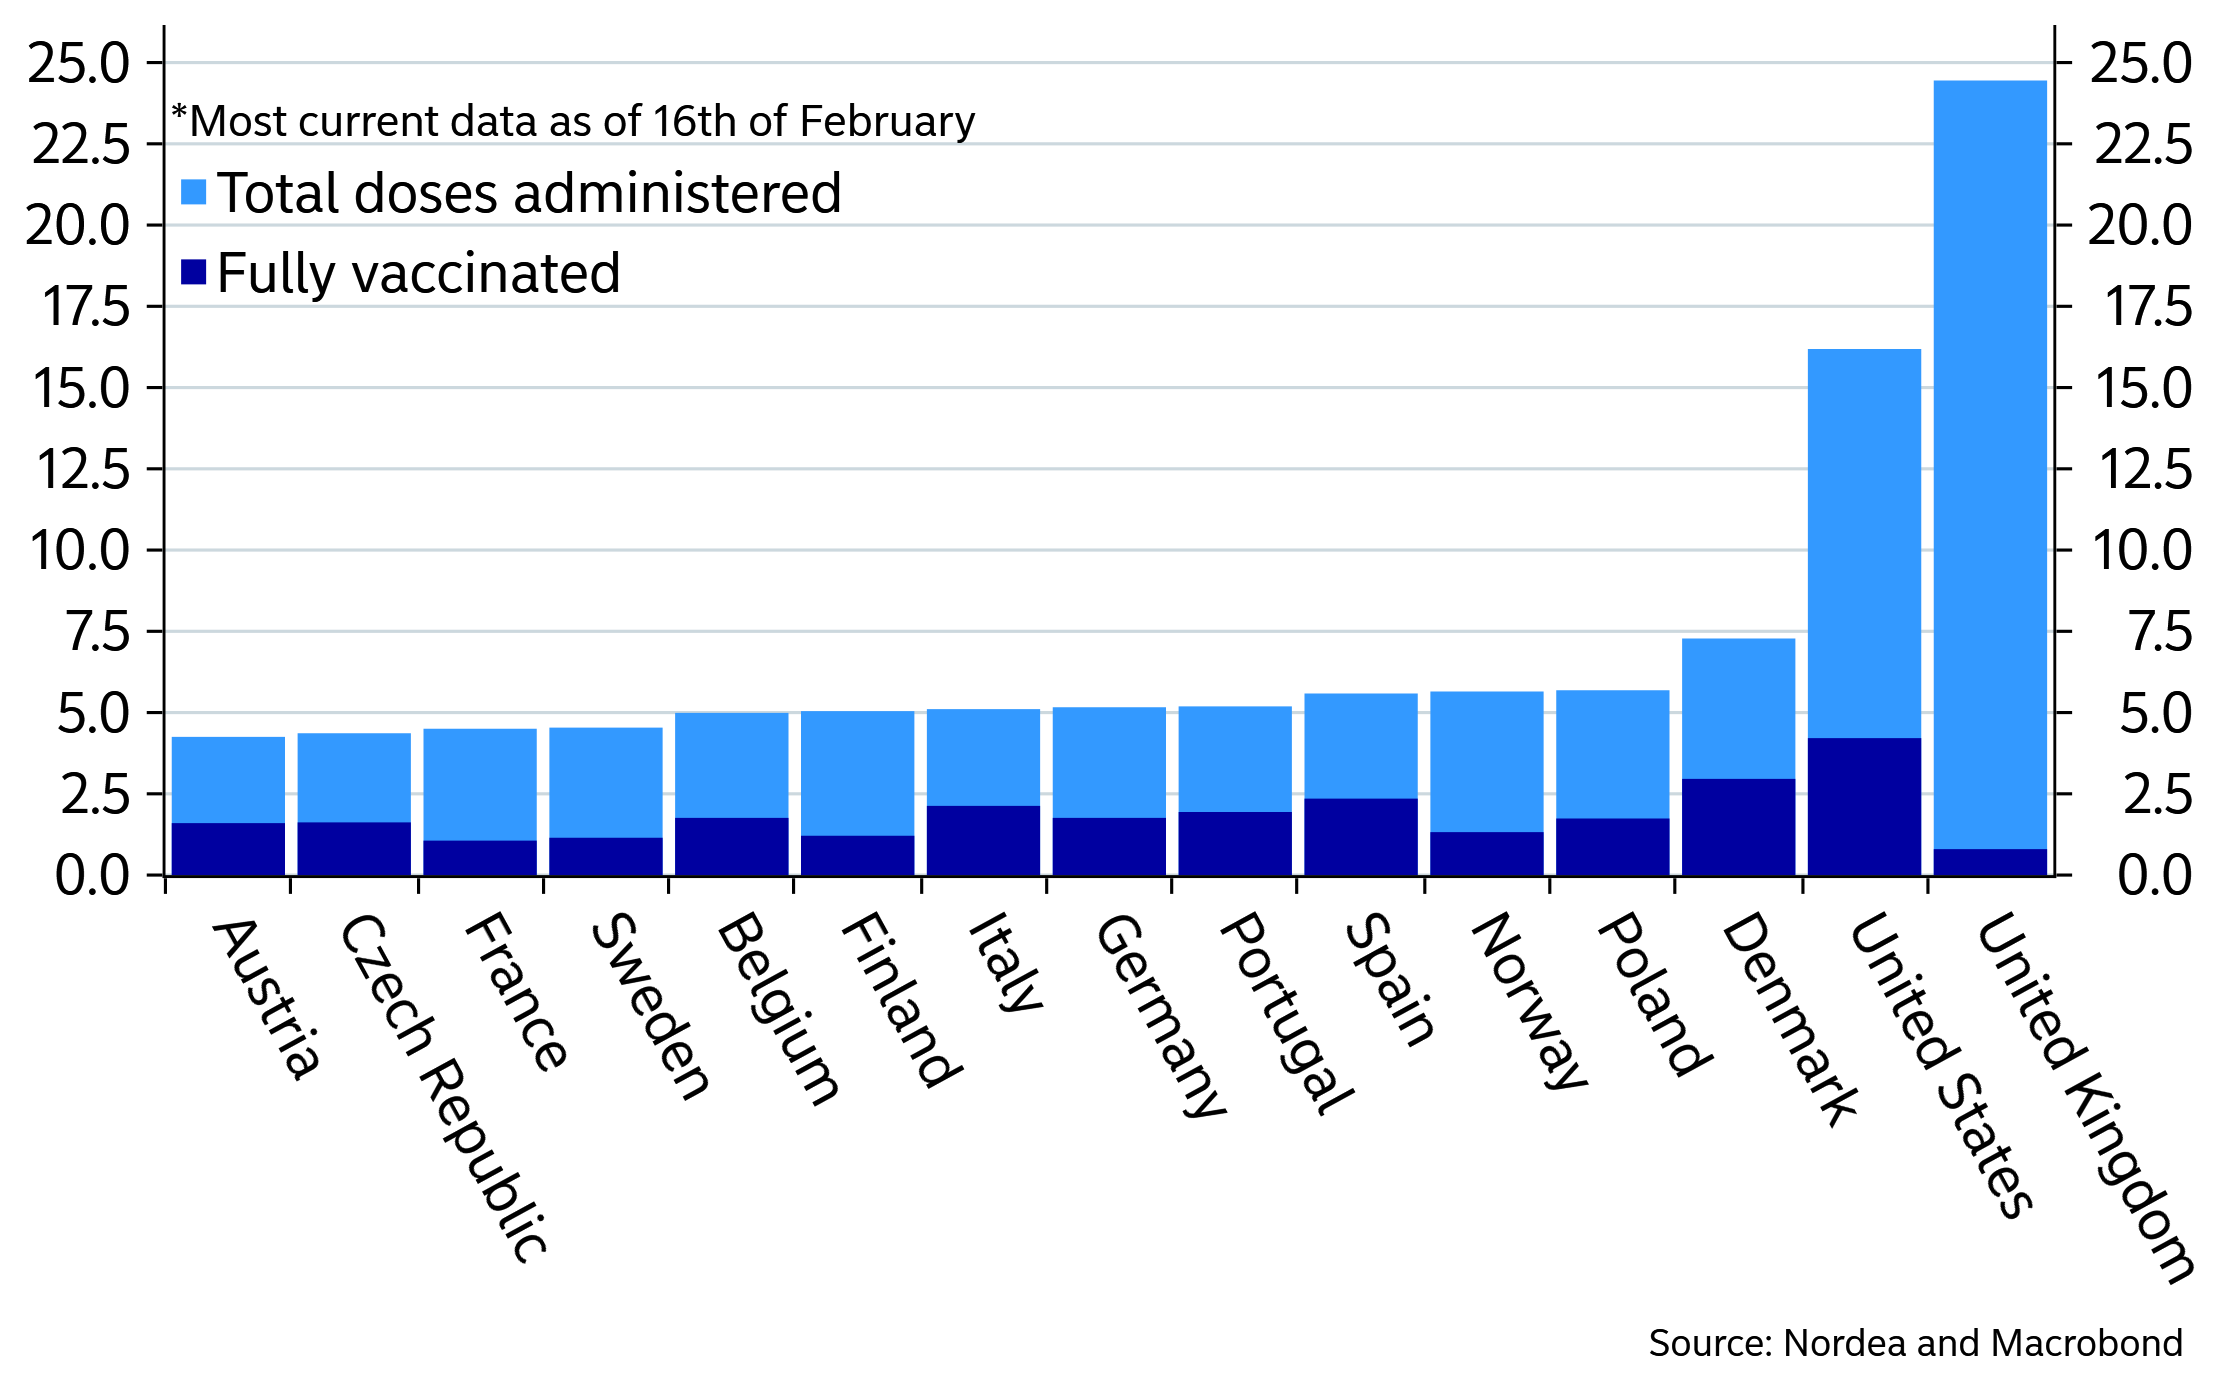
Doses administered and fully vaccinated people as percent of population
US bond sell-off stirs warnings over stock market strength Investors say a further sharp rise in yields would threaten Wall Street’s record run

TECHNICALS WATCH
The 13/34–Week EMA Trend remains bullish as are most other indicators save several very extended sentiment indicators.

From INK Research:
At some point, the rally will run out of steam. We will look to insiders to confirm that we have reached upside exhaustion by watching for a clear bottoming formation in our US Sentiment Indicator. We seem to be near a top in share prices, but we are not there yet. The indicator is at about 22%, approaching the 21.5% level seen back in November 2013 when the market was enjoying the last fumes of QE III before the Fed decided to taper its bond purchases.
To put things in perspective, at 20%, there would be five stocks with key insider selling for every one with buying. Given that we believe the Fed is a long way from tapering, we expect the indicator to easily challenge the 20% level and probably head below. That means stocks will likely continue to climb the wall of inflation worry.

Insiders are loading up on Utes:

Former insider now outsider:
Steven Mnuchin joined the speech circuit, adding his name to a list that includes Prince Harry and Meghan Markle, Bono and Barack Obama. Mnuchin hired the Harry Walker Agency to manage his engagements and will charge about $250,000 to speak in person. A virtual address will set you back as much as $100,000. (Bloomberg)