Travelling week. Will post whatever and whenever possible.
Cutoff of Jobless Benefits Is Found to Get Few Back to Work Prematurely ending federal programs had little effect on employment but sharply cut spending, potentially hurting state economies, researchers say.
A total of 26 states, all but one with Republican governors, have moved to end some or all of the expanded unemployment benefits that have been in place since the pandemic began. The governors, along with many business owners, have argued that the benefits discourage returning to work when many employers are struggling to hire.
Several recent studies, however, have concluded that the extra payments have played only a small role in this year’s labor shortages. And they found at most a modest increase in employment in states that abandoned the programs — most of them in June — even as millions of jobless workers have had to cut spending, potentially hurting local economies. (…)
Data released Friday by the Labor Department provided the latest evidence. It showed that the states that cut benefits have experienced job growth similar to — and perhaps slightly slower than — growth in states that retained the benefits. That was true even in the leisure and hospitality sector, where businesses have been particularly vocal in their complaints about the benefits. (…)
In the most detailed study to date, also released Friday, Mr. Dube and several colleagues used data from Earnin, a financial services company, to review anonymized banking records from more than 18,000 low-income workers who were receiving unemployment benefits in late April.
They found that ending the benefits did have an effect on employment: In states that cut off benefits, about 26 percent of people in the study were working in early August, compared with about 22 percent of people in states that continued the benefits.
But far more people did not find jobs. The researchers had data for 19 states that ended the programs; in those places, they found that about 1.1 million people lost benefits because of the cutoff, and that only about 145,000 of them found jobs. (…)
Cutting off the benefits left unemployed workers worse off on average. The researchers estimate that workers lost an average of $278 a week in benefits because of the change, and gained just $14 a week in earnings. They compensated by cutting spending by $145 a week — a roughly 20 percent reduction — and thus put less money into their local economies. (…)
Overall, states that have ended some or all of the benefits have experienced slightly slower job growth since April than states that have continued the benefits (…). (…) the data suggests that ending the benefits has not led to a surge in job growth. (…)
Jed Kolko, chief economist at the employment site Indeed, looked at more recent data from the same [San Fran Fed] survey and found that the states that have cut benefits have experienced employment growth that was at most slightly faster than in states that kept the benefits. (…)
“It’s among the factors,” said Fiona Greig, co-president of the JPMorgan Chase Institute. “It’s playing a role, but it’s not this on-off switch, where if you turn it off everyone goes back to work.”
Ms. Greig said a variety of other factors could be discouraging people from returning to work, including child care issues and concerns about the coronavirus itself. Those issues may have receded somewhat over the summer, but they could worsen again this fall if virus cases continue to rise. If people lose benefits and don’t quickly return to work, they will have to cut spending — which will hurt their families and the economy overall. (…)
Goldman Sachs’ own analysis concludes that
We find no evidence of a boost to labor force participation—in fact, the estimated effect is negative, but statistically insignificant. This suggests that many workers are staying out for non-financial reasons such as concern about Covid and may be slow to return to the labor force even after UI benefits end.
J.P. Morgan’s job tracker confirms that states cancelling UI benefits don’t seem to enjoy faster employment growth so far:

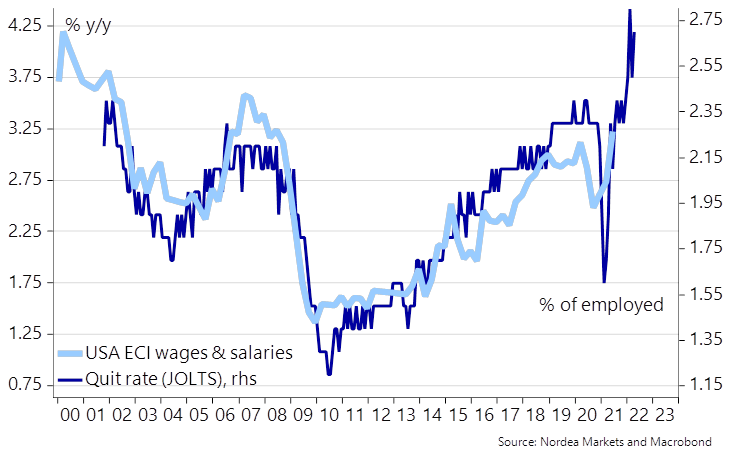
Two implications, none positive: one, the labor market will remain tight longer than expected by just about anybody, including the FOMC. That means slower job growth and more pressures on wages. Two, as extra UI benefits expire, most recipients will need to cut spending.
Overall retail purchases have held up at a high level (+14.2% vs 2 years ago) through mid-August per Chase’s spending tracker…

…but more of the spending is accounted for by rising prices as real retail sales (blue line) have declined 3.9% since April. Real sales are still 11.7% above their pre-pandemic level but the 16.1% annualized drop in 3 months is significant.

Adding to the concerns is that Chase’s job tracker has flatlined in August and has actually declined a little more recently.

Goldman Sachs last week cut its Q3 GDP forecast:
The impact of the Delta variant on growth and inflation is proving to be somewhat larger than we expected. We have lowered our Q3 GDP forecast to +5.5%, reflecting hits to both consumer spending and production. Spending on dining, travel, and some other services is likely to decline in August, though we expect the drop to be modest and brief. Production is still suffering from supply chain disruptions, especially in the auto industry, and this is likely to mean less inventory rebuild in Q3.
BTW, in GS parlance, “somewhat” means cutting the forecast from +9% to +5.5%!
In truth, most forecasters have cut their Q3 GDP estimates in recent weeks. The NY Fed’s Nowcasting Report is at +3.5% for Q3, down from 4.2% on July 30th and 5.4% on June 4th.
But David Rosenberg asks:
Will Q3 Real GDP Print Negative? The consensus view of a massive positive inventory swing for the third quarter better be right. Because it seems to me as though real final sales are going to contract. All we know is history and here it is. The “build in”for Q3 real retail sales is -9% at an annual rate and -12% for housing starts. This is a proxy right here for what is happening to three-quarters of the economy, and they are in a deep hole at the moment. We went back over more than 60 years’ worth of data and found that when these two metrics, in tandem, were down anywhere like this at this stage of a quarter, the average real GDP print was -1.6% at an annual rate and the median was -2.5%. The consensus meanwhile is still close to a +7% annual rate —good luck with that!
The expected inventory rebuild could actually be delayed by the continued world wide supply problems. If manufacturers can’t get their inputs, they cannot output. The latest Philly Fed Manufacturing survey revealed that 39.4% expect to increase their inventories over the next 6 months but only 11.2% did so in August while 29.3% experienced declining inventories.
The global shortage of semiconductors will cut worldwide auto production by as many as 7.1 million vehicles this year, and pandemic-related supply disruptions will hobble the industry well into next year, IHS Markit said.
The lack of chips won’t stabilize until the second quarter of next year, with recovery coming in the second half, IHS said in a report Thursday. The grim outlook is further proof that the chip crisis is far from over. And the research firm’s forecast doesn’t include the latest cuts from Toyota Motor Corp., which plans to briefly pause output at 14 plants next month and slash production 40%. (…)
Low vaccination rates and rising infection rates in Southeast Asia are prompting shutdowns of plants assembling all types of semiconductors, IHS said. Ford Motor Co. said Wednesday it will idle its F-150 pickup plant near Kansas City, Missouri, next week “due to a semiconductor-related part shortage as a result of the Covid-19 pandemic in Malaysia.”
Toyota, which had stockpiled chips and previously had experienced less disruption, cited the Asian outbreak of the delta variant of the virus for its September production cuts. (…)
IHS now sees the chip crisis reducing global auto production by 6.3 million to 7.1 million vehicles this year, not including the Toyota cuts. In the third quarter alone, as many as 2.1 million units could be lost to the chip shortage, IHS said.
The second quarter of 2022 “may be the point at which we look for the stabilization of supply,” IHS said, “with recovery efforts now starting only from the second half of 2022.”
On Friday, VW said that its main plant in Wolfsburg, the world’s biggest car plant with some 60,000 employees, is only going to be running on its early shift after summer break due to the lack of supply. Audi also announced it will pause production temporarily, extending its summer break by one week.
worldwide motor vehicle production

(Statista)
Hmmm…looks like the bond market will prove right…
…at least on the growth part, maybe not on the inflation part: from the same Philly Fed survey:
The firms continued to report increases in prices for inputs and their own goods. The prices paid diffusion index edged up 2 points to 71.2, after falling 10 points last month from June’s 42-year high. Nearly 74 percent of the firms reported increases in input prices, while 3 percent reported decreases. The current prices received index increased 7 points to 53.9, its highest reading since May 1974. Over 56 percent of the firms reported increases in prices of their own manufactured goods, up from 50 percent in July; 40 percent of the firms reported stable output prices.
In this month’s special questions, the firms were asked to forecast the changes in the prices of their own products and for U.S. consumers over the next four quarters. Regarding their own prices, the firms’ median forecast was for an increase of 5.0 percent, the same as when the question was last asked in May. The firms’ actual price change over the past year was 3.0 percent.
The firms expect their employee compensation costs (wages plus benefits on a per employee basis) to rise 4.0 percent over the next four quarters, the same as in May. When asked about the rate of inflation for U.S. consumers over the next year, the firms’ median forecast was 5.0 percent, an increase from 4.0 percent in May. The firms’ median forecast for the long-run (10-year average) inflation rate was 3.0 percent, the same as in May.
Last April, 35.7% of the surveyed manufacturers in the Philly Fed region were raising their prices. That share rose to 51.4% in June and 56.4% in August. And 75.2% currently expect to raise prices again during the next six months, seeing no let down in heir own cost inflation.
John Deere is not based in the Philly Fed region, yet
The world’s largest farm equipment manufacturer, however, said it continues to grapple with inflationary pressure and supply chain challenges, which are set to intensify and expected to persist beyond this year.
The company expects soaring raw material prices and freight rates to cost it about $675 million in its fourth quarter to end-October. Overall, it expects to spend $1.5 billion on raw material and freight in the 2021 fiscal year compared with $500 million estimated in February.
In response, it has raised prices for planters, sprayers, combines and large tractors in North America by about 8%, saying price increases would more than offset higher input costs. (…)
Good for Deere, how about its customers? Permanent or transitory? One month does not make a trend but the ratio went from 2.7:1.0 to 2:1.

The Industrial Materials Price Index, from the Foundation for International Business and Economic Research (FIBER), eased 0.2% during the four weeks ended August 20. The price index has fallen 6.9% since its peak in the second week of May. Despite the weakness, prices were up 24.6% y/y as the manufacturing sector strengthened.
Prices in the crude oil & benzene group led the decline, falling 2.6% in four weeks. The cost of crude oil weakened 5.1% during the same period to $65.95 per barrel. The price peaked at $73.82 early in July. Prices for the petro-chemical benzene fell 3.4% but rose 130.9% y/y. Excluding crude oil, industrial commodity prices improved negligibly in the last four weeks.
Prices in the miscellaneous group fell 1.3% during the last four weeks. Framing lumber prices weakened by 17.8%. Plywood prices were unchanged. Natural rubber prices rose 6.8% in the last four weeks.
Offsetting these declines, metals prices gained 1.2% in the last four weeks reflecting a 6.5% strengthening in aluminum prices. Lead prices also rose 5.5% (25.1% y/y) while zinc prices gained 1.9% in the last four weeks (23.2% y/y). Falling were steel scrap prices by 6.6% in the same period and copper scrap prices eased 1.0%.


The German PPI rose by a brisk 1.9% in July as the PPI excluding energy gained 1.2%. June also saw a better-than one percentage point gain in both the PPI and the ex-energy PPI as did May. In fact, March and April both come close to these marks with month-to-month gains of 0.8% and 0.9% for the headline and ex-energy measures, both. Inflation pressures have become intense and are lasting. There is a ‘nice’ string of price strength here in Germany that may not transmit to the CPI and may not become a problem for monetary policy. Or, then again, it might… (…)
What is clear is that German PPI inflation really is too high and it is accelerating from 12-months to six-months to three-months. The same is true for the CPI and the CPI excluding energy also is too high and it is accelerating from 12-months to six-months to three-months. There is a whole lot of uncomfortable inflation news here. And Germany is not alone in this. It is, more or less, a global phenomenon.
PPI strength is off the map and is showing the strongest 12-month gain since 1975. That’s the strongest gain in 44 years.
(…) we find the core PPI and core CPI prices on a 12-month percentage change basis are correlated at a lowly 0.14 mark and that headline to headline the PPI and CPI are correlated at 0.69, a much higher mark.
However, over the last two years the PPI and CPI headline and core correlations have been higher at 0.79 for the headlines and 0.56 for the core.
(…) we know that under the surface there have been some more permanent changes, a situation that would make us all a bit more skeptical in declaring that ‘we know.’ But central bankers imbue their view with a sense of certainty that I think is simply unfounded. Perhaps they think that if we believe what that they know is true we will shift our beliefs… (…)
For now, what we can see is that inflation pressures are cooking across timelines and across inflation measures. In the U.S., in its recent minutes the Fed’s FOMC members discuss price trends and refer to them as concentrated in a few products or industries. But when I run statistical screens on all the CPI components, I get results that see inflation at or above 2% in a very broad way. Inflation at or about 2.5% is less broad way but still a dominant trait for over 60% of the CPI items. Inflation is above 3% in more than half of the CPI categories, to boot. That is not a small or isolated group. And 3% inflation over 12 months is not low inflation when the target is 2% even on ‘average.’ Moreover, inflation expectations in the U.S. are up and the statistical ‘mean’ in the U of M survey for inflation five-years ahead is at 3.8% – last higher over 12-years ago; yet, the Fed calls inflation expectations ‘in sync’ with its target. Really! Over 3.5% for five-years in the future and that is OK?
So I wonder exactly how central bankers are coming to support views that I do not seem to be able to identify on my own. Pardon me If I remain suspicious of the Fed’s constant denial of inflation reality and if I focus on its ‘forecasts’ from 2015-2018 when it led us astray. By thinking – AGAIN- that current inflation reality is wrong and its forecast is right, the Fed is once again substituting a view of reality for reality. It is once again doing the same thing, finding a distraction from current reality to dismiss what is a perfectly valid and entrenched inflation trend in order to ignore it. For European and German conditions, things are not as distorted as in the U.S. But the denial is still there. Central bankers playing ‘let’s pretend’ is always dangerous. It’s more like Russian roulette with no empty chambers- best not to go there at all. Stick with what you know to be true. Hedge-bet your hypothesis; do not put all your chips in the middle on a guess. Be wary of dismissing a reality that is uncomfortable. But that is not the current policy gambit so we all are at risk and can only hope that central bankers will play a strong end game if the gambit goes poorly.

So, the question to the Fed remains: what do you mean by “transitory” exactly?
Why Inflation Is Scaring Latin America If Not the Fed
(…) Latin America’s policy makers, by contrast, are rushing to reverse ultra-low borrowing costs. In the last five weeks, central banks in Brazil, Mexico, Peru, Chile and even Uruguay have increased rates, while many expect Colombia to follow soon. Latin America was perhaps hit harder than any other region by Covid-19 and is experiencing a quick economic rebound that puts pressure on prices. Other reasons for the difference, though, may have to do with the continent’s high levels of inequality, informality and political instability — together with a history of inflationary bouts deeply etched into the collective economic memory. (…)
Some factors have affected Latin America in particular. For instance, the global rally of food and energy prices has had a disproportionately large impact on the world’s most unequal region: food prices make up a greater share of inflation indexes in Latin America than in advanced economies like the U.S. That means that soaring food prices — beef is up 43% in Brazil — have played a larger role in overall inflation.
Many countries in the region are also net energy importers, and have seen surging gas prices as rising demand has led to tighter global oil markets. Recent social unrest has triggered volatility in some currencies too. There’s a strong tie between prices and currencies in Latin America, and devaluations almost immediately show up in inflation. Meanwhile, governments face continued pressure to sustain increased social spending adopted to combat the jump in poverty caused by the pandemic. The prospect of larger deficits has both soured investors on the currency outlook and increased their inflation expectations, which often causes local businesses to raise prices more and workers to demand higher pay increases in the near-term to hedge against future inflation. (…)
[The region’s central banks] are trying to head off the kind of deterioration in exchange rates that commonly occur in emerging economies when inflation expectations rise. Latin America is already home to four of the six worst performing currencies in emerging markets this year. They’re also reacting to a stronger-than-expected economic recovery — the region is set to grow this year at the fastest pace since 2009. Then there’s an unsettled political backdrop, with violent protests in Colombia, a new leftist government in Peru and fears that Brazilian President Jair Bolsonaro is working to undermine elections next year. (…)
Wall Street sentiment is critical for Latin America, where sovereign bonds and currencies can plunge overnight at the first whiff of political turmoil or pendulum-swings in economic policy. In countries with political risk, accelerating inflation and economies doing well, “it’s about time that we start to take the foot off the accelerator,” says Alberto Ramos, head of Latin America research at Goldman Sachs Group Inc. (…)
Latin America’s economies are notable for high levels of informal jobs — all-cash, low-wage gigs at companies that typically don’t qualify for loans. This portion of the labor force — and employers — is expected to grow even more in the recovery from the pandemic, putting more of the economy out of the formal financial system. And over half the region’s adult population didn’t have a bank account before the pandemic. With so much activity off the books, rate hikes don’t have the immediate impact in Latin America that they often do in the U.S. or Europe. (…)
Brazil’s central bank already forecasts another 100 basis-point rate hike in September with Colombia following soon after. BBVA’s Cuadrado sees most Latin American central banks continuing to raise rates this year. The notable exception is Argentina, which doesn’t follow an inflation targeting system, and isn’t planning to boost rates any time soon despite 52% inflation. Policy makers in Buenos Aires worry a rate hike could actually accelerate inflation because higher interest payments would increase the amount of money in circulation.

EARNINGS WATCH
From Refinitiv/IBES:
Through Aug. 20, 476 companies in the S&P 500 Index have reported earnings for Q2 2021. Of these companies, 87.4% reported earnings above analyst expectations and 9.7% reported earnings below analyst expectations. In a typical quarter (since 1994), 66% of companies beat estimates and 20% miss estimates. Over the past four quarters, 83% of companies beat the estimates and 14% missed estimates.
In aggregate, companies are reporting earnings that are 15.8% above estimates, which compares to a long-term (since 1994) average surprise factor of 3.9% and the average surprise factor over the prior four quarters of 20.1%.
Of these companies, 87.0% reported revenue above analyst expectations and 13.0% reported revenue below analyst expectations. In a typical quarter (since 2002), 61% of companies beat estimates and 39% miss estimates. Over the past four quarters, 74% of companies beat the estimates and 26% missed estimates.
In aggregate, companies are reporting revenues that are 5.1% above estimates, which compares to a long-term (since 2002) average surprise factor of 1.1% and the average surprise factor over the prior four quarters of 3.5%.
The estimated earnings growth rate for the S&P 500 for 21Q2 is 94.7%. If the energy sector is excluded, the growth rate declines to 79.2%. The estimated revenue growth rate for the S&P 500 for 21Q2 is 24.6%. If the energy sector is excluded, the growth rate declines to 20.4%.
The estimated earnings growth rate for the S&P 500 for 21Q3 is 29.7%. If the energy sector is excluded, the growth rate declines to 23.1%.

Not a trend just yet but last week there were as many negative guidance as there were positive. From all you have read so far in this post, you might be inclined to think that there are pressures on P&Ls building up, on both revenues and margins. This next chart may also influence your thinking:
 Source: @topdowncharts
Topdowncharts’ Callum Thomas also offers this totally related chart with his comments:
If you want one chart to capture the current market zeitgeist this one comes pretty close. The great reset of 2020 has triggered increasingly great expectations, particularly so when it comes to earnings…
The data is put together by Refinitiv (I/B/E/S) and represents the consensus of Wall Street analysts. Specifically, this metric is the expected annual increase in earnings over the business cycle – in practice these forecasts typically look 3-5 years out. (…)

TECHNICALS WATCH
My favorite technical analysis firm is getting even more cautious even though it sees this more as a correction, not the end of the bull market. This may only be a thunderstorm, but it is hurricane season and the barometer is falling along with many other indicators.
Bespoke notes that:
At the moment, of the S&P indices based on market cap, only the S&P 500 is currently above its 50-DMA. Meanwhile, the S&P Mid-Cap 400 is trying to move back above and the small-cap S&P 600 is around 3.5% below its 50-day and moving lower. As for the individual stocks of these indices, it is more or less the same story. The S&P 500 has the strongest percentage of stocks above their 50-DMAs at 56.44%. That is down though from a high of 68.91% at the end of last week. Mid and small caps are even weaker with only 36.5% of the S&P 400 above and less than 30% of the S&P 600 above. While this week saw legs lower in the percentage of stocks above their 50-DMAs for each of these indices, we would also note that recent readings are also well below very strong levels that had been observed from late last year through this past spring.
The same goes for the percentage of stocks above their 200-DMAs. For each of these market cap indices, readings around 90% were commonplace for most of the past year, that is, until the past few months and more specifically the past week. Roughly three-quarters of S&P 500 stocks closed above their 200-DMAs yesterday which is the lowest level since early November. Again, that also applies to mid and small caps which have even smaller shares of stocks above their 200-day moving averages at 65.99% and 60.17%, respectively.
(Bespoke)
What this means is that fewer and fewer stocks are keeping pace with the major indices. Nasdaq is also infected:

This is the MSCI World Index:

Here’s the MSCI ex-USA, down 5.6% since June 8, resting on its (still rising) 200dma:

Since June 8, the S&P 500 is up 5.0% but only 0.8% equally-weighted while its small cap sibling is down 5.9% and the Russell 2000 is down 7.5%. Meanwhile, MSCI China is down 18.8% (but -32% since mid-February!).
Some of the culprits are from this group:

(biancoresearch.com)
Uber-Backed Ballot Measure Ruled Unconstitutional Proposition 22, which passed last November, allowed Uber, Lyft, DoorDash and other “gig economy” companies to continue treating their drivers as independent contractors.
A California judge said the November ballot measure that allowed Uber Technologies Inc., Lyft Inc. LYFT -1.92% and DoorDash Inc. DASH 1.11% to continue treating their drivers as independent contractors is unenforceable and unconstitutional.
The companies, which spent more than $200 million to pass Proposition 22 in November, said they would appeal the ruling. (…)
Superior Court Judge Frank Roesch said in Friday’s ruling that Proposition 22 limits the state legislature’s authority and its ability to pass future legislation, which is unconstitutional.
“We believe the judge made a serious error by ignoring a century’s worth of case law requiring the courts to guard the voters’ right of initiative,” said Geoff Vetter, a spokesman for the companies’ Proposition 22 campaign. “This outrageous decision is an affront to the overwhelming majority of California voters.” (…)
Uber, which has a larger global footprint, has had to make concessions outside the U.S. It agreed to grant its U.K. drivers an employment status entitling them to vacation pay and pension contributions after exhausting its legal options in March.
Cryptocurrency Miners Move Out of China The companies face many hurdles as they move their machines out of a country that previously used two-thirds of the global energy dedicated to harvesting bitcoin.
(…) The process, called mining, has gone from something any individual with a PC could do a decade ago, to a massive industry that uses numerous computers and lots of electricity. (…) [Bit Digital] is sending [more than 20,000] machines to locations in Nebraska, Georgia, Texas and Alberta, Canada. The whole process can cost millions of dollars. (…)
Computers from China entering the U.S. are also subject to a 25% tariff. Aside from figuring out how to pack and ship the machines carefully, companies need to find facilities with ample power to move them to.
“It’s a pretty big financial impact on the miners in China,” said Fred Thiel, chief executive of Las Vegas-based cryptocurrency mining company Marathon Digital Holdings Inc. (…)
At its peak in April, bitcoin miners brought in more than $70 million a day as a University of Cambridge index pegged the annual power consumption of bitcoin mining at about 130 terawatt hours—more than that of Argentina. (…)
Beijing’s latest crackdown, which has triggered what some are calling the “great mining migration,” came as its government set ambitious goals to reduce coal use and recast China as a climate champion. Aside from the U.S., Chinese mining companies are also moving machines to countries like Kazakhstan and Russia. (…)
Florida children’s hospitals see pediatric COVID cases soar amid delta variant surge More Florida children were hospitalized with COVID-19 on Tuesday than in any other state, reflecting a rapid rise in serious illness among an age group considered to be at the lowest risk of severe outcomes from the disease and many still not eligible for the vaccine.
(…) Although cases have spiked across all age groups in Florida, a Miami Herald analysis of weekly case data revealed that the sharpest increase over the past month has occurred among kids under 12.
Although cases have spiked across all age groups in Florida, a Miami Herald analysis of weekly case data revealed that the sharpest increase over the past month has occurred among kids under 12.
Physicians and public health experts attribute the rise in pediatric hospital admissions to the more contagious delta variant of the virus that causes COVID-19 — which produces a viral load that is roughly 1,000 times higher than the original coronavirus strain — and the low rate of vaccination among those younger than 20. (…)
“In our previous iteration of the pandemic, it was more they’re positive but they’re not sick or minimally sick,” Ford said of the pandemic’s changing impact on children. “This is different. … There’s a much higher percentage of pediatric patients becoming infected and symptomatic.” (…)
[Dr.] Mestre said most of the patients admitted to Nicklaus Children’s in July were infected with the predominant strain of the virus, the highly transmissible delta variant, which made up more than 85% of samples collected by the CDC in the Southeastern United States during the two weeks that ended July 31.

 (
(


 Source:

