U.S. Housing Starts Backpedal in July
Housing starts declined 7.0% (+2.5% y/y) during July to 1.534 million units (SAAR) from 1.650 million units in June, revised from 1.643 million. Starts in May were revised to 1.594 million from 1.546 million. The Action Economics Forecast Survey expected 1.600 million starts.
Starts of single-family homes fell 4.5% (+11.7% y/y) in July to 1.111 million from 1.163 million in June, revised from 1.160 million. Starts of multi-family units weakened 13.1% (-15.7% y/y) in July to 423,000 from 487,000 in June, revised from 483,000.
Building permits improved 2.6% (6.0% y/y) last month to 1.635 million from 1.594 million in June, revised from 1.598 million. Permits to build single-family homes weakened 1.7% (+5.5% y/y) to 1.048 million after three straight months of decline. Permits to build multi-family homes rose 11.2% (6.9% y/y) to 587,000 after falling for two months.
By region, housing starts in the Northeast fell 49.3% (-44.7% y/y) in July to 73,000 after a 3.6% gain in June. In the Midwest, starts declined 6.9% (-10.5% y/y) last month to 188,000 after falling 23.2% in June. Housing starts in the South improved 2.1% (5.2% y/y) during July to 889,000 following a 7.5% rise in June. In the West, starts fell 11.3% (+23.9% y/y) to 384,000 and reversed June’s gain.


Canadian Inflation Jumps to 3.7%
The consumer price index was up 3.7% in July from a year earlier, Statistics Canada reported Wednesday in Ottawa. It last hit that level in 2011. Canada hasn’t recorded inflation above above 3.7% since 2003. Economists were anticipating the rate to increase to 3.4%, from 3.1% in June.
While this marks the fourth straight month inflation has come in above the Bank of Canada’s 1% to 3% control range, policy makers are still likely to view prices pressures as transitory. Governor Tiff Macklem, whose latest forecasts show inflation creeping up to 3.9% in the third quarter before easing at the end of the year, has warned against overreacting to the “temporary” spike. (…)
The average of core inflation readings, a better gauge of underlying price pressures, rose to 2.47% in July, the highest since 2009.
On a monthly basis, prices rose 0.6% versus a consensus estimate of 0.3%. Rising costs to own a home are one of the biggest contributors to the elevated inflation rate, following a surge in real-estate prices over the past year. (…)

Goldman Sachs:
- Lowered our full-year 2021 US GDP forecast reflecting a larger Delta variant drag on consumer spending and production
- Raised our US inflation forecast based on the impact of the Delta variant on supply chains
In the US, we expect full-year growth of 6% in 2021 (vs. 6.4% previously and 6.2% consensus) on the back of significant fiscal stimulus and widespread immunization, but see the Delta variant weighing on consumer spending and production through Q3. We have lowered our Q3 GDP forecast to +5.5%. We expect the unemployment rate to fall to 4.1% by year-end, and we believe that core PCE will likely peak in Q4 and end the year at 3.75%, before falling back to 2% by year-end 2022.
The Delta variant and other disruptions are also likely to further raise prices of supply-constrained durable goods through year-end. We now see further short-term upside for new cars, consumer electronics, and appliances, and have therefore bumped up our core PCE inflation forecast to 3.75% year-on-year at end-2021. As prices of these goods and used cars fall next year, we expect core PCE inflation to dip below 2% next summer and to end 2022 at 2%.
- Toyota will cut its planned global production for September by 40% due to chip shortages. (Nikkei via Axios)
Fed Signals Asset Purchases Likely to Slow This Year Minutes from the Federal Reserve’s July 27-28 meeting show officials debated the timing and mechanics for reducing the bank’s $120 billion in monthly bond purchases.
Minutes of their July 27-28 Fed meeting, released Wednesday, revealed an emerging consensus to begin scaling back the bank’s $120 billion in monthly purchases of Treasury and mortgage securities at any of the officials’ three remaining policy meetings this year.
“Most participants noted that, provided that the economy were to evolve broadly as they anticipated, they judged that it could be appropriate to start reducing the pace of asset purchases this year,” the minutes said. (…)
The Fed’s staff forecast presented at last month’s meeting maintained an earlier projection that this year’s rise in inflation would prove transitory. But it also held that the risks of higher-than-expected inflation exceeded the risks of lower-than-expected inflation. (…)
The Fed’s next meeting will be Sept. 21-22, and several Fed officials have said they would argue in favor of beginning to taper bond purchases shortly after that meeting if the recent run of strong hiring continues. But the minutes don’t reveal a consensus for such a step, and that, analysts said Wednesday, suggests a reduction is more likely come after the Fed’s Nov. 2-3 meeting. (…)
The minutes didn’t offer significant detail on the likely pace or composition of any tapering. Several officials thought starting the process earlier would allow for more gradual reductions in the pace of bond buying, the minutes said. Most officials also saw benefits in reducing the purchases of Treasury securities proportionately with mortgage-backed securities so they end at the same time, though some officials saw benefits to reducing the mortgage buying sooner because of economic hazards associated with a booming housing market.
ING’s take:
The minutes to the July FOMC meeting show a Fed that is pretty split on most things, but recognises that we are getting much closer to the point of tapering. Officials have offered more vocal support in recent days to earlier action and we are pencilling in a September announcement, but it is clear that the Covid resurgence could delay it. (…)
Regarding QE tapering there was a lot of discussion about whether the threat of higher inflation should prompt an earlier tapering or whether the Delta variant of Covid could “damp the recovery” and justify a delay to tapering. “Various participants” suggested a QE reduction would be warranted “in coming months” but “several” others suggested in may be more appropriate “early next year”.
Interestingly there was a characterisation that QE tapering should be emphasised as merely meaning “monetary accommodation would be provided at a slower rate” rather than being assessed as a tightening of conditions that would ultimately lead to a “predetermined course of raising the federal funds rate”. There was a heavy emphasis that the QE decisions is separate from a decision on interest rates so as to not alarm the public who may be unable to “disentangle deliberations”.
So essentially, movement in the right direction, but no imminent announcement and no real decision on how the tapering would take place regards to its composition – “most… saw benefits” from reducing agency MBS and Treasuries proportionally to end at the same time but “several” saw the benefits of focusing on MBS first. This is going to be something for the Jackson Hole conference to hammer out we suspect.
Of course, a lot has happened since the July 28th FOMC decision. The July employment report was very strong with payrolls adding more than a million jobs when revisions are included, the unemployment rate falling and wages picking up. We have also seen more evidence casting doubt of the “transitory” view surrounding inflation with pipeline price pressures still building, corporate pricing power on the rise and inflation expectations looking decidedly less well anchored at 2% than the Fed continues to lead us to believe (see chart below).
On the negative side we have also seen the resurgence of Covid take greater hold and the seventh largest ever drop in the University of Michigan sentiment is an obvious concern for the outlook, at least in the near-term.
Source: Macrobond, ING
Just as importantly, the comments from Fed officials have notable swung in favour an earlier and swifter taper since the robust July jobs report. A “dialling back” on the level of support has been a key phrase used by San Francisco Fed Chief Mary Daly, and Esther George at the Kansas Fed with St Louis Fed President James Bullard going as far as saying “it’s not clear to me that we’re really doing anything useful here”.
Eric Rosengren at the Boston Fed agreed saying that “I don’t think the asset purchase program in the middle of labour market shortage and material shortage is necessarily as effective a tool as it was coming out of the financial crisis”. Meanwhile Robert Kaplan at Dallas argued “these [QE] purchases are not well suited to the environment we’re in now … I think the best thing to do is, early, begin weaning off that medication”.
Thomas Barkin at the Richmond Fed suggests they are “closing in” on the taper with several other, including Charles Evans (Chicago) and Raphael Bostic (Atlanta) suggesting another one or possibly two months of decent jobs growth could seal the deal.
Neel Kashkari (Minneapolis), arguable the biggest dove on the committee, is far more reticent to push ahead though and The Fed Governors, including Chair Jerome Powell, are yet to lay their cards on the table. The upcoming key event is next week’s Jackson Hole Conference where Fed officials will gather and reflect and debate the latest news and we will be looking out for his views on the situation in particular. (…)
")
COVID-19
From Nordea:
In China, workers at their second biggest harbour, Ningbo-Zhoushan port, have tested positive which have lead to a temporary closure of 25 % of the harbour. This is not first time a Chinese harbour has been closed, in June the Yantian port was closed where it took a month to return to normal. (Look out for the shipping prices once again)
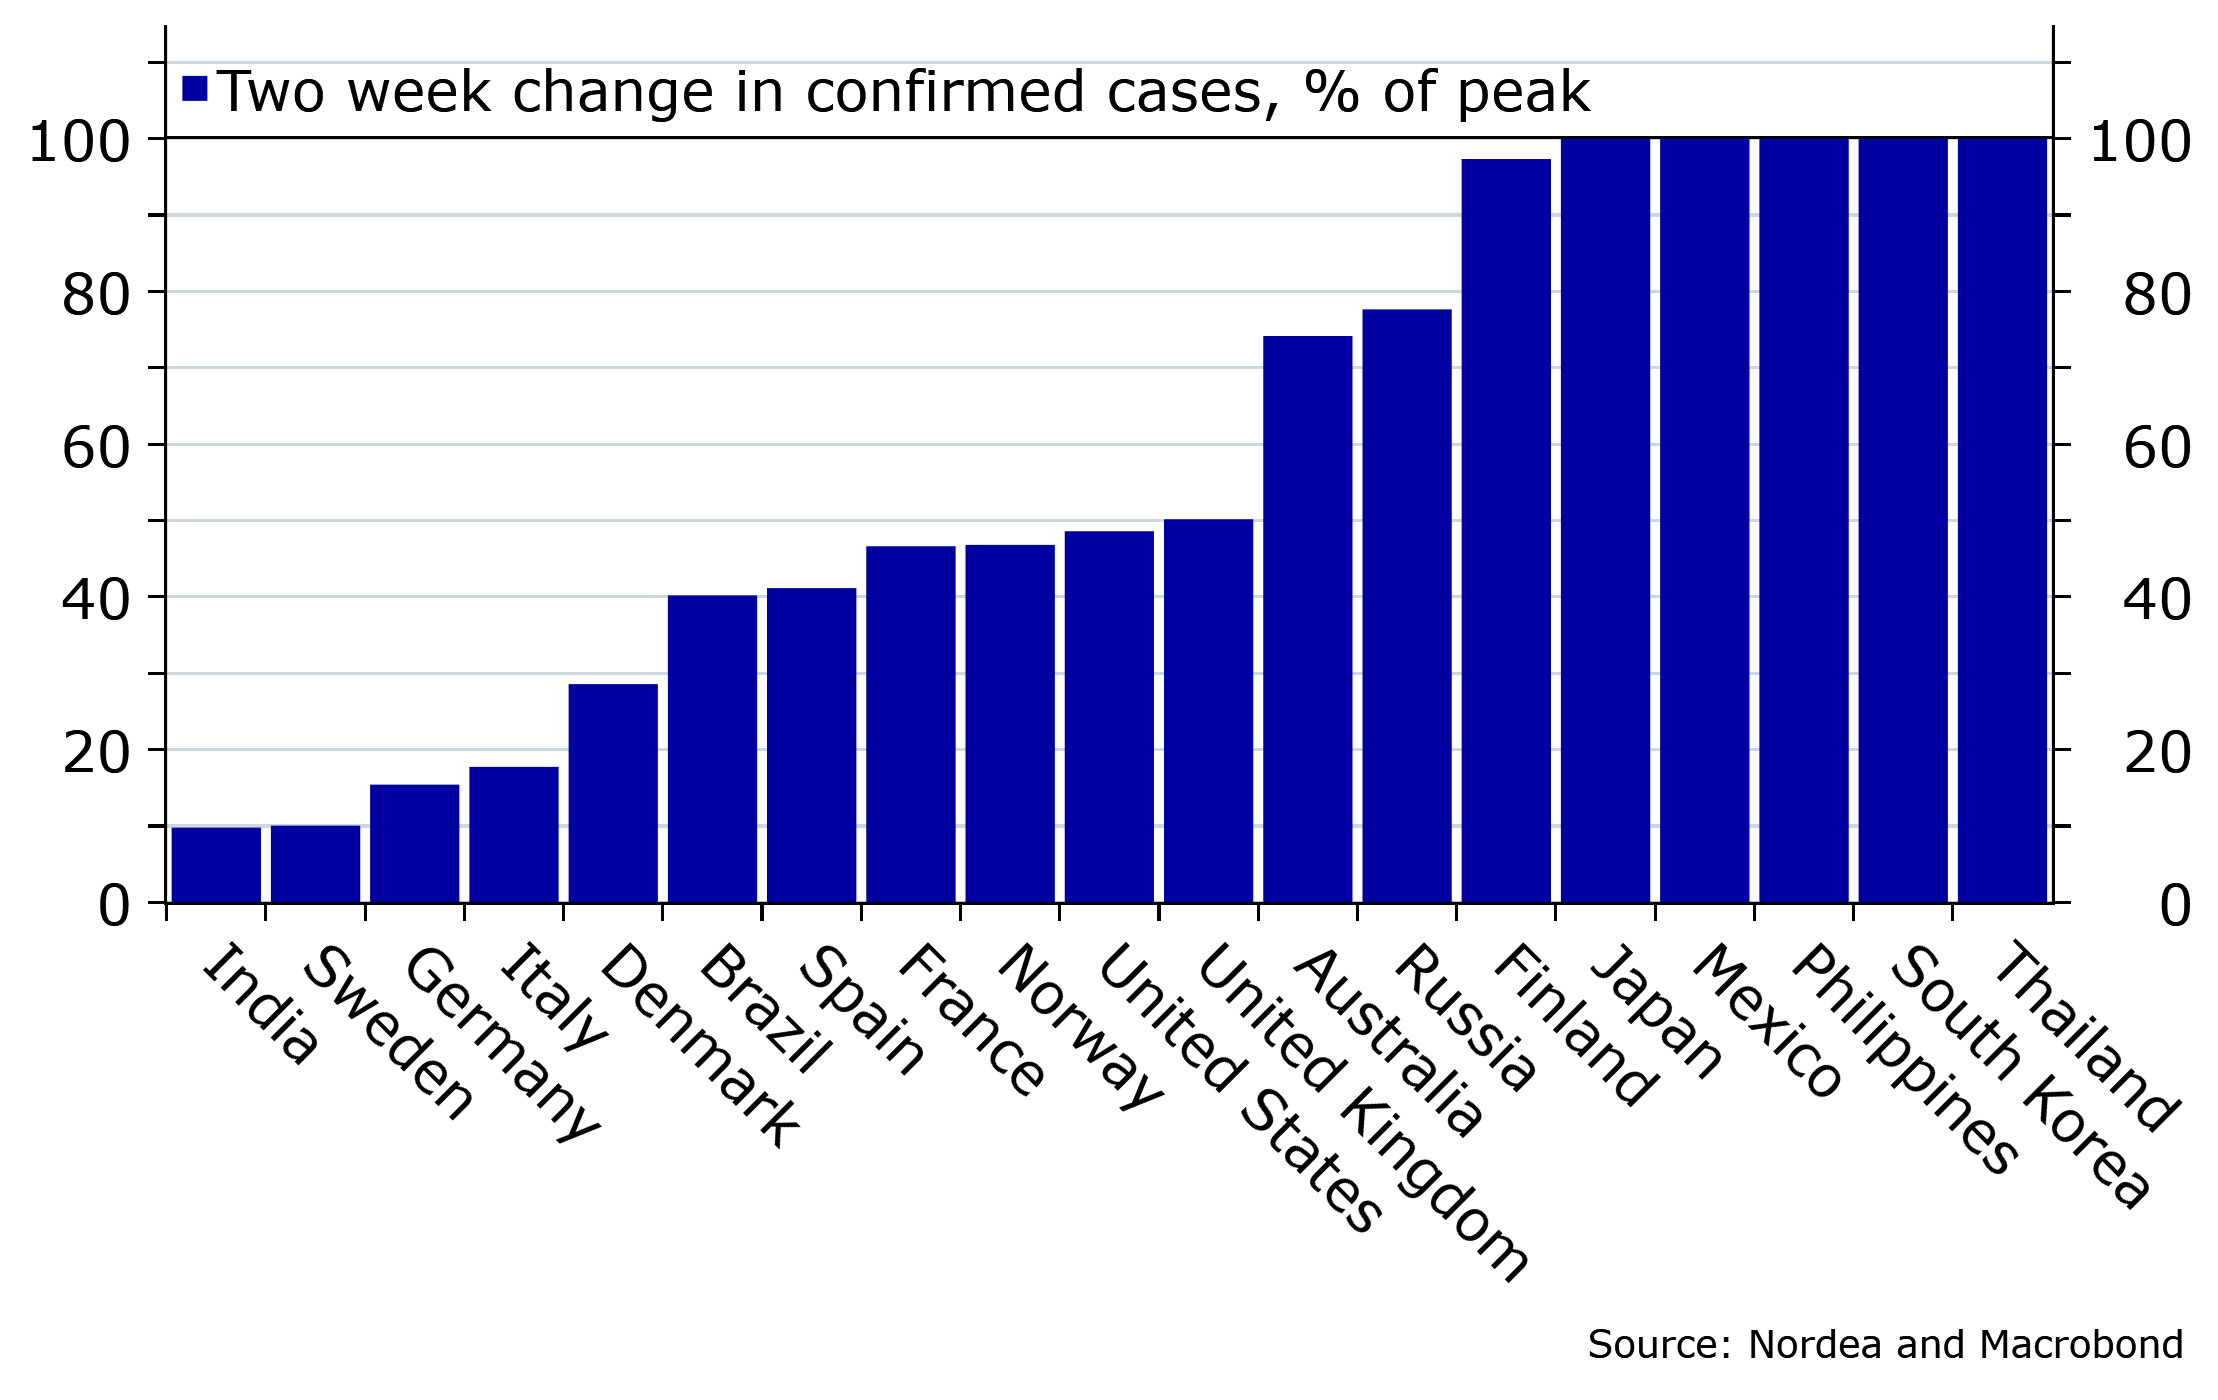
Some emerging markets are currently experiencing their biggest wave during the crisis. Especially low vaccinated countries as the Phillipines and Thailand are currently reaching new heights in the amount of cases (First wave in Thailand). A country like Indonesia has over the summer also been hit very hard but the transmission is currently steadily declining.
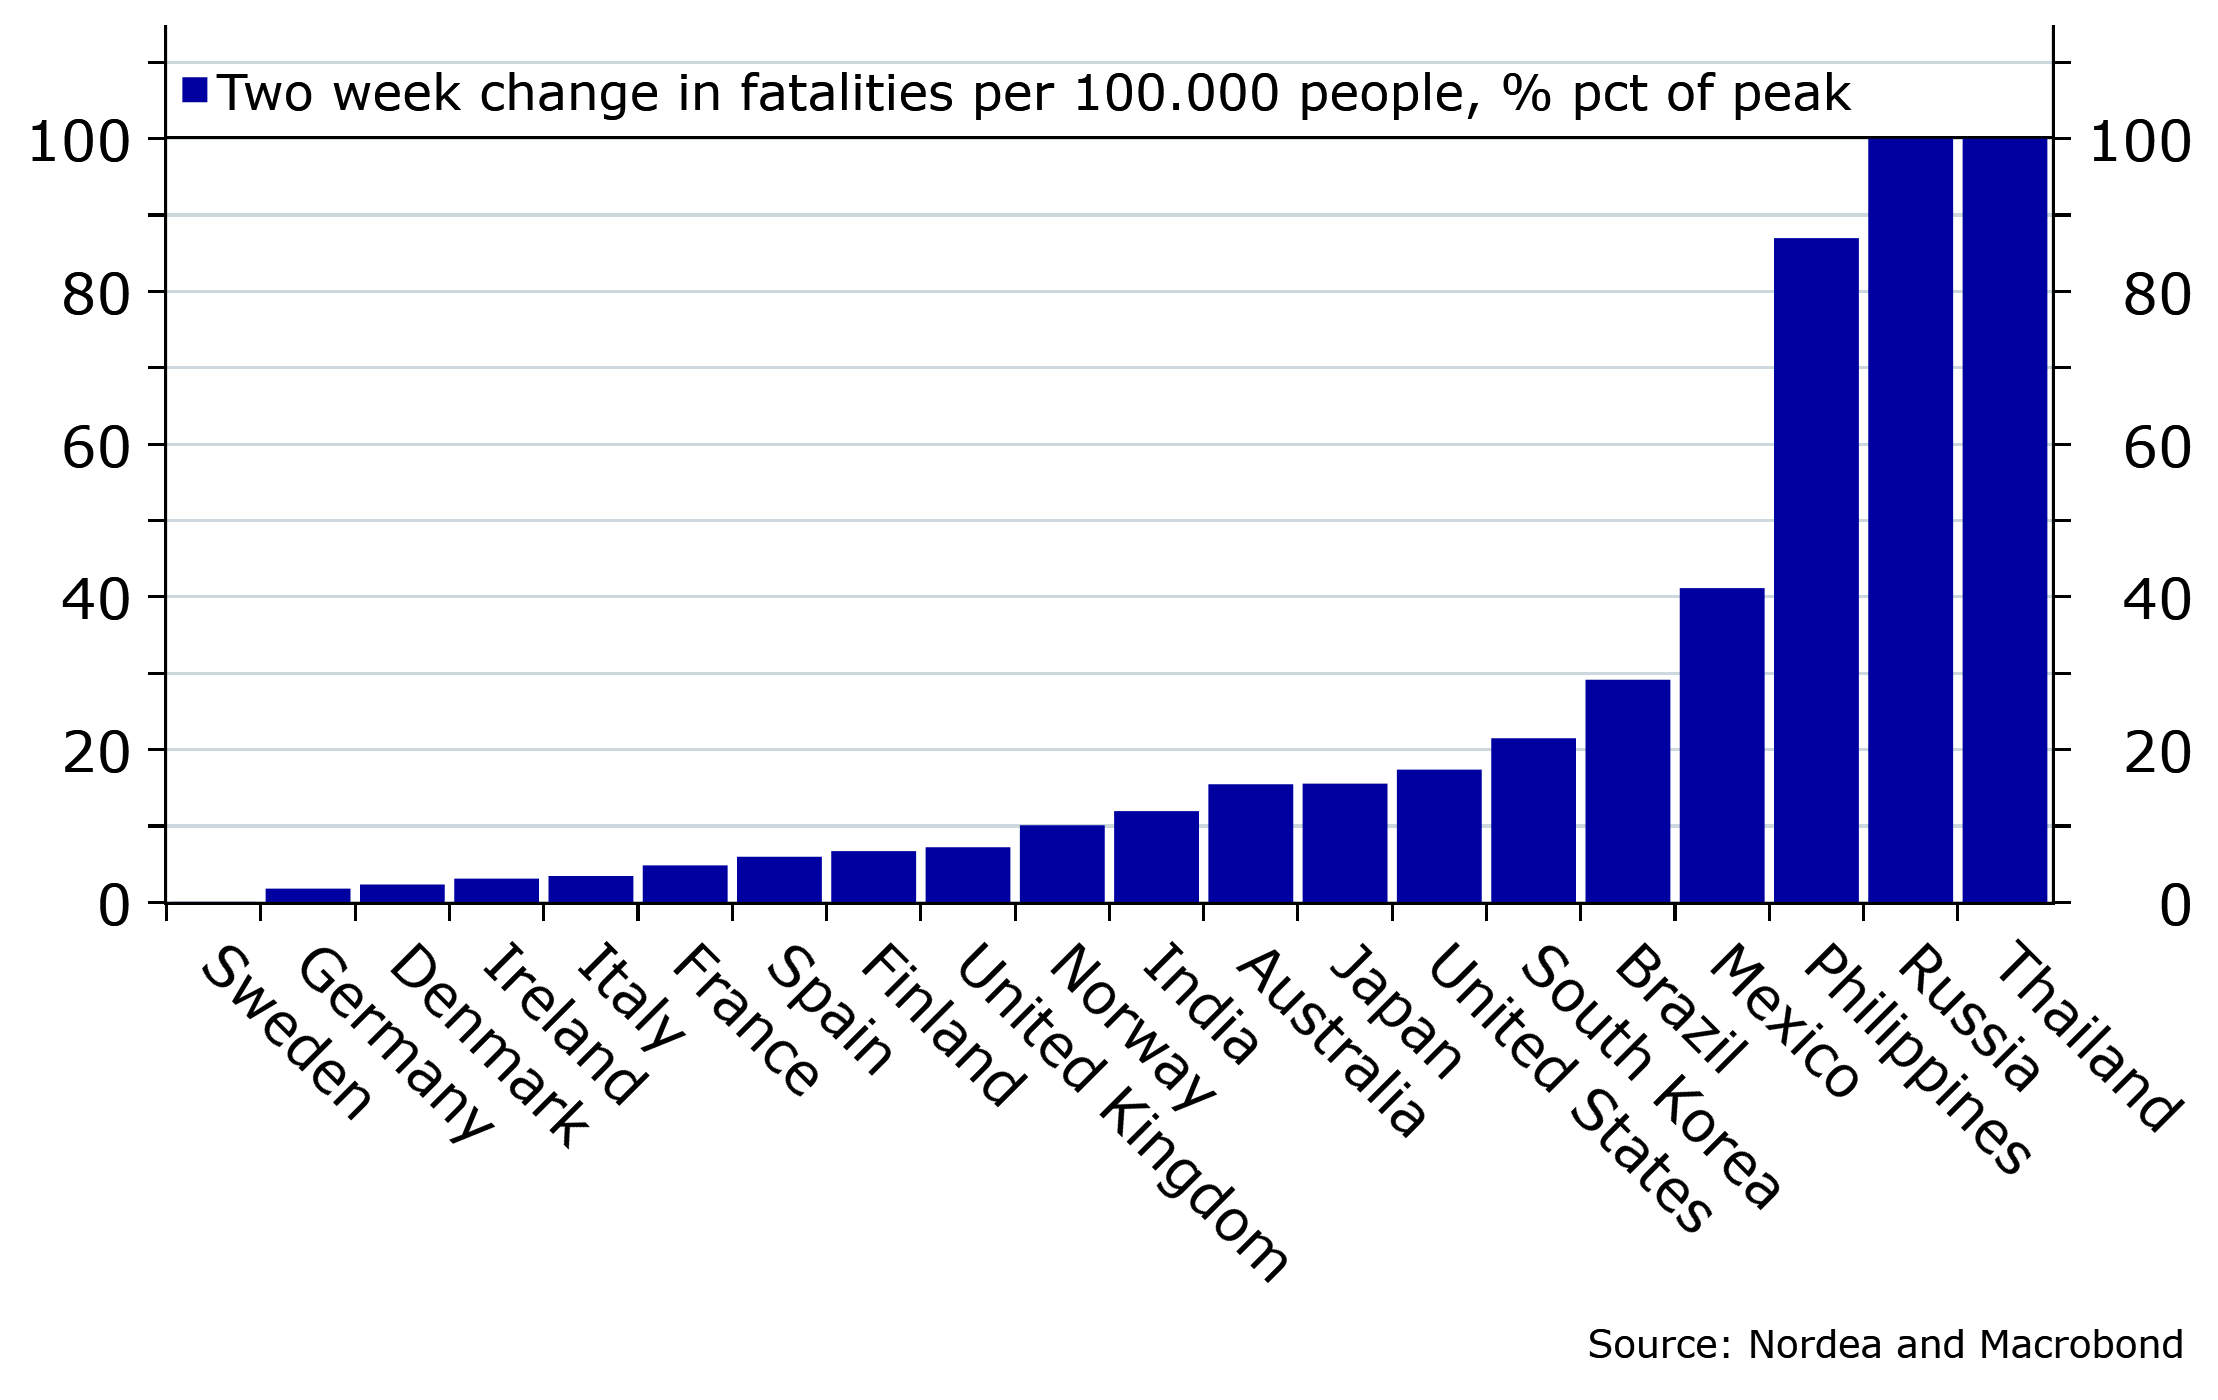
In Europe the amount of cases is still below peak levels but still higher than hoped. However, the amount of fatalities is far below earlier peak level meaning the vaccines show their strong efficiency also in the real world. This has also lead to reopening all over Europe where some kind of normality comes closer (for vaccinated people mostly).
Change in cases over the past two weeks as % of peak of the pandemic
Change in fatalities per 100.000 people over the past 2 weeks as % of peak of the pandemic
Data: CSSE Johns Hopkins University (Kansas data via CDC, Aug. 3-16). Map: Axios Visuals
- One in five ICUs throughout the U.S. had at least 95% of beds occupied last week, The New York Times reported — a figure that had doubled in recent weeks.
- Covid-19 shots are less effective against the delta variant and the protection from vaccines wanes after 90 days, a large scale U.K. study has found. While vaccination still staved off the majority of infections, people who had been inoculated were shown to carry the same viral load as those who had not been, casting doubts on the possibility of achieving herd immunity. (Bloomberg)
Robinhood tumbles 12% after warning of slowdown in retail trading
That headline is from Reuters, but Bloomberg, Fortune and Axios have the juicy stuff:
- In U.S. equities, retail as a percentage of volume dropped from the 24% peak in the first quarter to 20% in the second, which is still higher than the preceding years, Bloomberg Intelligence data show.

- (…) a little over one in every four bucks in sales Robinhood booked last quarter came from a single type of trade: Dogecoin.
- Cryptocurrency was a mega-driver of Robinhood’s second-quarter results. For the first time ever, a larger chunk of new users traded crypto first, not equities.
- Total accounts tied to a bank account jumped to 22.5 million — and over 60% of them traded cryptocurrency last quarter.
- Crypto trading made up more than half of transaction-based revenue. (Compare that to 17% in the first three months of the year, per CNBC.)
- The bulk of that Q2 crypto revenue (62%) came from Dogecoin, the cryptocurrency that started as a joke.
Robinhood warned at-home trading activity will cool off, resulting in “lower revenues and considerably fewer new funded accounts.”
Data: Robinhood filings; Chart: Thomas Oide/Axios
China Tech Rout Deepens as New Regulations Mulled; Alibaba Dives
(…) The drops came after China said it is studying proposals to further ensure the rights of drivers who work for online companies and to step up oversight of the live streaming industry. Sentiment also soured after Tencent warned the industry to prepare for more regulations including potential substantial changes to how companies use data for advertising.
Beijing’s recent crackdowns on the tech sector wiped off about $1 trillion of market value from Chinese shares listed globally last month as they quickly expanded from antitrust and e-commerce concerns to private tutoring, data security and online content. (…)
China Dip Buyers Finally Reach ‘Breaking Point’ After 56% Loss After several crushing months, dip-buyers are finally starting to abandon Chinese tech stocks.
The $4.9 billion KraneShares CSI China Internet Fund (ticker KWEB) has posted two straight days of outflows, putting the exchange-traded fund on track to break its five-week streak of inflows, according to data compiled by Bloomberg. That’s as losses approach 60% from its mid-February high, with China’s wide-ranging regulatory crackdown battering fund mainstays from Tencent Holdings Ltd. to Alibaba Group Holding Ltd. (…)

Chinese Bad-Debt Manager Huarong to Be Bailed Out by State-Owned Firms China’s top manager of distressed assets said it would post a massive loss and expects to receive a capital infusion from state-owned financial institutions, avoiding a messy default.
China Huarong Asset Management Co., which is majority owned by China’s Ministry of Finance and the largest of the country’s managers of nonperforming loans and other bad debt, also said it has no plans to restructure its debt, cementing beliefs among investors that many Chinese institutions are too big to fail.
Late Wednesday, the company said it expects to post a net loss equivalent to about $16 billion for 2020. (…)
Huarong said five state-owned financial firms, including Citic Group, fellow bad-debt manager China Cinda Asset Management and an investment unit of China Life Insurance Co. , have signed an agreement to purchase newly issued shares, though it didn’t detail how much capital they planned to contribute.
(…) investors were encouraged that the Chinese government would provide support to systemically important companies. (…)
Huarong, however, plays an important role in the country’s financial system. Created in 1999, it is among an elite group of state-appointed asset managers that help Chinese commercial banks dispose of defaulted loans, which enables the lenders to make new ones. (…)


")


