Inflation Stays High as U.S. Economic Rebound Continues Inflation remained elevated in July, but showed evidence of cooling as the economic recovery continued amid pandemic-related supply problems and the recent rise in Covid-19 infections.
Consumer prices rose 5.4% in July from a year earlier, the same pace as in June, the highest 12-month rate since 2008, the Labor Department reported Wednesday.
On a monthly basis, however, price pressures weakened. The department’s consumer-price index climbed a seasonally adjusted 0.5% in July from June, a significantly slower pace than its 0.9% increase in June from May, though well above the average 0.2% rate from 2000 to 2019. (…)
The so-called core price index, which excludes the often volatile categories of food and energy, increased 4.3% from a year before, down from a 4.5% annual increase in June. Month to month, the core CPI rose 0.3%, also down sharply from the 0.8% average increase in the previous three months. (…)
Airfares dropped slightly in July, reversing a sharp rise in recent months, and they remain below pre-pandemic levels, the Labor Department said.
Prices for hotels and motels rose again in July, having surpassed 2019 levels in June. Prices for eating out shot up 0.8% in July from June, the biggest monthly increase since February 1981, driven by a rapid rise in fast-food prices. (…)
But used-car price growth slowed sharply in July, as prices rose 0.2% from June, after jumping at least 7.3% in each of the previous three months. New-vehicle prices picked up 1.7%, a slightly slower pace from June. Both are up markedly from pre-pandemic levels. (…)
Both [rent] measures climbed in July at the same pace as in June, with rent up 0.2% from the prior month, while owners’ equivalent rent rose 0.3%. Rent has risen steadily since late last year, when it was suppressed by a combination of pandemic-related forces, including an exodus from higher-rent big cities. (…)
Adam Tannenbaum, whose company owns workforce-housing units in central Pennsylvania, was surprised when tenants proved willing to accept recent rent increases on the order of 10% or more a year.
He said he was stunned when a bidding war broke out over a Columbia County, Pa., unit in May. “We advertised it at $725 thinking the economy’s not that strong out here. Well, it got up to $950—that’s when I stopped it,” said Mr. Tannenbaum, a managing principal at The Denali Companies, a workforce-housing investment firm. On top of that, the winner was also willing to pay six months up front plus a security deposit before moving in, he said. (…)
(…) Used-car prices are just one of the many elements of inflation that seem likely to cool off as shortages and supply-chain bottlenecks get resolved. It could be a drawn-out process, though. The semiconductor shortage that has hampered new-car manufacturing hasn’t gone away, and though auto companies’ production schedules suggest they will be making more cars in the months ahead, inventory levels don’t look likely to fully recover until some time next year. (…)
Wednesday’s report showed that prices for lodging at hotels, motels and the like rose 6.8% in July from a month earlier and are now 8.8% above their pre-pandemic level. That is reflective of the surge in customers as more people started traveling again and the difficulties hotels have faced recruiting staff. (…)
More broadly, wages also have been picking up: Last Friday’s jobs report showed average hourly earnings have risen at a 5% annual rate over the past three months. That will lead many businesses to at least try to offset higher labor costs by charging higher prices.
The final result might be a moderation in inflation from where it has been recently, but no return to the very low levels that persisted before the pandemic. (…)
This is from the WSJ Editorial Board:
(…) When does transitory, in the Federal Reserve’s inflation lingo, become persistent? (…)
Notably, the “core” CPI that strips out volatile energy and food prices increased 0.3% in July and 4.3% over the last 12 months. Prices last month rose for most goods and services including toys (0.4%), pet products (1.4%) and haircuts (2.2%). Rents climbed (0.4%) and have been accelerating.
Food prices surged 0.7% while restaurant meals rose 0.8%, the most since 1981. None of this is any surprise to Americans who have visited a supermarket or eaten out lately. Labor costs are rising as businesses have to raise wages to attract workers who can make more unemployed. The result: Higher prices.
The worker shortage is also contributing to supply-chain problems and raising rates for shipping, as well as causing delays in getting products to customers. Rising energy prices are feeding into higher production and transportation costs and ultimately consumer prices. (…)
Real (after inflation) average hourly earnings have declined for seven consecutive months (overall 2%) and nine of the past 12 months. (See the nearby chart.) Contrast this to the year before the pandemic when wages rose broadly while inflation was in check. Real average hourly earnings increased 1.4% in the 12 months from August 2018 to July 2019 compared to a 1.3% decline over the last year. (…)
The White House knows it has an inflation problem—political and economic—but its attempts to explain it are more amusing than persuasive. On Wednesday there was a plea for OPEC to pump more oil (see nearby). The Council of Economic Advisers and White House budget office also released a report explaining that its “proposed critical investments” expanding the welfare state would address what it calls “long-standing cost pressures.”
So spending more to goose demand amid scarce supply, and borrowing trillions of dollars more to make it harder for the Fed to tighten monetary policy, will subdue inflation. Yikes. Who writes this stuff? The White House will have better luck with OPEC.
The Cleveland Fed’s stats all point upward:

The MoM data: last 3 months annualized vs previous 3 months: Median CPI: +3.2% vs +2.4%. Trimmed-Mean CPI: +5.3% vs +3.25.

The BLS has new series supposedly to help us better appreciate underlying inflation taking away “used cars and trucks” along with other items:
- “All items less food, shelter, energy, and used cars and trucks”: up 5.7% a.r. in the last 3 months, +4.9% in the last 2 months, +3.6% last month.
- “Goods less food, energy, and used cars and trucks”: up 8.2% a.r. in the last 3 months, +6.8% in the last 2 months, +6.0% last month.
Guggenheim has the positive spin:
Latest CPI Validates Transitory Nature of Inflation Spikes
(…) Despite the slowdown in used car prices, and declines in airfares and car rentals, the CPI components that we have been calling “transitory” still accounted for nearly half the monthly increase in core CPI. This was due to increases in hotel prices, which are now 5 percent above the pre-COVID peak, as well as new car prices. New car prices continue to be affected by low inventories amid the semiconductor shortage, leading to a sharp spike after years of moving sideways. That shortage has been trending in the right direction, as seen in recent PMI data, but recent COVID outbreaks in Asia threaten to delay supply chain normalization.
Spike in New Car Prices Shows Extent of Supply Chain Disruptions
CPI New Car Index, Feb. 2020 = 100
")
Source: Guggenheim Investments, Haver Analytics. Data as of 7.31.2021.
While supply may remain constrained for several more months, consumers are showing a lot of price sensitivity, suggesting falling demand will help limit the extent of more price increases. It’s interesting to compare this to the 1970s, when consumers exhibited inflationary behavior by increasing demand to get ahead of price hikes. That is clearly not the dynamic today, where it appears that consumers may be delaying purchases in the expectation that prices will fall again.
Hmmm…Maybe consumers are delaying purchases because of the lack of available cars. And about price sensitivity, trust lenders to adjust rates and terms to keep monthly payments in line. For instance, auto loan rates averaged 4.6% before the pandemic. They are now 4.18%. You can now finance a vehicle over 84 months!
ING is not optimistic:
Broadening US price pressures builds case for swifter Fed action
The annual rate of inflation has seemingly peaked, but the details show a broadening out of price pressures. This indicates inflation is likely to be more persistent and pervasive than predicted by the Federal Reserve. With consumer inflation expectations also on the rise the case for earlier policy stimulus withdrawal is building. (…)
The details show stability in used car prices (0.2% MoM) after their recent surge while apparel prices were unchanged on the month and airline fares fell 0.1% after having risen sharply in recent months. These three relatively soft figures are the main reason for the downside surprise on the core inflation figure.
However, there is a sense of a broadening out of price pressures with most other components either reporting the same MoM increase as last month or higher. For example, recreation showed a big acceleration (0.6% MoM), medical care posted its fastest increase since February (0.3%) and housing costs posted another 0.4% MoM increase.
We suspect that we have passed the peak for the annual rate of inflation given the stretched YoY price comparisons between a pandemic hit economy in 1H20 and a vibrant re-opened economy seen in 1H21 will fade through 3Q21. Nonetheless, we are not as optimistic as the Federal Reserve in thinking that we will quickly get back down to the 2% target area.
The key reason is that the stimulus fuelled economy is booming. Demand is outpacing the supply capacity of the economy given the scarring that the pandemic has caused as evidenced in production bottlenecks and labour shortages. (…)
As a result, costs are increasing throughout the economy and the strength of demand means that companies have a sense of more pricing power then they have experienced in years. As the chart of NFIB data below shows we are at 40-year highs in terms of the proportion of companies raising prices and for the proportion expecting to raise them further in coming months.
As such, imminent major declines in inflation look unlikely. (…)
NFIB survey points to ongoing price pressures 
Source: Macrobond, ING
The chart below suggests that housing components of inflation will be the story to watch through the second half of this year and could add nearly a full percentage point to annual inflation on their own.
US house prices and the relationship with housing related CPI 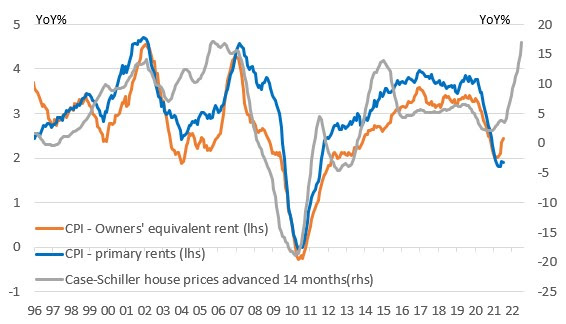
Source: Macrobond, ING
Given this backdrop we expect US headline inflation to stay above 4% through 1Q22 with core inflation unlikely to get below 3% until the summer of next year. We also expect the strong growth to story continue and with workers remaining in short supply, we see further wage pressure.
Inflation expectations have also moved higher, with the 3Y viewpoint within the NY Fed’s own survey casting serious doubt on the FOMC statement’s assertion that “longer-term inflation expectations remain well anchored at 2 percent”.
US consumer inflation expectations series (annual % change) 
Source: Macrobond, ING
We expect to see the taper start in 4Q and conclude by late 1Q22/early 2Q22, which would help to pave the way for the first interest rate increases in late 2022.
The Atlanta Fed’s Underlying Inflation Dashboard Updated

The NY Fed’s Underlying Inflation Gauge (UIG)
- The UIG “full data set” measure for July is currently estimated at 3.7%, a 0.1 percentage point increase from the previous month.
- The “prices-only” measure for July is currently estimated at 3.8%, a 0.3 percentage point increase from the previous month.
- The twelve-month change in the July CPI was +5.4%, unchanged from the previous month.
For July 2021, trend CPI inflation is estimated to be in the 3.7% to 3.8% range. The width of the range is unchanged from June, but both bounds are higher than they were in June.
This a.m.: PPI for final demand advances 1.0% in July; services rise 1.1%, goods increase 0.6%

Meanwhile,
- There were some signs of wage-price pass-through, with sizable gains in restaurant, recreation services, and healthcare prices. (GS)
- Business Inflation Expectations Increase to 3.0 Percent Firms’ inflation expectations for the coming year increased significantly to 3.0 percent, and although sales levels compared to “normal times” remained unchanged, profit margins decreased slightly, according to the Atlanta Fed’s latest Business Inflation Expectations survey.
")
Are business people’s long-term inflation expectations getting unanchored?
")
- Sales levels “compared to normal” remain unchanged. However, profit margins decreased slightly. Year-over-year unit cost growth increased significantly to 3.3 percent, on average.
")
- Approximately one-third of firms expect both labor costs and nonlabor costs to put significant upward influence on prices. About 24 percent of firms expect sales levels to put moderate upward influence on prices over the next 12 months, down from 38 percent previously.
")
")
This last chart tells us that pre-pandemic, 39% of firms expected their unit costs to rise more than 3.1% per year over the longer-term, with only 13% expecting them to increase more than 5% per year. Last June, the ratios were up to 50% and 19% respectively.
This next one illustrates employers’ difficulties finding workers: way too many jobs seeking too few willing and able people:
It is rather interesting to note that the participation rates remain down from their pre-pandemic levels except for the 55-64 Yrs group (blue line: +9.8%). The participation rate of the prime-age workers (black) has remained constant in the past year while boomers are quitting the labor force at increasing rates:


(…) for both men and women, retirement rates are much higher for those in their 70s than in their 60s—and much higher for those in their 60s than in their 50s. This matters because, comparing 2021 with 2019, the share of the population in the older of the age groups for both men and women has increased. This fact alone puts upward pressure on the overall retirement rate for the 55-and-older population between 2019 and 2021.
But in addition to an aging 55-and-older population, retirement rates have also increased within the age/gender groups. (…) the retirement rate for each age/gender group is higher in 2021 than in 2019. So not only are there more women and men of ages that have higher retirement rates, the retirement rates themselves have increased.
Chart 1 displays the results of the complete decomposition. The blue line is year-over-year change in the retirement rate of those 55 and older going back to the second quarter of 2006. The orange bars represent the part of the change in the overall retirement rate accounted for by changes in the demographic composition (the distribution of age, sex, race/ethnicity, and educational attainment), while the green bars depict the contribution to the overall change from changes in retirement rates within the demographic groups (labeled as behavior).

Notice that up until 2020, behavioral changes were generally contributing to lowering the overall retirement rate of the 55-and-older population. The loss of retirement savings during the Great Recession was arguably an important factor in reducing the ability to retire during that period. At the same time, demographics were also putting mild downward pressure on retirement, with the leading edge of the baby boomer generation still within an age range with relatively low retirement rates. However, since 2013 underlying demographic shifts have been putting upward pressure on the overall retirement rate.
During the COVID-19 pandemic, demographic and behavioral factors appear to have contributed roughly equally to the rise in retirements. Perhaps, for some baby boomers who were already likely to retire within a few years, the pandemic created an incentive to retire sooner than they might have otherwise. A look at the Federal Reserve’s Distributional Financial Accounts Overview shows that the annual growth in the net worth of those 55 and older now puts them, on average, in a much better financial position to retire than was the case during the Great Recession (see chart 2).

The ongoing aging of the baby boomer generation will continue to put upward pressure on the retirement rate over the next few years. How much the recent behavioral change will persist is much less clear, and a great deal will undoubtedly depend on the future path of the pandemic and the financial resources of older Americans. (…)
So the debate continues:
Two Federal Reserve officials said Wednesday it is time for the central bank to start reversing the easy money policies put in place to support the economy after the coronavirus pandemic hit the U.S. in March 2020.
Kansas City Fed President Esther George said the central bank has made enough progress toward its objectives of boosting growth and employment to end its $120 billion in monthly purchases of Treasury and mortgage securities. (…)
“With the recovery under way, a transition from extraordinary monetary policy accommodation to more neutral settings must follow,” Ms. George said in a speech to the National Association for Business Economics on Wednesday. “Today’s tight economy…certainly does not call for a tight monetary policy, but it does signal that the time has come to dial back the settings.” (…)
Ms. George said that with inflation running well above the Fed’s 2% target, the committee’s inflation threshold has likely been satisfied.
“I support bringing asset purchases to an end,” she said. (…)
In a separate interview, Dallas Fed President Robert Kaplan argued that the central bank should begin reducing the pace of asset purchases by October. “As long as the economy progresses as I expect, we will meet the…criteria at the September meeting,” he said. He said he would support announcing then that the Fed would therefore begin reducing purchases the following month. (…)
“You want to be gradual, but gradual for me means eight months…. I’m open-minded to faster than that, but I think eight months would be giving the markets enough time to adjust,” he said.
We now have 9 FOMC members in the more hawkish camp, 6 of them are among the 11 voters. But J.P. has the super vote.
Delta Variant Has Dented 2021 Recovery in Oil Demand, IEA Says The rapidly spreading coronavirus Delta variant and its impact on the global economy mean the world will consume less oil this year than previously thought, the International Energy Agency said.
(…) The IEA cut its 2021 global oil demand growth forecast by 100,000 barrels a day, while upgrading its 2022 forecast by 200,000 barrels a day. The world’s thirst for oil is still expected to return to pre-pandemic highs in the second half of next year, the report said.
The watchdog added that the timing of the variant’s spread has coincided with planned supply increases from the Organization of the Petroleum Exporting Countries and its allies “stamping out lingering suggestions of a near-term supply crunch or supercycle.” (…)
While the watchdog trimmed its 2021 output growth estimates for producing nations outside of the OPEC+ bloc, it raised its supply increase forecasts for next year by 100,000 barrels a day to 1.7 million barrels a day, with the U.S. accounting for 60% of that growth.
Even so, the global oil market may be “slightly short of supply” in this year’s final quarter, said the IEA, unless ongoing talks between Iran and Western nations succeed in reviving a deal that limits Tehran’s nuclear capabilities in return for lifting debilitating sanctions on the country’s oil sector, among others.
China released a five-year blueprint calling for greater regulation of vast parts of the economy, providing a sweeping framework for the broader crackdown on key industries that has left investors reeling.
The document, jointly issued late Wednesday by the State Council and the Communist Party’s Central Committee, said authorities would “actively” work on legislation in areas including national security, technology and monopolies. Law enforcement will be strengthened in sectors ranging from food and drugs to big data and artificial intelligence, the document said.
“The people’s growing need for a better life has put forward new and higher requirements for the construction of a government under the rule of law,” it said. “It must be based on the overall situation, take a long-term view, make up for shortcomings, forge ahead, and promote the construction of a government under the rule of law to a new level in the new era.” (…)
While many of the sectors named have been mentioned in previous announcements, the addition of food and drugs was new and could make investors nervous until new regulations are defined, according to Gary Dugan, chief executive officer at the Global CIO Office. (…)

Tether Holdings Ltd. released the most detailed version yet of the assets backing its widely used digital currency, seeking to address regulatory concerns that it hasn’t previously disclosed enough about the currency’s underpinnings. (…)
Roughly half of Tether’s $62.8 billion in assets were held in commercial paper and certificates of deposit, according to a report the company published Monday. It detailed for the first time the credit ratings of these notes, saying that about 93% of them were rated A-2 or higher, indicating an investment-grade, short-term rating. It said most of the assets were rated by Standard & Poor’s where available. It also relied on ratings from Fitch Ratings and Moody’s Corp.
The report said that 24% of its assets were in Treasury bills—considered among the safest to hold—up from about 2.2% detailed in May. The other roughly quarter of the reserves are held in a mix of corporate bonds, cash and small deposits. (…)
Importantly, from the auditor:
Our opinion is limited solely to the CRR and the corresponding consolidated total assets and consolidated total liabilities as of 30 June 2021, at 11:59 PM UTC. Activity prior to and after this time and date was not considered when testing the balances and information described above. In addition, we have not performed any procedures or provided any level of assurance on the financial or non-financial activity on dates or times other than that noted within this report.
The realisable value of these assets and liabilities could be materially different if any key custodian or counterparty incurs credit losses or substantial illiquidity.
How quickly, and at what value, can one sell $40B of CPs, loans, bonds and tokens, all accounting for 64% of the assets backing Tether? Assuming the breakdown has not changed on July 1, at 12:00 AM UTC. Who wants to find out?

Evergrande’s Enormous Bill Finally Comes Due China’s most indebted property company is selling off strategic assets, but that probably isn’t enough to save it
(…) Evergrande had around $104 billion of interest-bearing debt as of March, but that isn’t even the most urgent problem. It doesn’t have any bonds due until March next year. The bigger worry comes from its unpaid suppliers and contractors—many have sued to get their money back and some have managed to get some of Evergrande’s assets frozen. (…)
Evergrande had nearly $100 billion of trade payables as of December. Lawsuits and asset freezes could lead to a downward spiral as other suppliers and contractors pile on—relatively small debts from Evergrande’s perspective could be existential issues for its suppliers. Evergrande’s big creditors may be more motivated to negotiate a solution, but it is harder to coordinate with so many smaller businesses. (…)
More cautious suppliers also mean Evergrande may find it harder to complete existing projects. Other developers may be interested in buying some of Evergrande’s projects, but Beijing’s clampdown on leverage in the sector, which triggered the current crisis, may also limit their ability to do so.
The government is unlikely to let all this unfold into a disorderly scramble, especially when it involves many small businesses and buyers of Evergrande’s presold apartments. But it is also unlikely to let credit keep flowing into Evergrande to continue its debt-fueled growth. (…)
The government-endorsed Asset Management Association of China, or AMAC, has verbally informed private equity firms it would no longer be accepting the required registrations to set up funds to invest in projects, people familiar with the decision said, requesting not to be named because the matter is private. Applications that have already been made would also be denied, while existing funds wouldn’t be affected, the people said.
The suspension adds to the challenges for Chinese property developers after regulators tightened funding channels including bank loans and trust funding as part of a campaign over the past years to reduce risks. Some of the nation’s largest developers, such as China Evergrande Group, are struggling under massive debt loads built up during boom years in China’s property market and the sector is now driving a record surge in defaults in China’s bond market.
As traditional avenues of funding were choked off, real estate companies turned to private equity funds backed by high net worth individuals and institutions to raise money, often using land or cash flow income from the project sales as guarantee. Investment into real estate-focused private equity funds stood at 843 billion yuan ($130 billion) by 2020, 13.5% of the total sector, according to a report by AMAC.


 (Bespoke)


")


")


")
")
")
")
")


