U.S. Composite PMI: Softest rise in business activity since February
July PMI™ data indicated another robust expansion in U.S. service sector business activity. The upturn softened to the slowest since February, but was much quicker than the series average. Contributing to the less marked upturn in output was a softer rise in new business. Nonetheless, domestic and foreign client demand remained historically strong. In line with larger
inflows of new business, backlogs of work rose solidly and at the joint-fastest pace since August 2020. Efforts to ease pressure
on capacity was hampered by reports of a shortage of suitable
candidates.Meanwhile, input costs and output charges rose substantially despite their respective rates of inflation softening again from May’s historic highs.
The seasonally adjusted final IHS Markit US Services PMI Business Activity Index registered 59.9 at the start of the third quarter, down from 64.6 in June. This was broadly in line with the earlier released ‘flash’ estimate of 59.8 in July. The latest upturn in business activity was marked overall, despite easing to a five-month low. Greater output was linked to strong demand conditions and a sustained increase in new orders. Some companies stated that capacity constraints hampered activity growth, however.
New business continued to rise in July, and at one of the fastest rates since data collection began in October 2009. The upturn was supported by a pick-up in client demand following vaccinations and the relaxation of COVID-19 restrictions. The robust expansion was one of the quickest in over three years despite softening to the slowest since February.
At the same time, new export orders increased for the fifth month running in July, amid the further reopening of key export markets. The expansion was solid overall but eased to a four month low.
Reflecting strong client demand and a further increase in new business, service providers registered a solid accumulation in backlogs of work. Pressure on capacity also reportedly stemmed from staff shortages and difficulties hiring new workers. As a result of challenges finding staff, the rate of job creation eased for the third month running.
On the price front, cost burdens increased at a substantial pace in July. Input prices rose due to supplier shortages, while service firms also highlighted greater fuel costs. The rate of inflation was much quicker than the series average, despite easing further from May’s historic peak.
Service providers sought to pass on higher costs to their clients where possible in July. Output charges rose markedly but, in a similar manner to input prices, the rate of increase softened.
Finally, expectations regarding the outlook for output over the coming 12 months remained strongly upbeat in July. Optimism was largely attributed to hopes of further boosts to demand following an increase in customer numbers as COVID-19 restrictions relax. The degree of confidence dropped to a five-month low, however, amid concerns about the strength of customer demand over the coming months.
The IHS Markit U.S. Composite PMI Output Index posted 59.9 in July, down from 63.7 in June and falling further from May’s recent high. The rate of expansion was the softest since March amid a slower upturn in service sector activity, but was quicker than the series average.
Private sector new order growth softened to a four-month low in July, despite manufacturers registering a faster upturn in new business. New export orders, meanwhile, continued to rise solidly.
Inflationary pressures remained substantial at the start of the third quarter. Input costs rose markedly, and at one of the fastest rates on record amid significant supplier delays and material shortages. Private sector firms noted further efforts to pass on higher costs, where possible, to their clients. As a result, output charges rose at the third-steepest pace since data collection began in October 2009.
At the same time, pressure on capacity following supplier and staff shortages worsened in July. Although manufacturers and service providers registered further expansions in workforce numbers, hiring was stymied by difficulties finding suitable candidates for vacancies.


Chris Williamson, Chief Business Economist at IHS Markit:
The pace of US economic growth cooled in July, according to the final PMI data, but remained impressively strong to suggest that GDP will rise robustly again in the third quarter. Stimulus measures combined with the vaccine roll out and reopening of the economy continued to boost demand for goods and services, most notably among households and especially in consumer-facing services such as travel and hospitality.
Some further easing in the rate of expansion is likely in coming months, however, as future growth expectations mellowed considerably during the month. This waning of optimism in part reflected the likely peaking of demand in the second quarter as the economy opened up, but also reflected a rising concern over the potential for the Delta variant to disrupt the economy again.
With the survey once again bringing signs that capacity is being constrained by a lack of raw materials and labour, inflationary pressures look set to persist in the coming months, though it is encouraging to note that the overall rate of increase of selling prices for goods and services continued to moderate from May’s recent peak.
- From the ISM Services PMI (my emphasis):
WHAT RESPONDENTS ARE SAYING
- “Peak demand while still facing challenges filling open positions.” [Accommodation & Food Services]
- “The slow movement of container traffic has definitely impacted our business in the first half of the year. We expect the situation will take another year to correct itself.” [Agriculture, Forestry, Fishing & Hunting]
- “Costs have risen dramatically in the last 45 days. Lodging, fuel, travel and supplies are all rising sharply. Costs for available labor are also rising, as demand increases in a diminished labor pool.” [Construction]
- “Fuel prices are coming back down a bit. Labor shortage continues for drivers and general labor work. We have increased pay for many positions, but the shortage continues.” [Management of Companies & Support Services]
- “Supply chain disruptions continue to impact sales.” [Professional, Scientific & Technical Services]
- “Appliances, laptops and certain chemicals are still in short supply.” [Public Administration]
- “Continued shortages in computer equipment (laptops and PCs) are challenging for fulfillment needs. Corporate travel has resumed, but we’re seeing many flight cancellations and car-rental shortages. Heating, ventilation and air conditioning (HVAC) repairs also impacted by longer than normal lead times for replacement units.” [Retail Trade]
- “Ocean freight costs have created a negative impact to our business. The congestions at (the ports of) Long Beach/Los Angeles and Seattle have increased lead time by 15 days. Additional delays are occurring at the Chicago rail yard, (causing) two to three weeks of additional lead time.” [Wholesale Trade]
Wages Are Rising: How Far Will They Go?
This is from the Richmond Fed. The author complements my own Aug. 3 analysis of the ECI but adds even scarier data from their own recent survey:
(…) Recent increases in wages can be observed through national data. In June 2021 the Bureau of Labor Statistics (BLS) reported average hourly earnings of $30.40 an hour, above the pre-pandemic level of $28.51 from February 2020, and year-over-year wage growth of 3.6 percent, above the February 2020 rate of 3.0 percent.
The BLS also publishes a quarterly employment cost index (ECI), measuring the change in the cost of labor. The ECI looks at changes in employment costs within industries and occupations, making it free from influence of employment shifts among occupations and industries. Employment cost index data in the chart below show that national compensation costs (including wages and benefits) for workers rose by 0.7 percent in the second quarter of 2021, while wages alone rose by 0.9 percent. This followed strong growth in the first quarter, which saw total compensation growth of 0.9 percent and wage growth of 1.0 percent, the highest growth rates since 2007, shortly before the Great Recession.
In our Fifth District business surveys more firms have reported increasing wages than decreasing wages every month since August 2020. Furthermore, firms have reported accelerating year-over-year wage growth throughout 2021. Our July 2021 business surveys included special questions, asking firms about their expectations for wage growth going forward. Nearly 50 percent of respondents reported that they expected wage changes over the next 12 months to be greater than normal, with only 6 percent expecting them to be lower than normal.
In July, firms reported that they expected to see, on average, 7.5 percent wage growth over the calendar year 2021 and 7.1 percent wage growth over the calendar year 2022. Overall, firms’ expectations for wage growth averaged between 6.5 percent and 7.5 percent across worker skill levels in both 2021 and 2022. (…)

No clues on how far wages will go but it’s pretty obvious a wage problem is developing in the U.S.. I doubt that Goldman Sachs’ David Kostin is incorporating such wage pressures in his most recent forecast that you will find below.
The Richmond Fed’s staff seems a lot more concerned of inflation than the FOMC officials and staff. This is from a July 13 research piece:
(…) May’s PCE price report also showed an acceleration in the prices people pay for housing, a development which might have more lasting implications for the path of core inflation ahead. Housing services prices rose 0.3 percent on a monthly basis, up from 0.2 percent in April, and are 2 percent higher on an annual basis. Unlike the price indexes for services like rental vehicles and air transportation, the price level of housing services did not fall sharply at the trough of the pandemic, making the recent increases more noteworthy. On a three-month annualized basis, housing services prices have risen 2.9 percent in May, up from 2.7 percent in April and increasing for the fourth straight month.
Two main features make shelter prices particularly eye-catching in this period of elevated monthly inflation. First is a significant contribution of shelter prices to aggregate inflation: Housing services make up about 16 percent of overall PCE and 18 percent of core PCE. The second feature is that housing services prices appear to be particularly sticky. The two main components of housing services are rent of primary residences and owners’ equivalent rent (OER), which refers to the price that homeowners would pay to rent their home in a competitive market, and is imputed from surveys of rental units. Rent prices change infrequently enough that the Bureau of Labor Statistics collects rent data for sample properties every six months rather than monthly or bimonthly as for most other items. And a study by economists at the Cleveland Fed found that one of the best predictors of OER inflation was previous OER inflation — in other words, high OER inflation tends to be followed by high OER inflation.
Because shelter prices are sticky, May’s higher prices could be a harbinger of elevated inflation to come. Alternative data also point to further increases ahead. An index of rental appreciation produced by Zillow, an online real estate marketplace, rose 2.3 percent in May — the fastest monthly growth rate in data that begins in 2014 — and now stands above its pre-pandemic trend. The Zillow index measures asking rents, which may not perfectly reflect what renters are currently paying. But the recent rise in average asking rents suggests landlords are feeling more confident about raising rents as business and consumer activity strengthens over the summer. As existing contracts are renegotiated and new leases are signed, this dynamic might eventually pass through to the housing services component of inflation, and it makes shelter prices an area worth watching as market participants try to understand the extent to which recent inflation is transitory or persistent.

- First Walmart, now Target: The retailer will pay tuition for part- and full-time employees attending certain schools. (Reuters)
Interest-Rate Increases Could Come as Soon as Early 2023, Fed’s Clarida Says Significant fiscal stimulus should speed faster recovery to central bank’s goals, according to Fed vice chairman
Fed Vice Chairman Richard Clarida said he expects that, under his current projections for inflation and employment, “commencing policy normalization in 2023 would…be entirely consistent with our new flexible average inflation targeting framework.” (…)
Mr. Clarida prefaced his remarks by saying that interest rate increases are “certainly not something on the radar screen right now,” but he said that if his outlook for inflation and unemployment is realized, then the Fed’s thresholds for raising rates “will have been met by year-end 2022.”
(…) Mr. Clarida said Wednesday he could see the central bank announcing a reduction in the pace of purchases later this year.
Even though Mr. Clarida isn’t likely to be at the Fed at that time—his term on the board expires at the end of January—his comments are notable because his views are likely shared by a number of other Fed officials and because of his role in shaping the central bank’s current policy guidance. (…)
“It is important to note that while the ELB can be a constraint on monetary policy, the ELB is not a constraint on fiscal policy, and appropriate monetary policy under our new framework, to me, must—and certainly can—incorporate this reality,” he said. Mr. Clarida said fiscal policy this year, including more than $2 trillion in excess savings that haven’t been spent by households, “can fully offset this constraint.” (…)
Mr. Clarida said he thinks the risks of inflation running higher than he currently expects are greater than the risks of inflation running lower than his forecast.
Home sales in Toronto suffer fourth straight month of decline, as ‘sense of calm’ sets in
There were 9,390 home resales in the Toronto region in July, down 15 per cent from the same month last year, and down 2 per cent from June on a seasonally adjusted basis, according to the Toronto Regional Real Estate Board, or TRREB. Condos, with prices typically lower than houses, were the only type of property to see an increase in sales year over year.
Across the Toronto area, the average selling price of a home was $1,062,256, a 12.6-per-cent increase from July of last year and 0.9 per cent above June on a seasonally adjusted basis.
The home price index, which adjusts for volatility in pricing and sales, was $1,054,300, marking the second straight month of no movement after spiking 5 per cent in January. (…)
The number of new home listings was down 31 per cent year over year. But even though there was less inventory, there were also fewer buyers willing to get into frenzied bidding wars. “If it is going to be a bidding war, they are shying away and not wanting to compete. Buyers are coming in with lower offers,” she said. (…)
In other major Canadian markets, activity also slowed. On a non-seasonally adjusted basis, sales in the Montreal area dropped 18 per cent from the previous month, according to the local board. In the Vancouver region and B.C.’s Fraser Valley, sales fell about 11 per cent over the same period, according to their local boards.
Prices were essentially flat in the Vancouver area with the index price of a detached house at $1,801,100 in July. In the Fraser Valley, the index price for a detached house edged down 0.4 per cent to $1,319,200, while rising incrementally for townhouses and condos. In the Montreal metropolitan area, the median price of a single family home rose slightly to $508,000.
UK new car sales fall to lowest July level since 1998 British new car sales fell by 29.5% to their lowest July level since 1998 as the ‘pingdemic’ of people self-isolating alongside supply shortages hit demand, according to an industry body.
(…) “The next few weeks will see changes to self-isolation policies which will hopefully help those companies across the industry dealing with staff absences, but the semiconductor shortage is likely to remain an issue until at least the rest of the year,” SMMT Chief Executive Mike Hawes said.
RISK MANAGEMENT IN ACTION
Jean-Guy Desjardins, Chairman at Fiera Capital, is among the best asset mixers around. Together with Candice Bangsund, he sets the asset mix for Fiera’s clients whose assets total CAD$180B.
Fiera’s two main economic/financial scenarios changed 2 months ago from “Rapid” and “Subdued“ Recovery carrying probabilities of 60% and 25% respectively to “Reflationary Recovery” and “Inflationary Boom” with respective probabilities of 50% and 40%. A rather significant change with minimum inflation over the next 12-18 months ratcheted up from 1.5% to 2.25% and a 40% chance of 3.0%+ inflation in the “Inflationary Boom” scenario.
A growing risk to our base case scenario is that these so-called transitory pricing pressures become more engrained and de-anchor inflation expectations, which risks triggering a hawkish turn from central banks and an earlier-than expected withdrawal of monetary policy support. In this overheated scenario, the near-term spike in pricing pressures proves more enduring than expected, and lasts long enough to become embedded in inflation expectations. Supply-chain dislocations take longer to correct, while shortages and subdued participation in the labour force become more long-lasting given lingering health-related fears of returning to work, the structural shift in demographics (ageing populations), or skills mismatches in the post-pandemic reality. In turn, the persistent shortage of workers sparks a wage price spiral that cuts into the profitability of corporations and partially counters the strong top-line growth. In response, policymakers pre-emptively step-in to curtail runaway prices, which reduces the visibility and the longevity of the economic cycle. As investors digest the fallout from a tighter policy backdrop and realign their expectations, bond yields soar higher and volatility ensues, which weighs on both the economy and stock markets alike.
In this 40%-probability scenario, the S&P 500 Index would return -8.0% through the end of 2022 as opposed to +4.0% in the ““Reflationary Recovery” scenario. Fiera’s strategists are raising cash from 0% to 10% and reducing U.S. and international equities by 5% each both to underweight vs their respective benchmarks.
And from the sell-side:
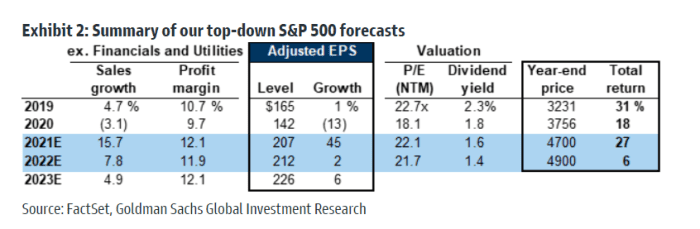
Strategists at Goldman Sachs on Thursday lifted their S&P 500 targets for both this year and next, citing better-than-expected earnings and lower-than-expected interest rates.
The investment bank lifted its year-end S&P 500 SPX, -0.46% target to 4,700 from 4,300 — implying a 7% advance to the end of 2021 — and moved its 2022 target to 4,900 from 4,600.
Strategists led by David Kostin point out that earnings per share growth has accounted for all of the major index’s 17% return this year. (…)
More from David Kostin:
We raise our EPS estimates to $207 (from $193) in 2021 and $212 (from $202) in 2022. These represent annual growth of 45% and 2%, respectively, and compare with bottom-up consensus estimates of $201 and $217. Relative to consensus, we expect stronger revenue growth and more pre-tax profit margin expansion as firms successfully manage costs and as high-margin Tech companies become a larger share of the index. Unlike consensus, we assume corporate tax reform passes and is a headwind to EPS in 2022 and beyond. In a scenario with no tax reform our EPS and price targets would be roughly 5% higher. (…)
Corporates and households will be the largest buyers of US equities. Share buyback announcements have totaled $683 billion YTD, the second largest total on record at this point in the calendar year. US money market funds have AUM of $5.4 trillion, more than $1 trillion above balances at the start of 2020.
In the near term, we expect upward revisions to EPS estimates and declining concerns about the Delta variant spread to drive equity upside, but the path of the virus and its economic impact have proven difficult to predict. Later in the year, uncertainty around fiscal and monetary policy will likely drive volatility.
Bond rally pushes global stock of negative-yielding debt above $16tn Tumbling yields defy expectations that Covid recovery would spark sell-off
- Seasonality in US Treasuries…. Seasonality in US Treasury returns is opposite to that of equities which makes August and September difficult months for the latter.

Robinhood Catches Its Own Meme Stock Spotlight With Wild 100% Surge
COVID-19
Charts from NBF:


![]() Finally, this might pique some people’s interest: Erectile dysfunction is 3x higher in covid positive men according to this study…
Finally, this might pique some people’s interest: Erectile dysfunction is 3x higher in covid positive men according to this study…

![image_thumb[21]](https://i0.wp.com/www.edgeandodds.com/wp-content/uploads/2021/08/image_thumb21.png?ssl=1 "image_thumb[21]")
![image_thumb[22]](https://i0.wp.com/www.edgeandodds.com/wp-content/uploads/2021/08/image_thumb22.png?ssl=1 "image_thumb[22]")
![image_thumb[17]](https://i0.wp.com/www.edgeandodds.com/wp-content/uploads/2021/08/image_thumb17.png?ssl=1 "image_thumb[17]")
![image_thumb[25]](https://i0.wp.com/www.edgeandodds.com/wp-content/uploads/2021/08/image_thumb25.png?ssl=1 "image_thumb[25]")
![fredgraph - 2021-08-03T124403.901_thumb[1]](https://i0.wp.com/www.edgeandodds.com/wp-content/uploads/2021/08/fredgraph-2021-08-03T124403.901_thumb1.png?ssl=1 "fredgraph - 2021-08-03T124403.901_thumb[1]")
![unnamed - 2021-08-04T074839.341_thumb[1]](https://i0.wp.com/www.edgeandodds.com/wp-content/uploads/2021/08/unnamed-2021-08-04T074839.341_thumb1.png?ssl=1 "unnamed - 2021-08-04T074839.341_thumb[1]")
![image_thumb[7]](https://i0.wp.com/www.edgeandodds.com/wp-content/uploads/2021/08/image_thumb7.png?ssl=1 "image_thumb[7]")
![fredgraph - 2021-08-04T054520.994_thumb[1]](https://i0.wp.com/www.edgeandodds.com/wp-content/uploads/2021/08/fredgraph-2021-08-04T054520.994_thumb1.png?ssl=1 "fredgraph - 2021-08-04T054520.994_thumb[1]")
![image_thumb[1]](https://i0.wp.com/www.edgeandodds.com/wp-content/uploads/2021/08/image_thumb1.png?ssl=1 "image_thumb[1]")
![image_thumb[5]](https://i0.wp.com/www.edgeandodds.com/wp-content/uploads/2021/08/image_thumb5.png?ssl=1 "image_thumb[5]")
![image_thumb[11]](https://i0.wp.com/www.edgeandodds.com/wp-content/uploads/2021/08/image_thumb11.png?ssl=1 "image_thumb[11]")
![image_thumb[13]](https://i0.wp.com/www.edgeandodds.com/wp-content/uploads/2021/08/image_thumb13.png?ssl=1 "image_thumb[13]")
![image_thumb[24]](https://i0.wp.com/www.edgeandodds.com/wp-content/uploads/2021/08/image_thumb24.png?ssl=1 "image_thumb[24]")
![image_thumb[15]](https://i0.wp.com/www.edgeandodds.com/wp-content/uploads/2021/08/image_thumb15.png?ssl=1 "image_thumb[15]")

![unnamed - 2021-08-04T075106.740_thumb[1]](https://i0.wp.com/www.edgeandodds.com/wp-content/uploads/2021/08/unnamed-2021-08-04T075106.740_thumb1.png?ssl=1 "unnamed - 2021-08-04T075106.740_thumb[1]")
