Consumer Spending Is Primed to Fuel Summer Growth Household spending leveled off last month as consumers pulled back on big-ticket goods purchases and spent more on services.
Spending was flat last month as consumers cut back on purchases of big-ticket items and rotated more of their money toward in-person services. Still, this spring shaped up to be a solid one for spending: April expenditures were upwardly revised to a 0.9% increase from a previously reported 0.5% rise. Overall spending in May was well above pre-pandemic levels, with spending on goods up nearly 20% from February 2020 and services down about 1%. (…)
The core personal-consumption expenditures price index, which excludes often-volatile food and energy items, rose 0.5% in May from a month earlier. Core prices increased 3.4% from a year earlier, the fastest pace since 1992. (…)
The personal saving rate eased to 12.4% in May from 14.5% a month earlier. The saving rate remains higher than in February 2020, when it was 8.3%. The relatively elevated saving rate signals consumers have more room to spend. (…)
Friday’s report also showed personal income fell 2% in May from April, as the impact faded from government stimulus checks sent out earlier in the year. Incomes fell in April after rising sharply in March due to the government’s disbursement of $1,400 stimulus checks to many households. (…)
This chart from ING details the income side of he equation. “Note the big improvements in income from wages and other private sources (the blue bar). With jobs coming back and wages ticking higher this, in addition to improved finances, can continue to provide really strong impetus to booming consumer demand.”
")
With data indexed to February 2020 = 100, we can see that Aggregate Payrolls (employment x hours x wages) are up 2.6% from their pre-pandemic level (even with 7.6 million (-5.0%) fewer workers) while Retail Sales are 18% higher and total Consumer Expenditures 5.3% higher.

Breaking down expenditures, spending on Services is gradually recovering but is still 1.2% below its Feb. 2020 level. Spending on Goods remains very strong with Durable Goods 33% above their pre-pandemic level and Non-Durables 12.7% above. Objectively, there are no visible signs that Americans are spent-up just yet.

The various pandemic rescue payments are creating tremors in Disposable Income (still up 9.3% from Feb. 2020), but the key data is Wages and Salaries which continue to improve and are now 5.1% above their pre-pandemic levels and, importantly, above the PCE deflator (+3.3%).

As this Haver Analytics table shows, Wages and Salaries have increased at a 11.7% annualized rate in the last 3 months, significantly outpacing total employment growth of 4.6% a.r.. Per employed American, Wages and Salaries are now 10.6% above their pre-pandemic level and up 4.4% YoY in May. Markit’s June flash PMIs released last week included the first mentions of “wage inflation”, in both manufacturing and services and in both the U.S. and the eurozone.

Speaking of inflation, FOMC members could elect to conveniently focus on the 2.5% annualized PCE inflation rate since February 2020, but it is hard, and potentially dangerous, to dismiss that the PCE and the Core PCE deflators, up 0.4% and 0.5% MoM respectively in May, have risen at +5.7% and +6.6% annualized rates respectively in the last 3 months. No base effects there.

Minneapolis Fed chief Neel Kashkari was quick to downplay the data, citing the recent decline in lumber costs in predicting that spikes will “return down to normal.” What that “return to normal” is was not specified. If “normal” is the February 2020 price, that implies another 40% drop in lumber costs.
Taking a broader look at commodities, industrial metal prices are still 144% above their pre-pandemic level and, sorry to mention these rather significant components of our daily lives, Agriculture and Livestock and Energy prices are 133% and 120% of their pre-pandemic levels respectively, per Goldman Sachs’ numbers.
Goldman is very much in Jerome Powell’s transitory camp: even though recent numbers were higher than expected, GS keeps its 2021 year-end core PCE number at +3.0% which implies that core inflation is contained to +1.0% during the next 6 months, arguing that “a higher peak also likely means greater payback later”. Likely?
From Goldman’s analysis, I would highlight a few key items:
- its Shelter Inflation Tracker has suddenly spiked up to +2.7% YoY, unlike the official PCE Shelter Index stuck at 2% from 3.0-3.5% pre-pandemic. That could be another kind of transitory phenomenon.

Zumper’s national index for June shows a 4.9 percent rise in median one-bedroom rent year-over-year and an astounding 6.5 percent rise in two-bedroom rents. This is significant because for much of 2019, rents nationally were flat. In 2020, rent growth consistently hovered around 1 percent, even as the home sales market was on fire.
That all changed in the early months of 2021. In February, rent growth for one-bedrooms jumped to 2 percent year-over-year and has been rising steadily every month since.
Collectively, the eight most expensive cities in the country — New York, San Francisco, Los Angeles, Boston, Oakland, San Jose, Washington, and Seattle — bottomed out in January when rents were down 20.1 percent relative to where they were in January 2020. Those cities are now down 15.6 percent. The next eight most expensive cities — San Diego, Miami, Chicago, Fort Lauderdale, Santa Ana, Long Beach, Anaheim, and Honolulu — were down 8.7 percent as recently as March. Those cities are now up 1.2 percent compared to January 2020. The bottom 92 cities were up by as much as 7.5 percent in July 2020 and are now up by 5.9 percent.
While the growth in the bottom 92 cities certainly contributes, it’s clear that national rent growth is being driven by the most expensive cities in the country making up some or all of the ground they lost after the pandemic hit in March 2020. Of the 100 cities Zumper includes in this report, only 24 are now down year-over-year. Of those 24, half are down by less than 5 percent.

- “Recent dollar weakness points to further moderate upward pressure on import prices.” Imports include most commodities as well as a large percentage of goods consumed by Americans. Goldman’s work suggests that inflation on imports of Consumer Goods ex-Autos could soon reach 2.0-3.0% from less than 1.0% currently.
- “Business Inflation Expectations Have Increased to the Highest Level in at Least Two Decades”. It’s now +3.1% and rising.
In the current inflation guessing game dominated by rear-view mirror analysis and wishful thinking, I give the most weight to business expectations since biz people are right in the action: not only are they witnessing what’s really happening here and now, they also have the best reading of what’s in the cost/price pipeline and of the competitive dynamics in the marketplace. GS’ measures of Business Inflation Expectations confirm the various PMI reports: costs are broadly rising and strong demand is allowing easy pass-throughs.

It may be, as Goldman suggests, that business expectations only reflect a short term view of inflation. The fact is that business people’s real world analysis strongly suggests that inflation will likely remain high in the next few quarters, seemingly higher than what pundits and policy makers currently expect or hope for.
- The last part of Goldman’s inflation analysis worth highlighting is the GS Wage Tracker: “Our composition-corrected wage tracker edged up to
+3.2% year-on-year — slightly above the pre-pandemic level — and our wage survey leading indicator has rebounded to +3.5%.” Most of the recent wage gains seem concentrated at the lower end of the pay scale, namely in the Food Services area, but shortages seem widespread amid booming demand and anecdotes abound of businesses boosting wages to attract workers (see below).
That wage inflation is currently concentrated at the lower rungs is no consolation: rising pay at the lower end can only push the whole pay scale up, eventually, even more so if inflation, including food and energy, is accelerating, prompting workers to request adjustments. Given that revenues and profits are recovering strongly, businesses seem inclined to more favorably abide to attract/retain desperately needed workers.
S&P 500 companies revenues grew 13.5% in Q1’21 and are expected to jump 18.4% in Q2. Earnings exploded 52.8% in Q1 and are seen up 65% in Q2. S&P 500 trailing EPS are now $158.37, only 2.8% shy of their 2019 level of $162.93. They could reach $191 this year, 17% higher than in 2019.
Just a few days before quarter end, analysts keep raising their estimates while corporate pre-announcements are slightly more positive than at the same time during Q1. Corporate margins don’t seem in danger so far.

That wage gains would be stronger than their pre-pandemic level even with an apparent 5% “labor slack” should actually warn policy makers that their conventional measures of labor cost pressures, few of which are currently flashing yellow or red, may not adequately catch what is actually going on given the numerous disruptions of the past 15 months.
To repeat: “Per employed American, Wages and Salaries are now 10.6% above their pre-pandemic level and up 4.4% YoY in May. Markit’s June flash PMIs released last week included the first mentions of “wage inflation”, in both manufacturing and services and in both the U.S. and the eurozone.”
Walt Disney Co. is offering $1,000 bonuses to recruit new housekeepers and select kitchen staff at its Florida theme parks, just months after laying off some 32,000 employees.
Housekeepers, making $16 an hour, and line cooks, earning $18, can receive the money if they stay on the job for at least 90 days, according to the company’s website. (…)
The overall unemployment rate in Orlando was 5.6% in April, a third of what it was a year ago.
At Florida’s Walt Disney World — which includes four theme parks and a couple dozen hotels — about 33,000 of the more than 41,000 members of the Service Trades Council Union have returned to work, according to Matt Hollis, president of that worker coalition. About 15,000 of the 32,000 workers at California’s Disneyland resort have returned, the company said. (…)
Enhanced federal unemployment benefits, enacted in the wake of the pandemic, may be one reason employees aren’t returning to work. They were set to end June 26 in Florida, which opted not to continue them, but will last until September in California. (…)
Six Flags Entertainment Corp. is offering higher wages and bonuses of up to $1,000 for employees who join by July 1. SeaWorld Entertainment Inc.’s website lists dozens of open positions, from animal trainer to overnight cleaning crew supervisor.
Southwest Airlines Co. said Friday it was increasing its minimum wage to $15 an hour and boosting compensation for 7,000 workers. (…)
A “Transitory” Selloff in Commodities
Perhaps anticipating reactions like Neel Kashkari’s above, Crescat Capital offers a divergent viewpoint:
What if we told you that the only transitory move we likely had was in the recent selloff in commodity prices? We think the hoarding of tangible assets by investors is just getting started.

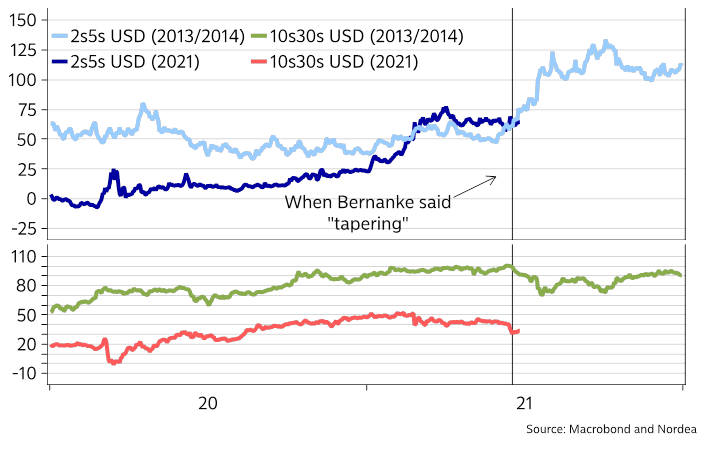
It is a striking contradiction that the Fed decided to pivot the market narrative to its openness to tapering, though not raising interest rates until 2023. Meanwhile, it just reported that it added the largest amount of assets to its balance sheet in over a year. Nearly $200 billion in the last 4 weeks. Per their own statement:
“The Federal Reserve will continue to increase its holdings of Treasury securities by at least $80 billion per month and of agency mortgage‑backed securities by at least $40 billion per month until substantial further progress has been made toward the Committee’s maximum employment and price stability goals.”
It looks like the “at least” part came in handy this time around. It was the opposite of a taper. If we could use the perfect analogy to describe their message for raising interest rates into plain words, it would be the “we are debating if we should start a diet 2 years from now”.
 (…) the fact that nominal yields rose recently in the face of larger purchases of Treasuries by the Fed tells you why policy makers are truly trapped.
 The recent growth in US government debt relative to economic growth has been astonishing. To put this into perspective, since January 2020, real GDP grew by $114 billion. Meanwhile, during the same time, government debt increased 43x that amount. This was perhaps the most unproductive use of capital that we have seen in history. (…)
- BTW on commodities (via The Transcript):
- US shale patch resists temptation for new drilling rush Oil output languishing despite high crude price as companies opt to return capital to investors
- “We’ve developed most of the easy projects and now we go into the more difficult regions of the world where there isn’t infrastructure, it’s a harder political environment and I think the mining industry is not ready to add massive new tonnes to the market. With green energy demand, I believe the mining industry will struggle to keep pace.” – Glencore (GLNCY) CEO Ivan Glasenber
- BTW on supply chains disruptions (via The Transcript):
- “My comment at this point is that the supply chain environment is stable in terms of its inconsistencies. I would not classify it as getting better, and I would not classify it as getting worse. It is consistently inconsistent…But I cannot predict for you today when the supply chain will improve back to normal, but I’m not also predicting that it is getting worse. It just continues to be a daily, weekly, monthly quarterly challenge now present in our business.” – Winnebago Industries (WGO) CEO Michael Happe
- “There’s substantive disruption occurring in the supply chain. I think we are going to see it this way for quite some time as we migrate through the second half of the year. This is going to be an issue for us for the foreseeable future. It’s our obligation to try to keep the prices as low as we can…even as we navigate this inflationary environment that we are in that I suspect is more structural than transient, despite some of the other rhetoric. There is inflation in the market across almost all facets”- Tractor Supply (TSCO) CEO Hal Lawton
- “I don’t expect the chip industry is back to a healthy supply-demand situation until 2023. For a variety of industries, I think it’s still getting worse before it gets better.” – Intel (INTC) CEO Patrick Gelsinger
The factory sector remains on a firm footing. Manufacturers’ orders for durable goods jumped 2.3% (41.6% y/y) during May following a 0.8% April decline, revised from -1.3%. A 3.0% rise had been expected in the Action Economics Forecast Survey.
Strength in transportation equipment orders propelled last month’s increase with a 7.6% jump, more than doubling y/y. The gain was driven by a surge in nondefense aircraft orders as well as a 2.1% increase (95.6% y/y) in orders for motor vehicles & parts. Excluding transportation, orders improved 0.3% (25.2% y/y) following a 1.7% rise in April, revised from 1.0%.
Orders for nondefense capital goods orders excluding aircraft eased 0.1% (22.7% y/y) following a 2.7% April gain, revised from 2.3%. (…)
Unfilled orders for durable goods rose 0.8% (-1.4% y/y). Order backlogs excluding transportation rose 1.6% (11.9% y/y).
It took a global pandemic to break this 20-year barrier:

Total U.S. manufacturing production is almost back to its pre-pandemic level but remains 7.2% below its 2007 peak.

Nonresidential fixed investment, a proxy for business spending, rose at a seasonally adjusted annual rate of 11.7% in the first quarter, led by growth in software and tech-equipment spending, according to the Commerce Department. Business investment also logged double-digit gains in the third and fourth quarters last year after falling during pandemic-related shutdowns. It is now higher than its pre-pandemic peak. (…)
Rising business investment helps fuel economic output. It also lifts worker productivity, or output per hour. That metric grew at a sluggish pace throughout the last economic expansion but is now showing signs of resurgence.
The recovery in business investment is shaping up to be much stronger than in the years following the 2007-09 recession. “The events especially in late ’08, early ’09 put a lot of businesses really close to the edge,” said Phil Suttle, founder of Suttle Economics. “I think a lot of them said, ‘We’ve just got to be really cautious for a long while.’”
Businesses appear to be less risk-averse now, he said.
After the financial crisis, businesses grew by adding workers, rather than investing in capital. Hiring was more attractive than capital spending because labor was abundant and relatively cheap. Now the supply of workers is tight. Companies are raising pay to lure employees. As a result, many firms have more incentive to grow by investing in capital. (…)
The pandemic forced companies to minimize contact between consumers and workers, resulting in a rapid increase in spending on productivity-enhancing digital technology that many economists predict will endure.
“Every part of the service economy is using technology more aggressively,” said Mr. Suttle. “Obviously it’s hard to do that without buying more product.”
Bloomberg’s Joe Weisenthal found these comments from the latest Kansas City Fed Manufacturing Survey:
- “With the lack of willing and able entry level workers, we are choosing to invest more in equipment and automation, which over time, should lead to our company to have a lower number of workers with a higher level of skills.”
- “Business activity has picked up and we are in need of upgrades to certain productive assets to maintain and increase capacity.”
- “We are looking for ways to automate and reduce the need for employees.”
PRODUCTIVITY TO THE RESCUE?
Bob Philips, CTO at 3EDGE Asset Management explains in this video how productivity could prevent a wage/price spiral.
Bob displays this chart to highlight how productivity has accelerated during the pandemic.

I would only signal that productivity seems to always accelerate during recessions so I would wait a little before concluding that Zoom and others have created a new productivity era.
Unit labor costs have also sharply accelerated since 2019. Will they drop in coming quarters like they did in the previous two recessions?

FED TALK
(…) One option suggested at the [FOMC] meeting was to start scaling back the mortgage-bond purchases earlier or more quickly than the Treasury debt purchases, officials said. Call it a two-speed taper. (…)
Other Fed officials argue against the idea, saying the combined purchases of mortgage and Treasury securities lower long-term interest rates overall—not just mortgage rates. They say other factors are contributing to the hot housing market, including a dearth of homes for sale relative to strong demand. (…)
New York Fed President John Williams, said last month that the mortgage-bond purchases, “dollar for dollar, have pretty powerful spillovers into other financial conditions such as corporate bond rates and other kinds of similar securities.” He reiterated this past week that the Fed’s asset purchases aren’t “specifically targeted to the housing market.” (…)
Fed Chairman Jerome Powell hasn’t publicly weighed in on the debate. (…)
The purpose of the Fed’s asset purchases is to support the entire economy rather than a specific sector. Slowing the mortgage-bond buying before the Treasury purchases would undermine that rationale by tailoring it according to the condition of the housing sector. It would also suggest the Fed is using monetary policy to address a concern about the stability of the financial system arising from elevated home prices—something Fed officials have long been reluctant to do, said Roberto Perli, head of global policy at Cornerstone Macro. (…)
If that survey is any realistic, housing demand is about to collapse on its own price weight…
 (The Market Ear)
… unless investors keep investing. John Burns Real Estate Consulting reckons that investors accounted for 24% of recent purchases in Houston, Tx..
(…) “But it wouldn’t surprise me based on the current projections of what we’re seeing in the data that that criteria could be met as soon as the end of next year,” he said during an interview with Yahoo Finance.
Rosengren said he expects the U.S. economy to grow by about 7% this year, and for inflation to be slightly above 2% next year. While there is currently still slack in the labor market, the U.S. economy could approach full employment by the end of this year or the beginning of next year, he said. (…)
Rosengren said he thinks the “substantial further progress” goal has been met for inflation, which he expects will slow down going into next year as supply imbalances are resolved. He said the labor market may reach the Fed’s standard for tapering asset purchases before the start of next year. (…)
(…) In March, just five of 18 Federal Open Market Committee participants thought risks to inflation were weighted to the upside. In June, that had risen to 13. In other words, a solid majority of Fed officials think inflation is more likely to turn out higher rather than lower than projected. (…)
As long as this increase really is transitory, the Fed should be fine. And on that, the Fed has an important ally: the bond market, which thinks inflation is going to fall back. But if these supply shocks push up public expectations of inflation, which tend to be self-fulfilling, the Fed has a problem. It could no longer stick to its plan of waiting for full employment to return before tightening monetary policy. While Mr. Powell said the rise in expectations hadn’t yet reached worrisome levels, “We don’t in any way dismiss the chance.” And in that event, he said, “We wouldn’t hesitate to use our tools to address that. Price stability is half our mandate.”
 (The Market Ear)
Authorities in Israel and Australia imposed new Covid-19 restrictions in response to the spread of the highly infectious Delta variant of the coronavirus, while India warned of a worrying new mutation, emphasizing how the morphing pathogen continues to challenge a return to pre-pandemic life world-wide.
In Israel, the government on Friday reimposed an indoor-mask requirement and other measures, and parts of Sydney, Australia’s largest city, will go into a rare lockdown for at least a week as officials seek to curb outbreaks of the variant that fueled India’s ferocious Covid-19 surge in April and May.
The Delta variant is now in dozens of countries world-wide, and public-health officials in the U.S. say the variant, also known as B.1.617.2, is likely to become dominant in the country next month. (…)
The WHO says the variant is spreading rapidly among unvaccinated populations, including in Africa, where it has been detected in 14 countries, including in most samples detected in Uganda and the Democratic Republic of Congo.
Indian officials say B.1.617.2 has itself mutated in a way that is causing concern. The versions of Delta that contain the new mutation, designated K417N, have been detected in at least 11 countries, including the U.S., U.K. and Japan, according to government health agency Public Health England.
Indian officials are calling the new versions Delta Plus, and scientists say there is no evidence that Delta Plus is significantly more transmissible or that anyone who catches it is more likely to die than with the Delta variant. But studies done on other variants containing the mutation indicate it might help the virus sidestep some of the body’s immune response. Lab research also indicates that the mutation might diminish the effectiveness of some monoclonal antibody treatments. (…)
India has fully vaccinated about 4% of its population of more than 1.3 billion.
(…) the [Israel] government delayed allowing foreign nationals to enter into the country for tourism from July 1 to Aug. 1. The government this week expanded its vaccination campaign to include all 12- to 15-year-olds after a jump in infections among schoolchildren in a town in central Israel. The outbreak has since quickly spread geographically and to other groups of the population. (…)
About half of adults infected in the outbreak of the Delta variant of Covid-19 in Israel were fully inoculated. These so-called breakthrough cases—defined as positive Covid-19 test results received at least two weeks after patients receive their final vaccine dose—are broadly expected as the Pfizer vaccine is highly effective but not 100% foolproof, according to Mr. Balicer.
Israeli health officials are optimistic that even if the variant does spread, evidence from countries such as the U.K. indicate the vaccine will prevent a large increase in severe illness and hospitalizations that plagued the country’s health system in previous outbreaks.
The rapid spread of Delta in the U.K., where it accounts for well over 90% of new infections, has already led to a one-month postponement of the planned ending of Covid-19 restrictions until July 19. In the past seven days, the number of people testing positive for the virus has increased by 50% compared with the previous week, to an average of almost 13,000 daily.
The increase has mainly been in younger, unvaccinated groups, and data show the variant is making very little headway among older, vaccinated adults. (…) The U.K. has one of the highest vaccination rates in the world, with 83% of adults with at least one dose and 61% with two.
 (…) One alarming implication of the U.K. experience, however, is that even a massive vaccination campaign doesn’t get us to herd immunity. At one point there were optimistic projections that only about a quarter of people needed to be infected or vaccinated. Now it looks as though that number is much, much higher. And the longer we wait for herd immunity, the longer the virus has a chance to develop new variants, which may prove resistant to vaccines.
As it stands, the base scenario, which many are beginning to regard as a certainty, is that the pandemic is on its last legs. That is still a reasonable prospect. But the British experience has already had real world economic effects. Reopening has been postponed for a month, and the Bank of England might well have tapered its support for markets last month had it not been for this renewed outbreak. There is no reason for terror, but every reason for investors to keep a close eye on Covid figures, particularly for now in the U.K.
TECHNICALS WATCH
My favorite technical analysis firm says that the latest high in the S&P 500 was mainly the result of another rotation and was not accompanied with stronger buying nor lesser selling; the next few days should provide those missing ingredients before a clear “ok to buy” signal is given.


")

")


