U.S. Shoppers Continued Stimulus-Fueled Spending in April Retail sales were up for autos, dining out, while consumers pulled back on other goods purchases
Retail sales overall were unchanged last month from March, the Commerce Department reported Friday. That kept spending at the same pace set by March’s upwardly revised 10.7% advance [+1.0%], which was influenced by government-stimulus money for most households. (…)
Sales were up 2.9% at auto and parts dealers, where shortages in available cars have driven up prices, and 3% at restaurants and bars, a positive sign for the hard-hit industry as the U.S. economy more fully opens.
(…) sales at restaurants and bars in April were just 2% lower than their levels in February 2020, just before the pandemic took hold in the U.S.
Shoppers otherwise last month cut spending across a range of retail categories, such as clothing and accessories, furniture, and sporting goods. Sales at general merchandise stores, such as big-box retailers, and online retailers also fell. (…)
Sales in the retail control group, which excludes autos, gas stations, building materials and food services, declined 1.5% last month (+29.1% y/y) after rising 7.5% in March and 12.6% in Q1. April’s number is 20% above April 2019’s level. Total retail sales are up 21% over 2 years.

The next chart, indexed at Feb. 2020 = 100, shows that the big surge in retail sales really started this March when the $1400 rescue checks were sent and signs of a fading pandemic emerged. Given that spending on services finally started to recover in April, the sustained sales at the March high level, well above the trend in aggregate payrolls, are the first tangible signs of true dissaving amid renewed confidence that the end is in sight. Note that April payrolls (employment x hours x wages) were 1.8% above their Feb. 2020 level in spite of 8.2 (-5.4%) million fewer people at work. Average weekly earnings of all private employees are 7.7% above their pre-pandemic level.

As of May 10, the Chase consumer card spending tracker is up 14.2% over 2 years ago and is now flat vs pre-Covid trends in spite of weak spending on Travel and Entertainment.
Chase’s data, which proved too optimistic in April after being spot on in February and March, suggest continued strong spending on goods in May. The Millennials/Gen Z (+51% from Jan. 2019) and the Gen X (+30%) generations are substantially outspending the Boomers (+14%) so far but even +14% over 2 years is pretty strong.

Caveat: the $300/week enhanced unemployment benefits that are set to expire in September will be cut sooner in 18 states to incite people to seek a job. The states, all with Republican governors, include Alaska, Alabama, Arizona, Arkansas, Georgia, Idaho, Iowa, Mississippi, Missouri, Montana, North Dakota, Ohio, South Carolina, South Dakota, Tennessee, Utah, West Virginia and Wyoming.
Firms Ponder Speeding Up Plans for Return to Offices New CDC guidance on masking and social distancing for vaccinated people is throwing a wrinkle into plans for repopulating city centers.
(…) Parsing the new recommendations falls to communities and businesses, and could be especially difficult to implement for public settings such as workplaces, health researchers said, because there isn’t an easy way to determine who is fully vaccinated. Further complicating the issue is that the CDC guidance contained a raft of caveats, including statements that it is still unknown how effective the vaccines are against multiple variant strains of Covid-19 that are circulating, how long-lasting the vaccines’ efficacy will be in most people, and that people who are immunocompromised, and those who live with or care for them, should continue showing more cautious behavior. (…)
China’s Economic Recovery Slowed in April Growth in retail sales slowed sharply from the March pace; industrial output and fixed-asset investment beat expectations
(…) China’s industrial production in April was up 9.8% from a year earlier, slower than March’s 14.1% pace, the National Bureau of Statistics said Monday. Fixed-asset investment decelerated as well, to 19.9% in the January-April period from 25.6% in the first quarter.
Retail sales, a key gauge of China’s domestic consumption, underwhelmed: April’s figure was up 17.7% from the pandemic-hit level a year earlier, well short of March’s 34.2% pace. (…)
Monday’s figures on industrial output and fixed-asset investment actually exceeded the forecasts of economists polled by The Wall Street Journal, who had pegged 9.1% and 19.2%, respectively. Retail sales, however, missed their predicted 24.9%.
To strip out last year’s pandemic distortions, government statisticians and economists have benchmarked this year’s numbers against 2019’s. By that measure, official data showed industrial production up 14.1% in April, largely in line with March’s growth rate, while the pace of retail-sales slowed to 8.8% from March’s 12.9%. (…)
Chinese policy makers face a dilemma, Louis Kuijs, an economist with Oxford Economics, told clients in a note Monday: While Beijing wants to dial down leverage generally, the persistently weak consumption numbers may increase “pressure to pursue a more pro-growth macro policy that could increase financial risks and leverage.” (…)
Iris Pang, an economist with ING Group, said April’s consumption weakness may prove short-lived, with figures for the five-day Labor Day holiday at the start of May indicating robust spending.
Over the holiday, Chinese people made a total of 230 million trips, marking the first time that traveler numbers topped pre-virus levels. The nation’s box office also broke records for revenue and number of moviegoers.
Meanwhile, though fewer cities in China reported rising home prices in April, average new home prices nationwide in April were up 4.45% from a year earlier, official statisticians said Monday, following a 4.36% year-over-year rise in March—underscoring the challenge that policy makers face in reining in home prices.

U.S. Industrial Production Rises Modestly in April
Industrial production rose 0.7% m/m (16.5% y/y) in April, following an upwardly revised 2.4% m/m (1.0% y/y) rise in March (initially 1.4% m/m) and a downwardly revised contraction in February of 3.5% (reported last month as -2.6% m/m). April 2020 was the trough of the pandemic, hence the large year-on-year rise. That said, total industrial production was still 2.7% below its pre-pandemic (February 2020) level. The Action Economics Forecast Survey looked for a rise of 1.1% m/m in April. The unusually cold weather in February had affected industrial production both in February and March. The return to operation of plants that were damaged by February’s severe weather conditions in the south-central region contributed to the advance in factory output.
The index for manufacturing rose 0.4% m/m (23.0% y/y) in April, following a 3.1% rise in March despite a 4.3% m/m drop in motor vehicles and parts that continues to reflect shortages of semiconductors. Excluding the motor vehicle sector, factory output rose 0.7% m/m. Mining rose 0.7% m/m (-2.4% y/y), following the 8.9% m/m jump in March. Utilities output rose 2.6% m/m (1.9% y/y), following a 9% m/m plunge in March. The rise reflected a 2% m/m (4.1% y/y) gain in electric power generation, transmission and distribution, and a 6.1% m/m jump (-8.2% y/y) in natural gas.
Durable manufacturing output declined 0.4% m/m (36.6% y/y) in April, driven by the afore-mentioned decline in motor vehicles and parts. Durable goods output had posted a 3.2% m/m advance in March. Other categories of durables posted either small increases (computers and electronic products +0.3% m/m) or small declines (fabricated metal products -0.2% m/m).
Nondurable products rose 1.3% m/m (11.7% y/y), following a rise of 3.2% m/m in March. Chemicals posted a 3.2% m/m gain, the largest in the nondurable category. Output of petroleum and coal products followed with a monthly gain of 1.6%, and apparel and leather goods with a gain of 0.7%. Other categories, such as paper, printing and support, and plastics and rubber products recorded small declines.
Capacity utilization rose 0.5 percentage point in April to 74.9 percent, a rate that is 4.7 percentage point below its long-run (1972-2020) average.

U.S. Import & Export Prices Moderate in April, but Still Strong
Import and export price increases were less dramatic in April, but were still quite large. Import prices advanced 0.7% (10.6% y/y), down from 1.4% in March, 1.2% in February and 1.5% in January; these earlier months are indeed month/month amounts and all are slightly revised from previous readings. The April amount is very close to the Action Economics Forecast of 0.6%. Export prices rose 0.8% (14.4% y/y), following 2.4% in March, 1.6% in February and 2.7% in January, with January and March amounts somewhat revised. The April result is equal to the Action Economics forecast of 0.8%.
Among import categories, fuel prices rose “just” 0.5% in April after five months of outsized advances; as a result, the y/y increase for April was 126.9%. Nonpetroleum import costs increased 0.7% m/m, with the y/y amount “just” 5.0%. Food, feed and beverage price increases were still quite large at 2.0% for April (7.5% y/y). (…) Capital goods rose 0.3% (1.3% y/y) in April, automotive vehicles, parts and engines 0.2% (0.9% y/y) and consumer goods ex automotive were flat in the month, up 0.8% y/y. (…)

Nonfuels import prices last 3 months: +8.2% annualized.
- Inflation fears cloud US consumer sentiment Survey shows Americans are increasingly nervous about rising prices as economy recovers from the pandemic
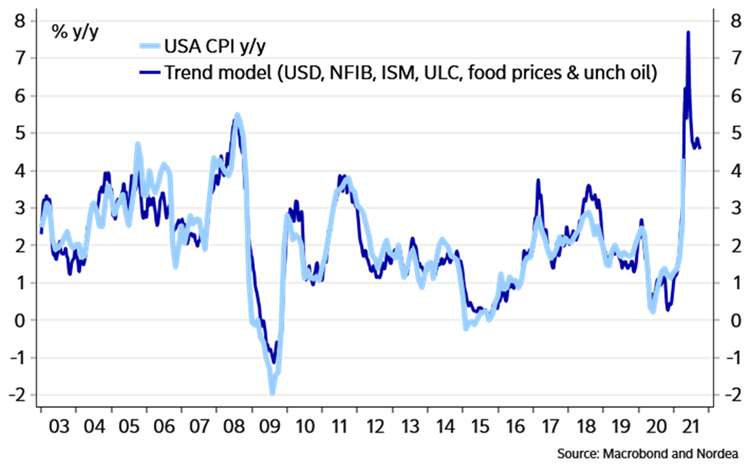
TRANSITORY WATCH
- Despite Lumber Boom, Few New Sawmills Coming Executives in the cyclical business of sawing logs into lumber say they are content to rake in cash while lumber prices are sky-high and aren’t racing out to build new sawmills.
(…) Demand has been unbowed by escalating prices. (…)
“We are going to be ultra cautious on what we do in those regards,” Canfor Corp. Chief Executive Don Kayne told investors last month when the company reported record quarterly profits. “We don’t mind at all having a little extra cash around for sure, considering what this industry goes through.”
U.S. lumber-making capacity has risen about 11% over the past five years, according to Forest Economic Advisors LLC. New mills in the pine belt between Georgia and east Texas have helped offset closures that have shrunk Canada’s capacity, but there isn’t much coming behind them. Idled facilities are restarting in Florida and Mississippi. A couple small mills are under construction out West. Four bigger mills have been announced but not begun in the South, the firm said. (…)
Besides the time and money it takes to build a modern mill, equipment, from microprocessors to heavy machinery, is in short supply. So are the sort of workers needed to operate a computerized mill, especially in the rural places where timber is abundant, Mr. Hesters said.
“Trying to build capacity and make investments that have a lot of lead time at the top of a cycle is historically a good way to lose money,” Mr. Hesters said. (…)
Added shifts and new equipment should increase output on the margins, but mill executives expect supplies to remain tight and for prices to remain high into next year. (…)
 The World Economy Is Suddenly Running Low on Everything ‘It is anything but efficient or normal.’ Surging corporate demand is upending global supply chains.
(…) Mattress producers to car manufacturers to aluminum foil makers are buying more material than they need to survive the breakneck speed at which demand for goods is recovering and assuage that primal fear of running out. The frenzy is pushing supply chains to the brink of seizing up. Shortages, transportation bottlenecks and price spikes are nearing the highest levels in recent memory, raising concern that a supercharged global economy will stoke inflation.
Copper, iron ore and steel. Corn, coffee, wheat and soybeans. Lumber, semiconductors, plastic and cardboard for packaging. The world is seemingly low on all of it. “You name it, and we have a shortage on it,” Tom Linebarger, chairman and chief executive of engine and generator manufacturer Cummins Inc., said on a call this month. Clients are “trying to get everything they can because they see high demand,” Jennifer Rumsey, the Columbus, Indiana-based company’s president, said. “They think it’s going to extend into next year.”
The difference between the big crunch of 2021 and past supply disruptions is the sheer magnitude of it, and the fact that there is — as far as anyone can tell — no clear end in sight. Big or small, few businesses are spared. (…)
For anyone who thinks it’s all going to end in a few months, consider the somewhat obscure U.S. economic indicator known as the Logistics Managers’ Index. The gauge is built on a monthly survey of corporate supply chiefs that asks where they see inventory, transportation and warehouse expenses — the three key components of managing supply chains — now and in 12 months. The current index is at its second-highest level in records dating back to 2016, and the future gauge shows little respite a year from now. The index has proven unnervingly accurate in the past, matching up with actual costs about 90% of the time. (…)
Once viewed as liabilities before the pandemic, fatter inventories are in vogue. Transport costs, more volatile than the other two, won’t lighten up until demand does.
“Essentially what people are telling us to expect is that it’s going to be hard to get supply up to a place where it matches demand,” Rogers said, “and because of that, we’re going to continue to see some price increases over the next 12 months.” (…)
Though polyurethane foam is 50% more expensive than it was before the Covid-19 pandemic, Wolkin would buy twice the amount he needs and look for warehouse space rather than reject orders from new customers. “Every company like us is going to overbuy,” he said. (…)
Whirlpool Corp. CEO Marc Bitzer told Bloomberg Television this month its supply chain is “pretty much upside down” and the appliance maker is phasing in price increases. Usually Whirlpool and other large manufacturers produce goods based on incoming orders and forecasts for those sales. Now it’s producing based on what parts are available.
“It is anything but efficient or normal, but that is how you have to run it right now,” Bitzer said. “I know there’s talk of a temporary blip, but we do see this elevated for a sustained period.” (…)
Reynolds Consumer Products Inc., the maker of the namesake aluminum foil and Hefty trash bags, is planning another round of price increases — its third in 2021 alone. (…)
A United Nations gauge of world food costs climbed for an 11th month in April, extending its gain to the highest in seven years. Prices are in their longest advance in more than a decade amid weather worries and a crop-buying spree in China that’s tightening supplies, threatening faster inflation. (…)
Instead of proving to be a short-lived disruption, the semiconductor crunch is threatening the broader electronics sector and may start to squeeze Asia’s high-performing export economies, according to Vincent Tsui of Gavekal Research. It’s “not simply the result of a few temporary glitches,” Tsui wrote in a note. “They are more structural in nature, and they affect a whole range of industries, not just automobile production.” (…)
Executives at A.P. Moller-Maersk A/S, the world’s No. 1 container carrier, say they see only a gradual decline in seaborne freight rates for the rest of the year. And even then, they don’t expect a return to the ultra-cheap ocean cargo service of the past decade. More capacity is coming in the form of new ships on order, but they take two or three years to build.
HSBC trade economist Shanella Rajanayagam estimates that the surge in container rates over the past year could raise producer prices in the euro zone by as much as 2 percent. (…)
The Cass Freight Index measure of expenditures reached a record in April — its fourth in five months. Spot prices for truckload service are on track to rise 70% in the second quarter from a year earlier, and are set to be up about 30% this year compared with 2020, Todd Fowler, a KeyBanc Capital Markets analyst, said in a May 10 note. (…)
“This is kind of a long-term issue,” Wolkin said. “Inflation is coming — at some point, you’ve got to pass this along.”

Other interesting comments from the Logistics Managers report (note that the LMI is a diffusion index: a reading above 50 indicates that logistics is expanding):
- consumers are continuing to rely heavily on methods of shopping they grew accustomed to during lockdown, such as at-home delivery or pick-up from store. These channels of consumption tend to require a greater number of trucks and more expansive warehouse networks than more traditional alternatives.
- This container shortage is expected to last into at least 2022. Ironically, the economics of this shortage seem to be incentivizing many firms to act in ways that are counter-productive to ending it. The high cost of containers is enticing carriers to get back to China as quickly as possible so they can take another load. In addition to the blank sailings coming back from the U.S. to China discussed in last month’s report, a recent trend has emerged in which ships from China are returning on the backhaul route from the U.S. with 5-8% fewer containers, exacerbating the lack of containers available to come back across the Pacific.
- Cost growth is not only limited to transportation, as for the second month in a row, Warehouse Prices have reached an all-time high in the history of the index.
- In April they are up (+2.0) to a level of 83.5. This is a function of the continued decrease in Warehousing Capacity which is down (-1.5) to 41.8 – indicating significant levels of contraction. The rate of growth for Warehousing Utilization have more or less held steady (-0.5) reading in at 71.6.
- Due to the tightness in capacity, even moderate levels of growth in Inventory Levels, are leading to rapid cost increases.
- The logistics industry remains tight, and based on future predictions and industry experts, seems likely to stay that way through the rest of the year.
Natural Gas, America’s No. 1 Power Source, Already Has a New Challenger: Batteries A decade after the fracking boom took off, the fuel faces disruption by a new combination on the electric grid: renewable energy and electricity storage.
(…) A decade ago, natural gas displaced coal as America’s top electric-power source, as fracking unlocked cheap quantities of the fuel. Now, in quick succession, natural gas finds itself threatened with the same kind of disruption, only this time from cost-effective batteries charged with wind and solar energy.
Natural-gas-fired electricity represented 38% of U.S. generation in 2019, according to the U.S. Energy Information Administration, or EIA, and it supplies round-the-clock electricity as well as bursts during peak demand. Wind and solar generators have gained substantial market share, and as battery costs fall, batteries paired with that green power are beginning to step into those roles by storing inexpensive green energy and discharging it after the sun falls or the wind dies.
Battery storage remains less than 1% of America’s electricity market and so far draws power principally from solar generators, whose output is fairly predictable and easier to augment with storage. But the combination of batteries and renewable energy is threatening to upend billions of dollars in natural-gas investments, raising concerns about whether power plants built in the past 10 years—financed with the expectation that they would run for decades—will become “stranded assets,” facilities that retire before they pay for themselves. (…)
President Biden is proposing to extend renewable-energy tax credits to stand-alone battery projects—installations that aren’t part of a generating facility—as part of his $2.3 trillion infrastructure plan, which could add fuel to an already booming market for energy storage. (…)
“This is one risk that we’re looking at, but we need to look at that risk across every technology decision we make,” said Glen Snider, Duke’s director of integrated resource planning, noting that all power investments face potential disruption.
More than 60,000 megawatts of gas-fired capacity came online in the U.S. since 2014, according to the EIA. Like coal plants, many of which have been forced to close early, gas plants were financed with the expectation that they would operate for decades. (…)
Much of the nation’s gas fleet, on the other hand, is relatively young, increasing the potential for stranded costs if widespread closures occur within the next two decades.
Gas plants that supply power throughout the day face the biggest risk of displacement. Such “baseload” plants typically need to run at 60% to 80% capacity to be economically viable, making them vulnerable as batteries help fill gaps in power supplied by solar and wind farms.
Today, such plants average 60% capacity in the U.S., according to IHS Markit, a data and analytics firm. By the end of the decade, the firm expects that average to fall to 50%, raising the prospect of bankruptcy and restructuring for the lowest performers.
“They are under threat from tons of renewables,” said Sam Huntington, IHS Markit’s associate director for gas, power and energy futures. “It’s just coal repeating itself.” (…)
Most current storage batteries can discharge for four hours at most before needing to recharge. (…)
Quantum Energy Partners, a Houston-based private-equity firm, in the last several years sold a portfolio of six gas plants in Texas and three other states upon seeing just how competitive renewable energy was becoming. It is now working to develop more than 8,000 megawatts of wind, solar and battery projects in 10 states.
“We pivoted,” said Sean O’Donnell, a partner in the firm who helps oversee the firm’s power investments. “Everything that we had on the conventional power side, we decided to sell, given our outlook of increasing competition and diminishing returns.”
SENTIMENT WATCH
The Rise of Inflation Expectations Consumers are doubting that prices will remain ‘well-anchored.’
This is from the WSJ Editorial Board:
(…) the University of Michigan’s Survey of Consumers (…) shows expectations for rising prices have jumped this year and now anticipate an increase of more than 4%. This monthly consumer data can be volatile. But another signal is from the Philadelphia Fed’s survey of economic forecasters, which showed five-year average inflation expectations popping in May to 2.4%. That may not seem like much, but that survey rarely moves. The Fed’s inflation target is 2%.
The risk is that as inflation expectations rise, they become embedded in consumer behavior and business decisions. Workers demand higher wages to keep up with prices no matter the underlying productivity; businesses pay to keep those workers and then raise prices to compensate. Workers then demand high wages, as expectations are hard to break. (…)
[Americans] know what they are paying for groceries, a new or used car, or to call in the plumber. They’ll decide what’s “well-anchored” or not.
For now, investors, jittery over the short term, are buying the Fed’s “transitory” label, but are not so sure about it…

BlackRock bond chief Rick Rieder, quoted in today’s WSJ:
We don’t think inflation is going to be that high for a persistent period of time,” says Mr. Rieder, 59 years old. “But if the markets believe in inflation, well that’s more important than whether six months from now people say, ‘Gosh, you were right.’
TECHNICALS WATCH
My favorite technical analysis firm remains confident that the bull market is intact, thanks largely to the rotation from growth to cyclicals and from small to large caps, both indicating a continued appetite for stocks in general. However, that selectivity is a concern, along with continued gradual deterioration in some key readings of demand and supply. Not the best conditions for broad-based buying.
- Hot IPO Market Feels a Chill The U.S. IPO market, unstoppable for nearly a year, has hit a speed bump. With inflation fears weighing on stocks, investors have shifted away from technology shares, initial public offerings and SPACs.
Many newly listed firms, whose stocks rose after their initial public offerings, have dropped below their IPO prices. At least three companies, leery of jumping into a volatile stock market, postponed their IPOs after the S&P 500 started the week with its biggest three-day swoon in nearly seven months.
Some investors and bankers think next week could be a turning point. If the stock market calms and the public debuts of celebrity-backed Swedish oat-milk maker Oatly Group AB and software company Squarespace Inc. go well, that could shore up confidence in IPOs, they say. If volatility continues and those offerings sputter or get postponed, the IPO market could pump the brakes. (…)
On average, U.S.-listed IPOs this year—not including nontraditional methods like direct listings or special-purpose acquisition companies—were up 2.1% from their IPO prices through Thursday’s close, according to the latest data available from Dealogic. By comparison, the S&P 500 had risen 9.5% this year through Thursday’s close. The Nasdaq Composite, known for being stacked with growth companies similar to those looking to go public, was up just 1.8% this year through Thursday. (…)
So far in May, 13 SPACs have unveiled mergers, and of those, only one is trading above its IPO price. (…)
“The question everyone is trying to get their arms around is inflation, and what are we willing to pay for growth going forward,” Mr. Creedon said.
It would be nice to have profits to begin with…
The Renaissance IPO index is down 26% since its mid-February peak and is now below its 200-ay moving average, still rising mind you, but its 50 and 100 dmas are not terribly inspiring at this time.

- Spacs lose their deal ‘pop’ as fever fades Instead of popping, share prices now typically slide on takeover announcements
 I started a joke (The Bee Gees)
- Bitcoin Tumbles After Musk Implies Tesla May Sell Cryptocurrency
- Bitcoin Steadies as Musk Says Tesla Hasn’t Sold
![]() I started a joke
I started a joke
Which started the whole world crying
But I didn’t see
That the joke was on me, oh no ![]()

 Source: Chartr